 |
Review: Crucial P1 500GB NVMe SSD Reviewed by: J.Reynolds Provided by: Crucial Firmware: P3CR010 |
Introduction
Welcome to Myce’s review of the Crucial P1 500GB NVMe SSD.
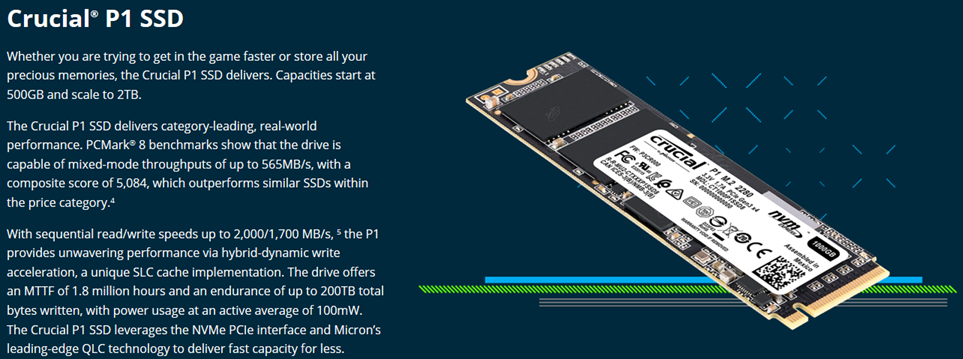
The Crucial P1 is the first drive myce.com/blog has reviewed that
uses Micron's QLC (Quad Level Cell) NAND – please see ‘NAND Basics’ below to
appreciate the difference between QLC NAND and its preceding SLC, MLC and TLC
NAND forms. Micron was the first NAND manufacturer to launch a QLC based
product.
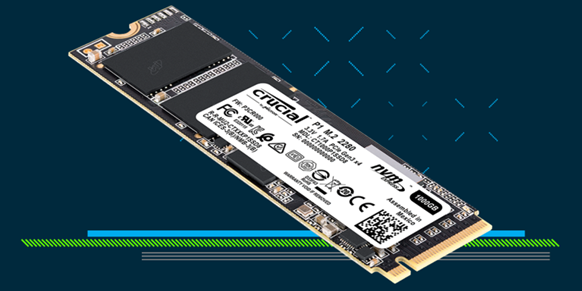
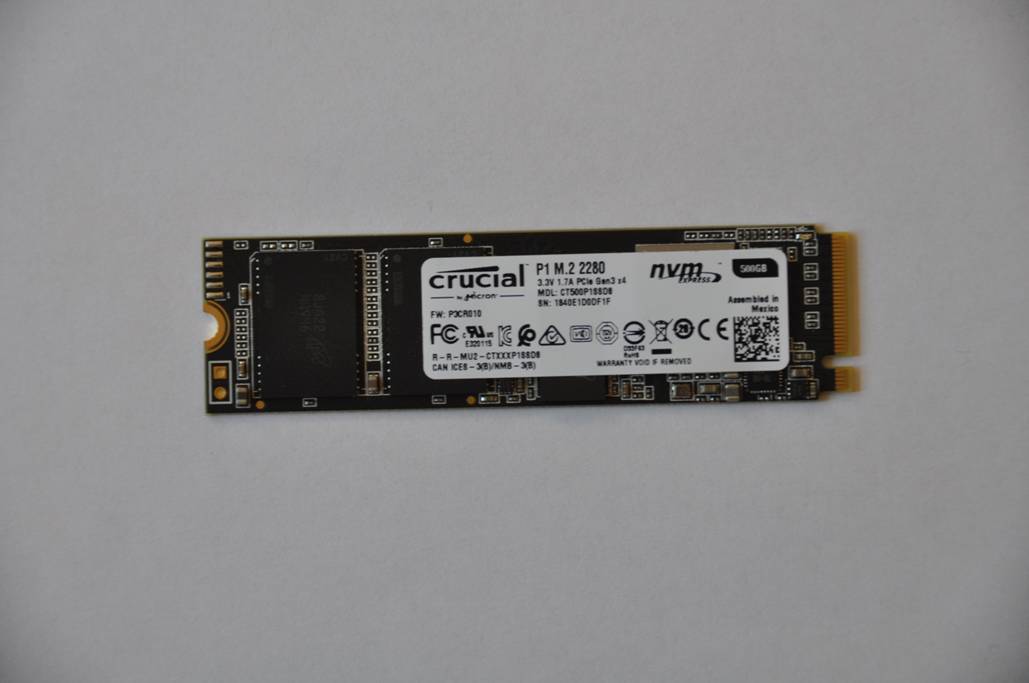
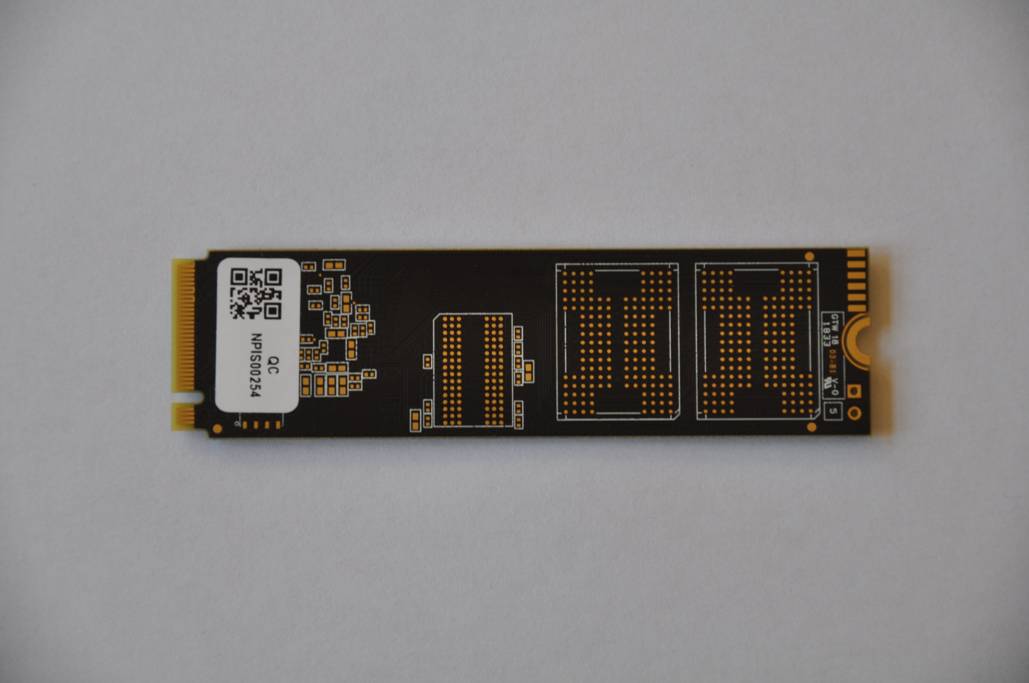
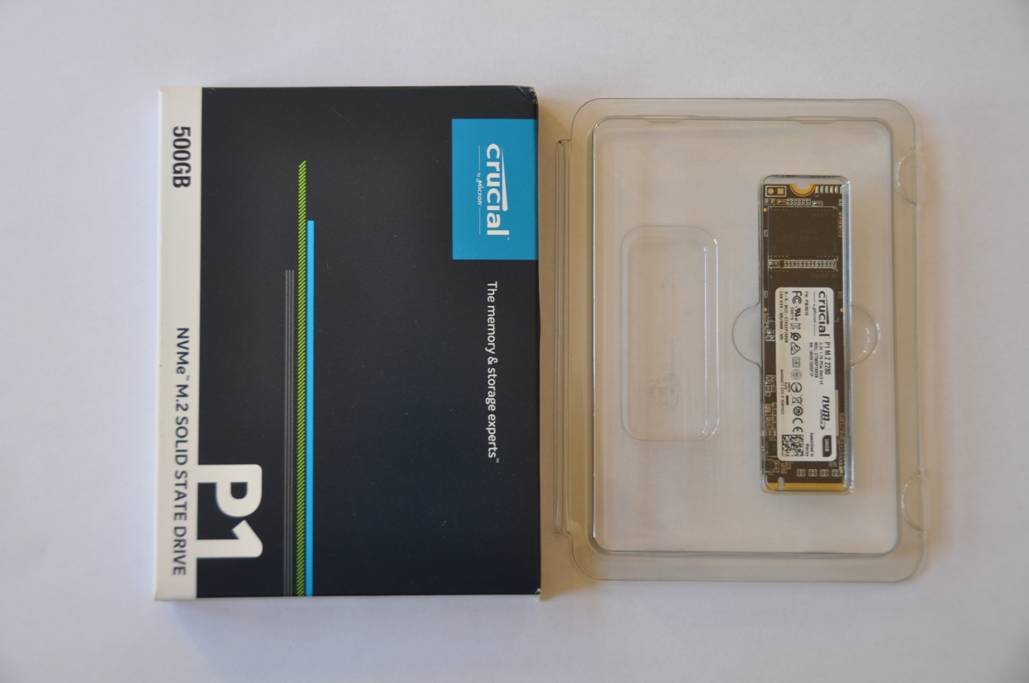
Pictures
Here are some pictures of the Crucial P1 that I tested, and
its retail packaging -
Market Positioning and Specification
This is how Crucial positions the P1 –
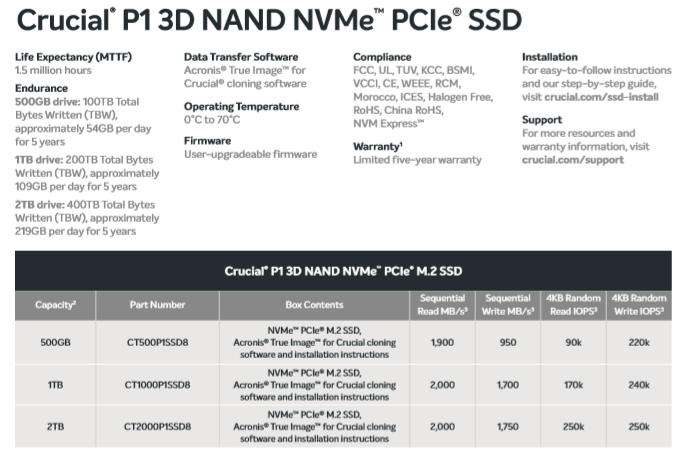
Here is Crucial’s specification for the P1 –
NAND Basics
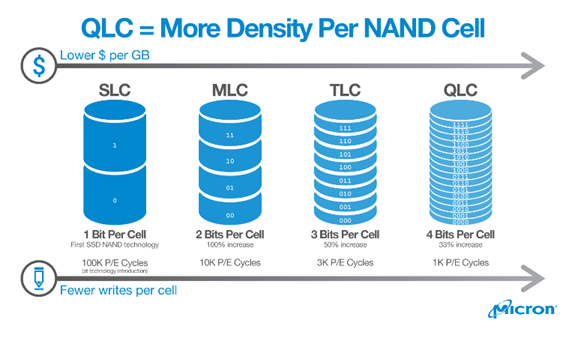
This picture shows a visual representation of the difference
between SLC, MLC, TLC. and the new QLC NAND. Essentially, each QLC cell can
hold four times as much data as SLC, TLC (Three Level Cell NAND) can hold three
times as much data as SLC, and MLC (Two Level Cell NAND) can gold two times as
much data as SLC. Please note that MLC actually stands for Multi Level Cell
but I assume that when MLC NAND was named no one imagined the advent of TLC and
QLC.
On the face of it QLC sounds much better than the other
forms but managing its use is not without some significant challenges which are
explained by Micron as follows –

So, the bottom line is.
QLC offers an opportunity to provide larger capacity
solutions because of its greater density.
QLC does not offer the same level of endurance (the quantity
of data that can be written) as SLC, MLC, and TLC, because of the increased
level of insulator wear when writing data.
QLC may not be as fast as other forms of NAND.
QLC should offer the potential for a reduction in
manufacturing costs which could in turn see a significant reduction in price per
gigabyte reduction for buyers.
Now let's head to the next page, to look at my approach
to testing Client SSDs.....
Testing Approach
When reviewing the performance of a Storage solution there
are three basic metrics to look at:
1.
IOPS – the number of Input/Output Operations per Second
2.
Bandwidth – the number of bytes transferred per second (usually measured
in Megabytes per second, ‘MB/s’)
3.
Latency – the amount of time each IO request will take to complete
(usually, in the context of Solid State Storage solutions, measured in
Microseconds, which are millionths of a second).
It is true to say that IOPS and Bandwidth had both been
growing rapidly before the advent of Solid State Storage, but Latency can only
be significantly decreased by eliminating mechanical devices, and thus Latency
is the single most important improvement that Solid State solutions deliver to
enhance performance.
Latency in a technical environment is synonymous with delay.
In the context of a Solid State solution it is the amount of time between an IO
request being made, and when the request is serviced.
Bandwidth, also commonly referred to as ‘Throughput’, is the
amount of data that can be transferred from a storage device to a host, in a
given amount of time. In the context of Solid State solutions it is typically
measured in Megabytes per second (MB/s).
A great Solid State solution offers an effective balance of
all three metrics. High IOPS and Bandwidth is simply not enough if Latency
(the delay in an IO operation) is too high.
Queue Depth is the average amount of IO requests
outstanding. If you are running an application and the Average Queue Depth is
one or higher and CPU utilisation is low, then the application’s performance is
most probably suffering from a ‘Storage Bottleneck’.
It is true to say that a typical PC user will very rarely
cause a modern SSD to see a Queue Depth greater than 1 or 2. So for Client SSDs
we need to primarily focus on performance at low Queue Depths.
Another important aspect to consider with an SSD is the
state of its NAND when an IO task begins. When an SSD is new, or immediately
following a purge (a Secure Erase for an SATA device) being performed, it is in
a Fresh out of Box (‘FOB’) state and in this state all of its Blocks of NAND
are clean and able to immediately accommodate the writing of new data.
Typically SSDs are supplied with a greater capacity of ‘Total NAND’ than their stated
‘User Capacity’ and the difference between them (Total NAND – User Capacity) is
known as an Over Provision (‘OP’) at the firmware level.
If an IO Task that involves writing new data can complete
without the supply of clean blocks being exhausted it will complete more
quickly than if blocks must first be cleaned on the fly before writes can be
accommodated. The number of free blocks available may also impact on performance
(think of it this way - the more free blocks there are the easier it is to find
one to write to). An SSD will continue to write to clean blocks until there
are no more available after which it must then free up blocks by completing an
Erase/Write cycle on the fly before it can write new data. Blocks that have
been written to are flagged as being able to be cleaned when either the logical
address they are associated with in an Operating System is written to again or
when a Trim instruction is sent by the OS to indicate that a range of logical
addresses (which map to physical blocks) no longer contain live data (for
example, in Windows, Trim instructions are sent to an SSD, when a file is
logically deleted, to indicate that all of the physical blocks which contained
the file no longer hold live data).
An SSD’s controller performs a process known as ‘Garbage
Collection’ which gathers together spaces that no longer hold live data so that
it can create clean blocks in preparation for accommodating the writing of new
live data. Blocks are contained within Pages and only complete Pages can be
erased in preparation to accommodate new writes, so one of the responsibilities
for Garbage Collection is to shuffle blocks out of partially filled pages so
that whole pages can then be cleaned. Garbage Collection can be performed as a
regular background task and on the fly. The effectiveness of an SSD’s Garbage
Collection has a significant impact on its long term performance. It is
important to note that a Trim command does not itself clean blocks and it will
always take a bit of time for Garbage Collection to follow up and actually
complete the cleaning process.
An SSD maintains a table, that can be used by an OS, which
holds the mapping of its physical blocks to logical addresses. Effectively,
the OP is increased above that set at the firmware level whilst the drive’s
user capacity is not full of live data. In Windows a user can effectively
choose to underline their commitment to increasing the level of OP by not fully
allocating the drive’s user capacity to partitions.
When a drive is compelled to clean blocks on the fly to
accommodate new data it moves from an FOB state towards what is known as a ‘Steady
State’. A Steady State is achieved when performance is steady and no longer
changes significantly over time. Testing of Enterprise SSDs is always
performed when a drive is in a Steady State. It is fair to say that typically a
Client SSD will spend most of its time in an FOB state (or near to FOB state)
and it's in this state that our testing is performed using the Desktop PC.
Remember though that one can expect to see a performance drop when the drive
holds increasing amounts of live data, as the pool of free blocks (the
effective OP) becomes smaller.
Whilst most Client SSD users need not be overly concerned
about Steady State performance we do push an SSD to its limits as part of our
testing on the OakGate Test Platform.
So what performance characteristics make for an excellent
Client SSD?
Put simply, we look for a solution that provides both
excellent Sequential IO performance and excellent Random IO performance.
Excellent Sequential performance supports the rapid transfer of large amounts
of data from one place to another, such as when copying a movie, loading a game,
or running a backup. Excellent Random IO means that a drive will support the
rapid reading, writing, and updating of relatively small files that are
randomly placed on a drive (such as is required by the Windows Operating System),
the launching of applications, or by a database based application. Sequential
performance is most often measured in terms of MB/s (Megabytes per Second) and
Random IO is most often measured in terms of IOPS (IO Operations per Second).
Modern SSDs deliver low Latency and support tens of thousands of Random IOPS
and whilst very few PC users really need support for such a high level of IOPS
it does mean that every IO will be fast.
Manufacturers most frequently quote the headline maximum
Sequential Read and Write Bandwidth for a drive. They also regularly cite the
maximum IOPS level for 4K Random Reads and Writes. Operating Systems are known
to make extensive use of the 4K IO size and this is why strong 4K Random Read
and Write performance is considered important.
I use two test platforms for testing Client Storage
solutions –
Firstly, a Desktop PC, with the following specification: CPU
– Intel Core I7 6700K, Motherboard – Asus Maximus VIII Extreme (Z170), System
Drive – Intel 750 400GB, GPU – EVGA GeForce GTX970 FTW, RAM – 32GB Corsair
Dominator Platinum, Cooler – Corsair H110i GTX, Windows 10 using Intel RST
15.7.1.1015 and with C States disabled in the BIOS, as this ensures reasonable
consistency from storage benchmarks.
Secondly, an OakGate Storage Test Platform, which is
introduced in an article that you can view by clicking here.
The OakGate Test Platform can be thought as a professional, laboratory
instrument where the test environment is managed strictly and consistently so
that test results from multiple solutions can be compared with great confidence
and precision.
The Desktop PC is used to run a cross section of the most
respected and commonly used storage performance benchmark software, including
AS SSD, Anvil, Crystal Disk Mark, ATTO, and PCMark 8 Storage, together with a
number of real world file copies. Most of these benchmark programs are freely
and easily available for you to run on your own PC. There is a good case for reviewers
to test an SSD as a System Drive, as arguably this is the way in which most
people will use an SSD. However, I choose to test drives as a spare as I
believe this makes it far easier to provide a consistent basis for product
comparisons, which I feel is most important.
The OakGate Test Platform is used to provide an accurate
baseline for a drive’s performance in all of the key aspects of performance,
including Sequential Reads and Writes, Random Reads and Writes, and Random
Mixed Reads and Writes. The OakGate Test Platform is also used to investigate
how a drive behaves when it is pushed to its limits and to measure a drive’s power
consumption characteristics. (All testing on the OakGate Test Platform is
conducted with fully random data and is aligned to 4K boundaries)
In the presentation of test results I include comparisons
with other products I have tested in the same way on the same platforms.
Now let's head to the next page, to look at the results
for the Desktop PC Synthetic Benchmarks.....
Desktop PC – Synthetic Benchmarks
AS SSD
As its name suggests AS SSD was developed specifically to
measure the performance of SSDs. It measures Sequential Read and Write
performance with an IO Size of 16MB and a Queue Depth of 1. It measures Random
4K Read and Write for a Queue Depth of 1 and for 64 Threads. 64 Threads
generates a Queue Depth of 64 (please note that SATA drives support a maximum
Queue Depth of 32, so they are at a disadvantage in this test to NVMe devices,
which support queue depths of 128 or more). The Access Time AS SSD reports is
for 512Byte sequential reads and writes.
The 4K random Reads and Writes performance is particularly
relevant to a drive’s ability to act as a Windows system drive. I use the
default test file size of 1GB.
AS SSD produces a score for Read Performance, Write
Performance and an Overall Score.
The scores are calculated as –
Overall score = (Seq Write x 0.15) + (Seq Read
x 0.1) + (4K Read * 2) + 4K Write + 4K-64Thrd Write + (4K-64Thrd Read * 1.5)
Read score = (Seq Read * 0.1) + 4K Read + 4K-64Thrd
Read
Write score = (Seq Write *0.1) + 4K Write + 4K-64Thrd
Write
For Client SSDs, I feel that there should be an
even greater loading given to the Queue Depth 1 4K Read and 4K Write results
but nevertheless AS SSD is a quick and useful benchmark. I always use a 1GB
test file. We would expect a modern SATA SSD to achieve an overall score
of 1000+.
The latest version of AS SSD can be downloaded here.
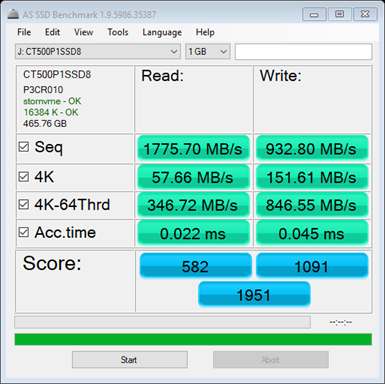
Here is the AS SSD result for the Crucial P1 -
Here is a comparison of the overall AS SSD score with the
other products I have tested –
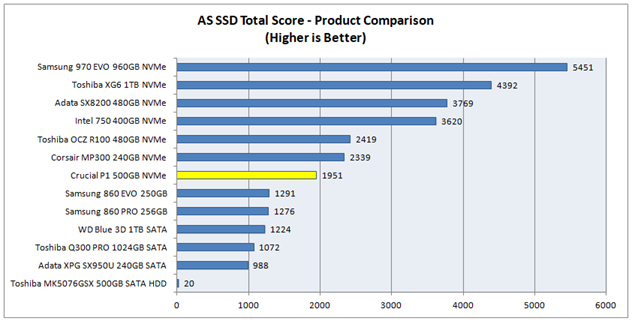
A very good score, especially for 4K random read and writes.
but sequential reads and writes are somewhat slower than the latest TLC and MLC
NVMe drives.
Anvil’s Storage Utilities
Anvil’s Storage Utilities tests Sequential Reads and Writes
with an IO Size of 4MB, Random 4K Reads and Writes at Queue Depths of 1, 4 and
16 and Random 32K and 128K Writes.
The scores are calculated as –
Overall Score = Read Score + Write Score
Read Score = (Seq 4MB = MB/s x 1) + (4K = MB/s
x 4.5) + (4K QD4 = MB/s x 2.75) + (4K QD16 = MB/s x 1.75) + (32K = MB/s x 1) +
(128K = MB/s x 1.5)
Write Score = (Seq 4MB = MB/s x 1) + (4K =
MB/s x 4) + (4K QD4 = MB/s x 3) + (4K QD16 = MB/s x 3)
I always use a Test size of 1GB and 100%
Incompressible data.
The latest version of Anvil’s Storage
Utilities can be downloaded here.
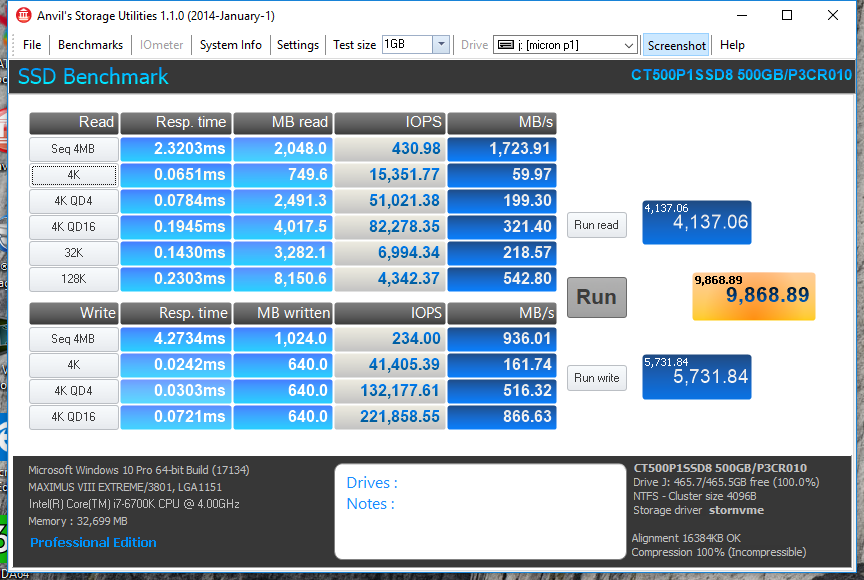
Here is the Anvil result for the Crucial P1 –
Here is a comparison of the Anvil Total score with the other
products I have tested -
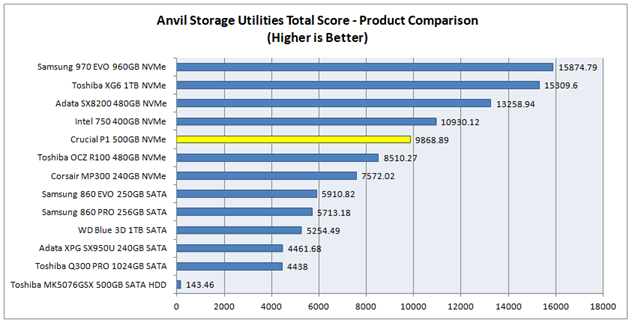
Another good score.
Crystal Disk Mark
Crystal Disk Mark is a widely respected benchmark, which is
often used by manufacturers as a basis for publishing their ‘headline’
sequential read and write speeds. I always run the test with One Thread and a
Queue Depth of 32 (which generates a Queue Depth of 32, being the maximum Queue
Depth supported by SATA drives), a 1GB test file, Random data and 3 or 5
passes. The benchmark performs sequential IO with an IO Size of 512K for the
Seq Q32T1 test, sequential IO with an IO Size of 1MB for the Queue Depth 1 Seq
test and Random IO with an IO Size of 4K for the 4K (Queue Depth 1) and the 4K
Q32T1 test.
Crystal Disk Mark can be downloaded here (I use the
standard edition).
Here is the CDM result for the Crucial P1 -
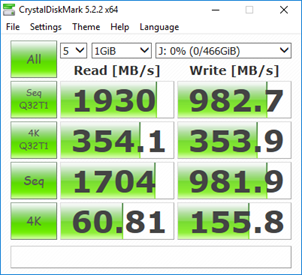
You can see that the headline Sequential Read and Write
Speeds, as specified by Crucial, of 1900 MB/s and 950 MB/s respectively, have
been surpassed.
ATTO
The ATTO benchmark tests Sequential IO for a large range of
IO Sizes. I always run the test with the default Queue Depth of 4.
ATTO can be downloaded here.
Here is the ATTO result for the Crucial P1 -
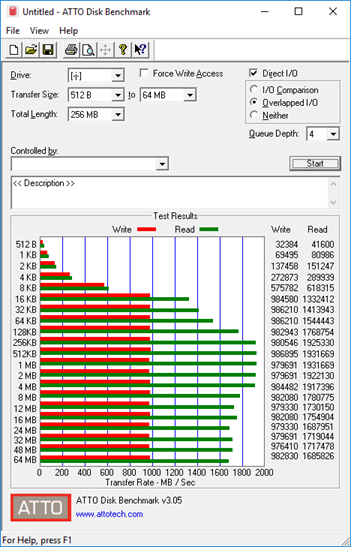
Again, the headline Sequential Read and Write speeds have surpassed
Crucial's specifications.
Now let's head to the next page, to look at the results
for the Desktop PC Real World Benchmarks.....
Desktop PC – Real World Benchmarks
PCMark 8 Storage Benchmark 2.0
This is how Futuremark describes the PCmark 8 Storage
Benchmark –
PCMark 8 Storage benchmark is ideal for testing the
performance of SSDs, HDDs and hybrid drives.
Using traces recorded from Adobe Creative Suite,
Microsoft Office and a selection of popular games, PCMark 8 Storage highlights
real-world performance differences between storage devices. You do not need to
have these applications installed on your system to run the Storage benchmark.
The PCMark 8 Storage benchmark test contains the
following workload traces: Adobe Photoshop light, Adobe Photoshop heavy, Adobe
Illustrator, Adobe InDesign, Adobe After Effects, Microsoft Word, Microsoft
Excel, Microsoft PowerPoint, World of Warcraft and Battlefield 3
You can read a detailed description of each storage test and
how the overall score is calculated in the PCMark 8 Technical Guide by clicking
here.
The results from this benchmark are, I feel, a valuable
insight into how a drive will support real world applications.
I thank Futuremark for providing Myce with a license to use
PCMark 8 Pro.
Here is the result for the Crucial P1 -
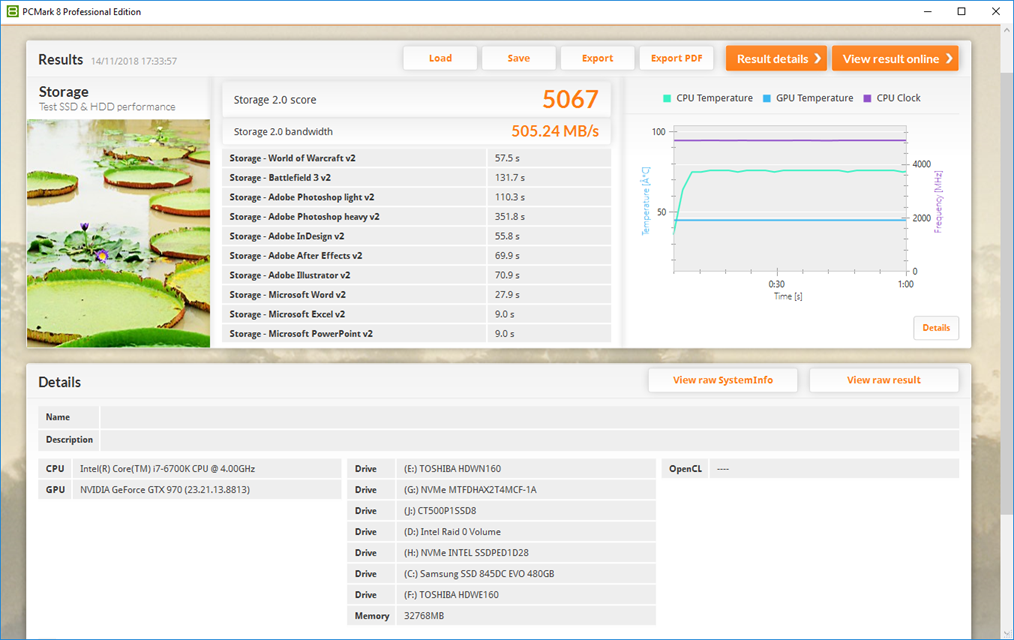
Here is a comparison of the overall score with the other
client products I have tested -
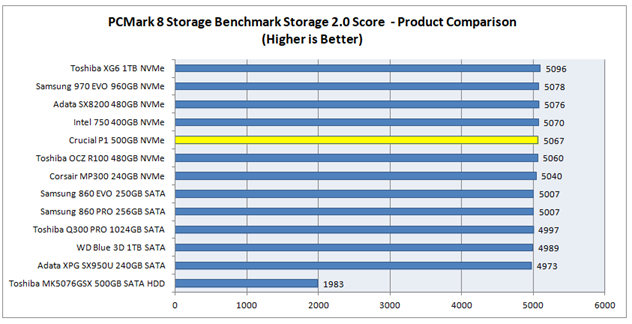
A very good result.
File Copy Benchmarks
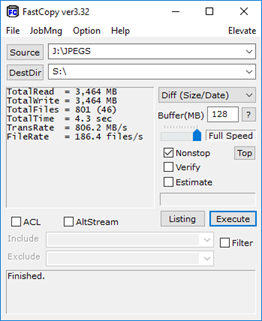
FastCopy is a useful program for recording how long copying
files to and from a drive takes. FastCopy can be downloaded here.
A Ram Disk (a virtual drive held in RAM) is used as the
source drive when a file is ‘copied to’ the test drive and is then used as the
destination when a file is ‘copied from’ the test drive. This ensures that the
test drive is on the critical path for the time taken.
Here are the results -
Copy a Blu-ray Movie to the Crucial P1
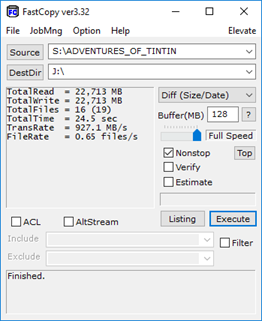
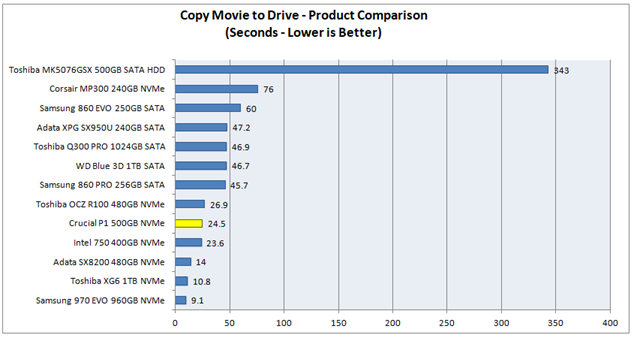
An excellent result.
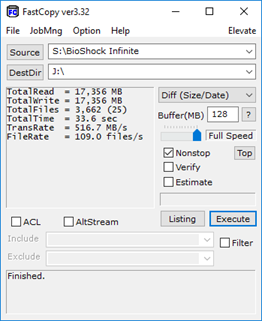
Copy a Blu-ray Movie from the Crucial P1
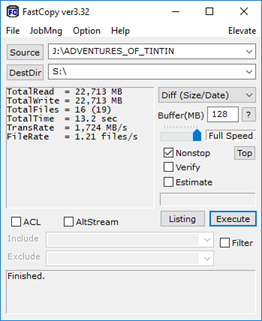
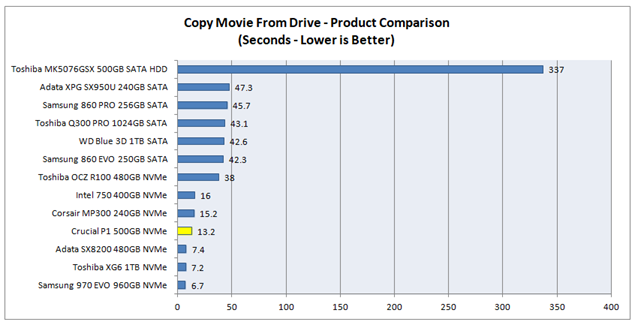
Another excellent result.
Copy a Game to the Crucial P1
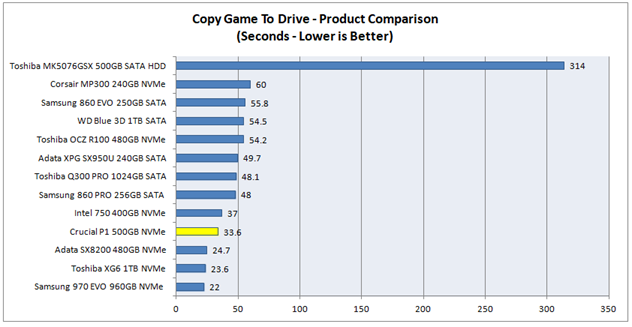
Excellent.
Copy a Game from the Crucial P1
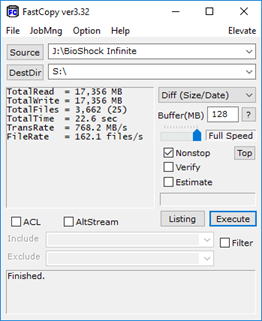
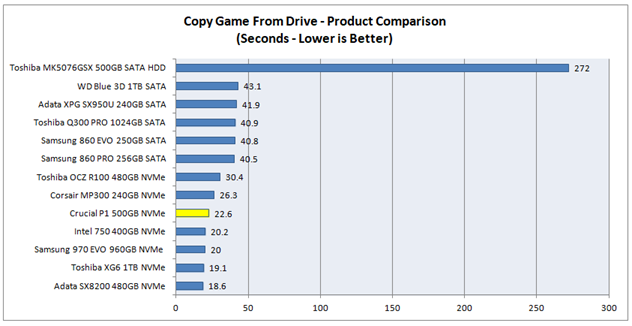
And again.
Copy a folder of JPEGs to the Crucial P1

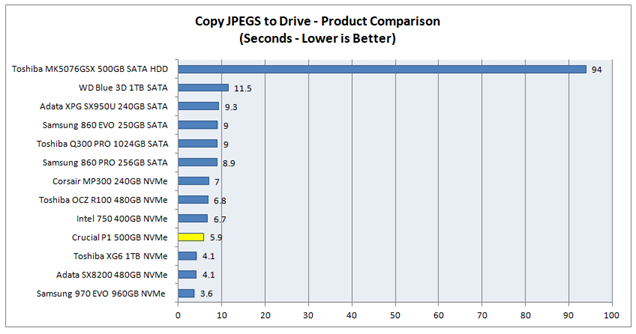
Excellent.
Copy a folder of JPEGs from the Crucial P1
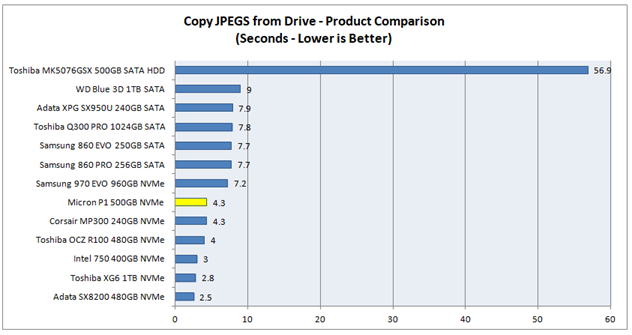
Excellent.
Now let's head to the next page, to look at the results
for the OakGate FOB Tests.....
OakGate Platform - ‘Fresh out of Box’ Benchmarks
These tests provide a highly consistent basis for comparing
solutions. The sequence of tests begins with a purge of the drive to ensure
that it starts in a FOB state.
The tests cover all of the essential IO performance
characteristics.
Sequential Writes
This test performs 20 seconds of Sequential Write IOs for
each combination of Queue Depths 1, 4, and 32, and IO Sizes of 4K, 128K, and
1024K. IO traffic is limited to an IO Range of 1GB (which is equivalent to a
test file size of 1GB).
Here are the results for the Crucial P1 –
[masterslider id="123"]
Here is a comparison of the 128K, Queue Depth 32, Sequential
Write performance with the other products I have tested to date –
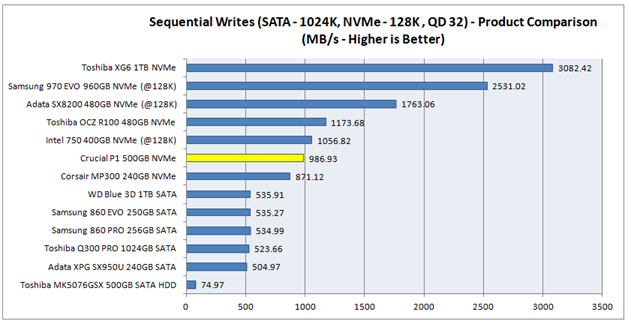
A good result but a long way behind the latest TLC
solutions.
Please note that NVMe drives are tested with an IO Size of
128K.
Let’s also have a look at how the Sequential Writes Power
Consumption compares, but to do this fairly we must divide the average MB/s by
the average Milliwatts to get a value for the effective work done. Here is the
result –
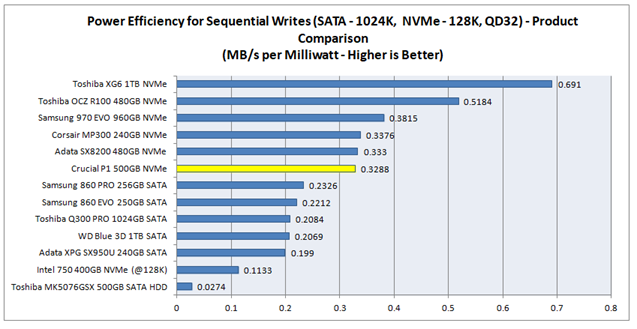
You can see that the Crucial P1 has a good level of power
efficiency.
Sequential Reads
The test performs 20 seconds of Sequential Read IOs for each
combination of Queue Depths 1, 4, and 32, and IO Sizes of 4K, 128K, and 1024K.
IO traffic is limited to an IO Range of 1GB.
Here are the results for the Crucial P1 –
[masterslider id="124"]
Here is a comparison of the Sequential Read performance with
the other products I have tested to date –
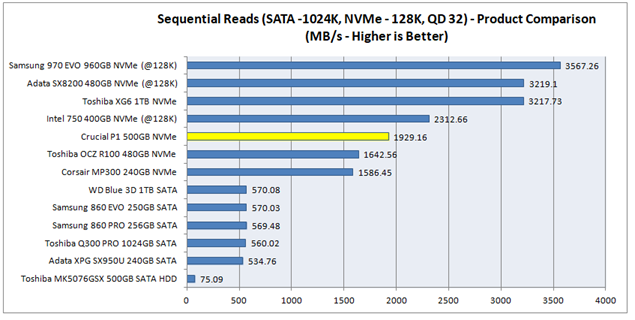
This is a good result, but it falls behind the latest TLC
solutions.
Random Writes
The test performs 20 seconds of Random Write IOs for each
combination of Queue Depths 1, 4, 32 and 128 and IO Sizes of 4K, 16K, and 32K.
IO traffic is limited to an IO Range of 1GB.
Here are the results for the Crucial P1 –
[masterslider id="125"]
Here is a comparison of the 4K, Queue Depth 1, Random Write
performance, with the other products I have tested to date –
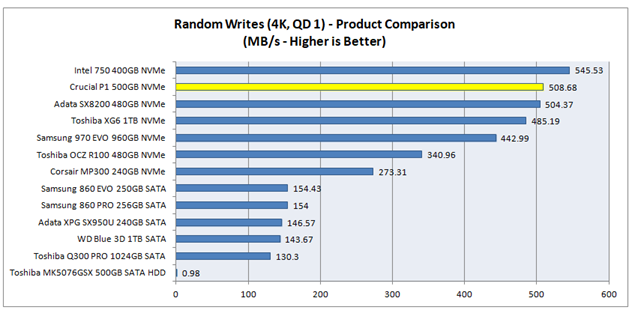
This is an excellent result.
Let’s have a look at the Latency Distribution for the 4K, QD
1 performance –
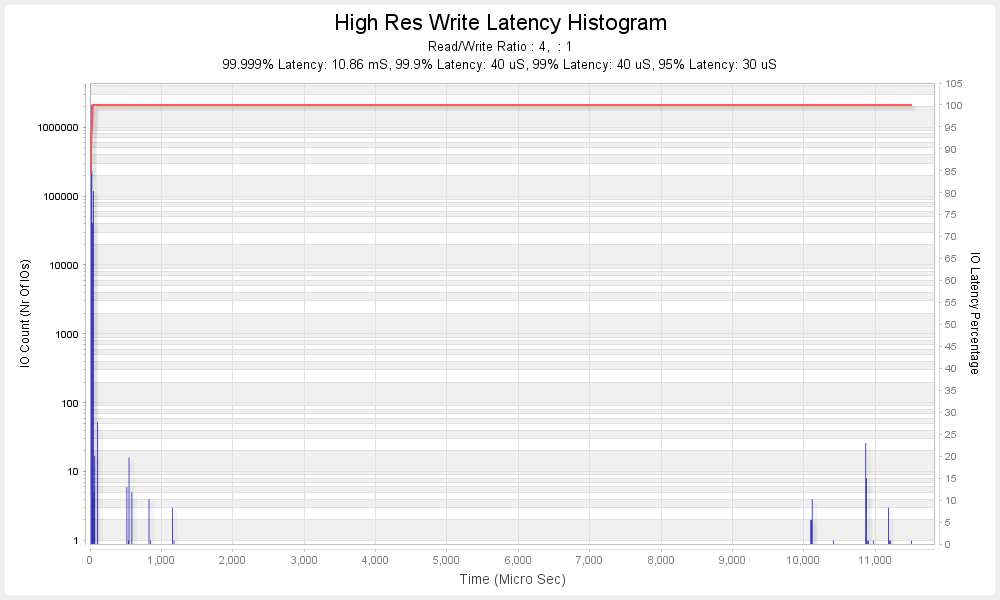
This graph shows the Latency for every IO that was performed
in the 20 seconds of traffic. It shows the Number of IOs (IO Count) that fell
within a particular period of Time (Microseconds). The red line plots the Time
against the Percentage of total IOs performed.
You can see that the Crucial P1 achieves an outstanding
level of consistency and 99.9% of all IOs have a Latency of 40 Microseconds or
less.
Random Reads
The test performs 20 seconds of Random Read IOs for each
combination of Queue Depths 1, 4, and 32, and IO Sizes of 4K, 16K, and 32K. IO
traffic is limited to an IO Range of 1GB.
Here are the results for the Crucial P1 –
[masterslider id="126"]
Here is a comparison of the 4K, Queue Depth 1, Random Read
performance with the other products I have tested to date –
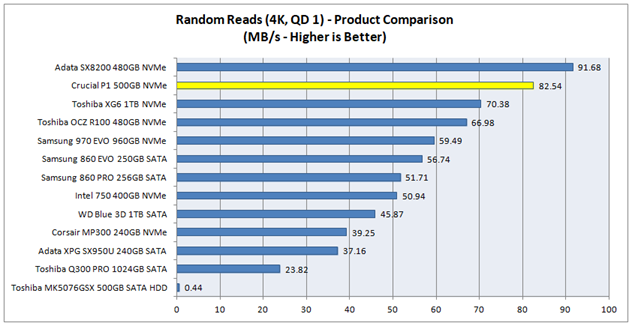
This is an excellent result.
4K Random Mixed Reads/Writes
The test performs 20 seconds of 4K Random Mixed Reads/Writes
for each combination of Queue Depths 1, 4, and 32, and Read/Write ratios of
0/100, 30/70, 50/50, 70/30, and 100/0. IO traffic is limited to an IO Range of
1GB.
Here are the results for the Crucial P1 –
[masterslider id="127"]
Here is a comparison of the 4K Mixed Random 50% Read/50%
Write, Queue Depth 1 performance, with the other products I have tested to date
–
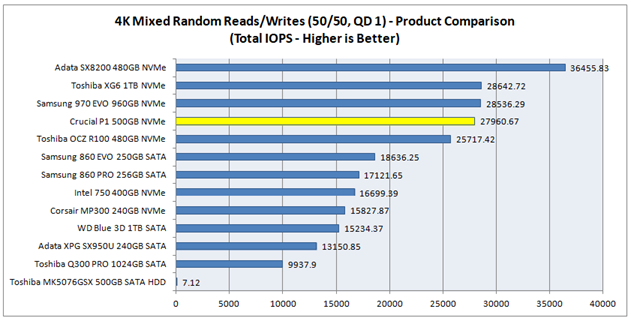
An excellent result.
Now let's head to the next page, to look at the results
for the Oakgate Sustained Write and Recovery Tests.....
OakGate Platform - Sustained Write and Recovery Tests
Sustained Sequential Writes
This test starts with a purge (Secure Erase), so that the
drive is in a FOB state, and then performs 128K Sequential Writes until twice the
drive’s User Capacity has been written to.
Here is a graph showing the resulting Write Bandwidth over
time –
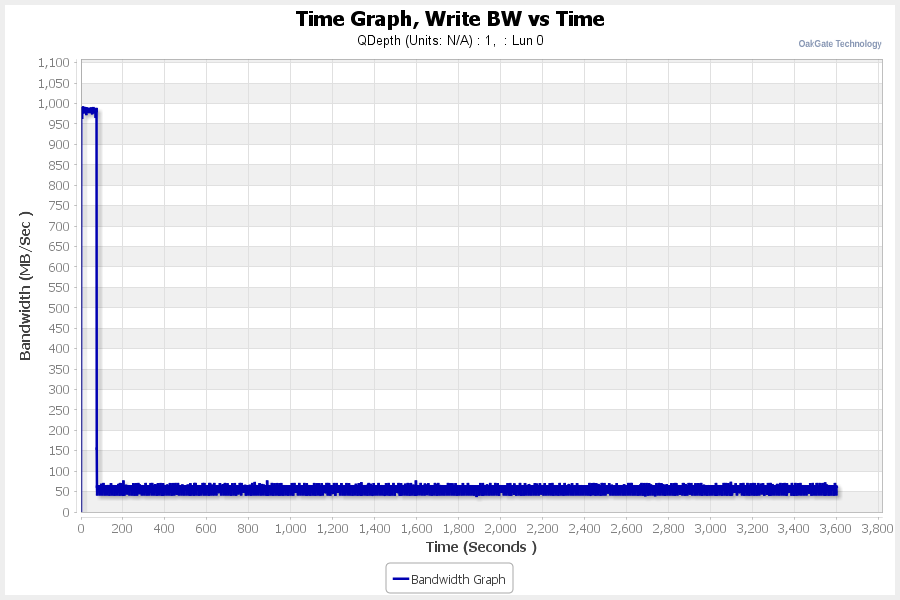
You can see that after approximately 75 seconds the write
speed falls dramatically from around 980 MB/s to around 60 MB/s.
Let’s have a closer look at the first 150 seconds -
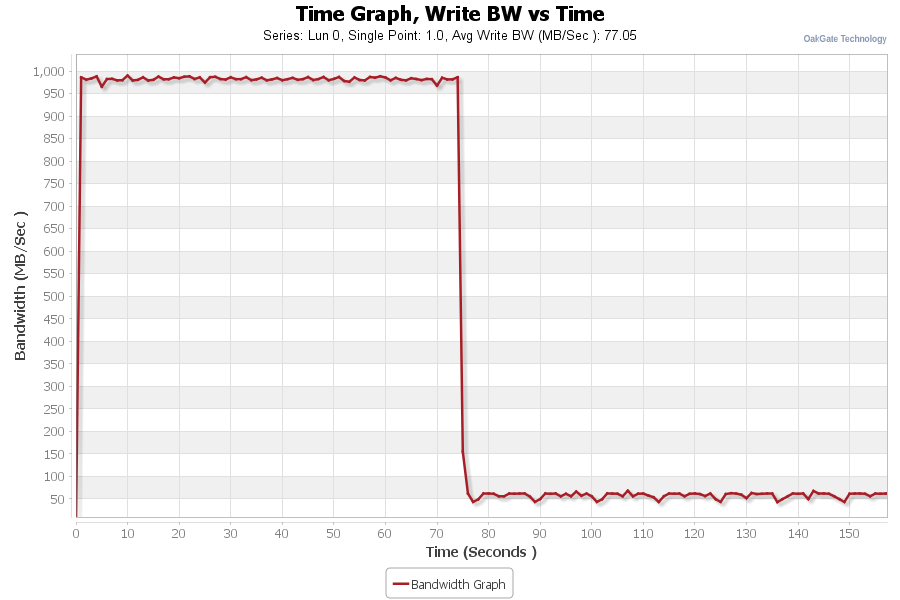
This is evidence of the P1’s SLC Write Cache Technology
being in play. As the drive is empty at the start of the test, it is able to
write to around 70 GB of data before its SLC Write Cache is exhausted and the
write speed falls. It is most unlikely that the average user will ever
experience such a drop in write speed and the Crucial P1 has an effective
implementation of SLC Write Technology. .
4K Random Writes, FOB to Degraded (Steady State) to Recovered
This test is designed to fully degrade the drive’s
performance and then see how it recovers following a Trim and a period of Rest.
In this test I start with a purge
of the drive to take it to a FOB state.
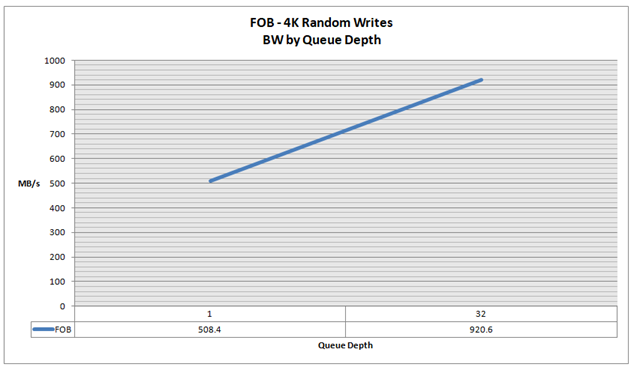
- FOB Performance – 4K Random
Writes Bandwidth
I then test the FOB 4K Random
Write Performance for 120 seconds at Queue Depths of 1 and 32, in an IO Range
of 16GB, the result was as follows –
- Sequential Writes to two times User Capacity
I then performed 128K Sequential Writes to the drive for
twice the drive’s user capacity (as in the previous Sustained Sequential
Writes).
- 4K Random Writes for 1 Hour
This was immediately followed by performing 4K Random Writes
to the drive for 1 hour. Here is a graph showing the resulting Bandwidth over
Time –
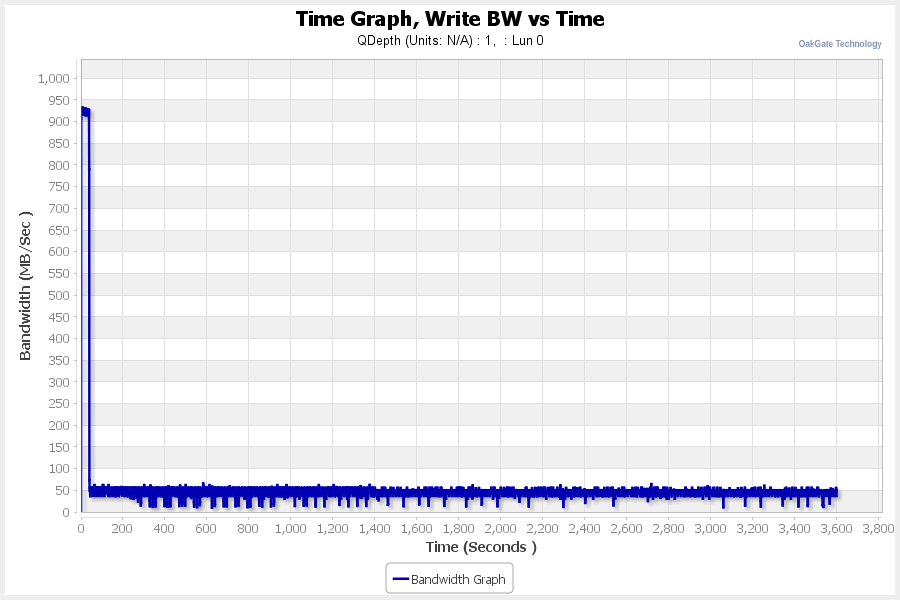
You can see that the Random 4K Write performance eventually
settles into a steady state of around an average of 50 MB/s.
- Fully Degraded, 4K Random Write ‘Steady State’
Performance
I then immediately test the 4K Random Write Performance (as
we did in the initial FOB test), and the result was as follows -
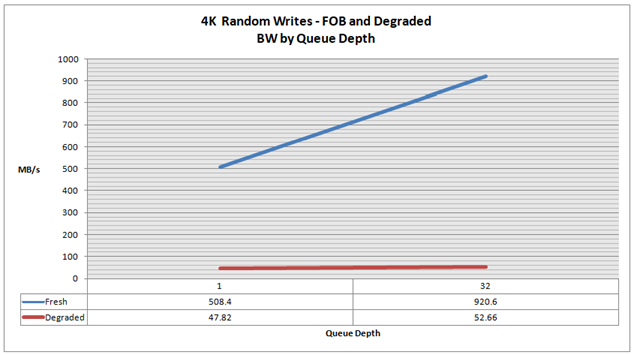
You can see that performance has dropped significantly
compared to the test performed in the FOB step. At this stage it is fair to
say that the drive’s performance is fully degraded and in a Steady State. It’s
as bad as it can get!
- Trim and Rest for 5m
I then liberally sent Sequential Trim commands to the drive
for a minute (to ensure that the drive’s entire range of logical blocks (= User
Capacity) was trimmed.
I then let the drive rest for 5 minutes before retesting 4K
Random Write performance again. The result was –
- ‘Recovered’ 4K Random Write Performance after Trim and
5 minutes rest
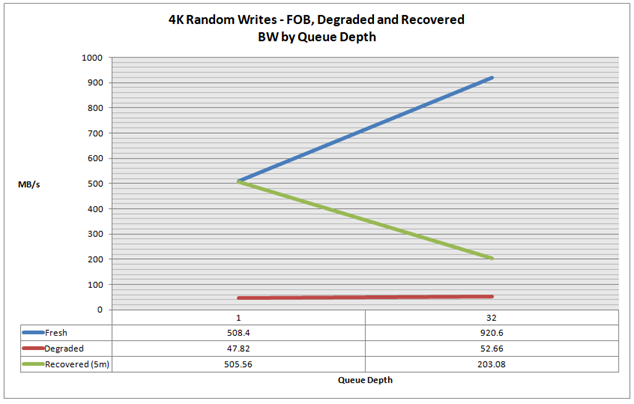
You can see that performance has fully recovered to support
the burst of writes at a Queue Depth of 1 but not for the second and more
demanding burst a Queue Depth of 32.
Let’s take a closer look at the BW versus Time result for
the second burst at Queue Depth 32 -
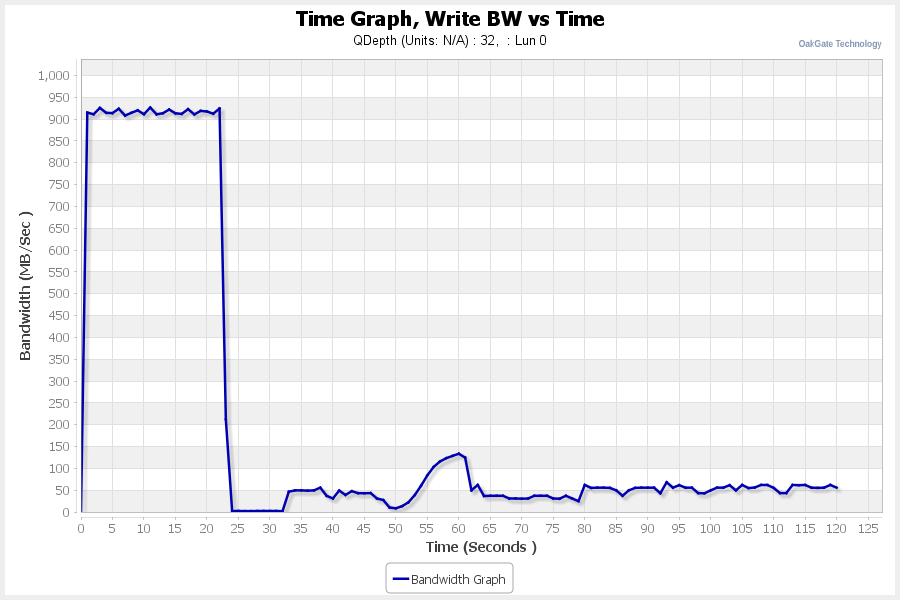
You can see that the random write performance crashes after
around 23 seconds.
Now let's head to the next page, to look at the
Conclusions from this review.....
Conclusions
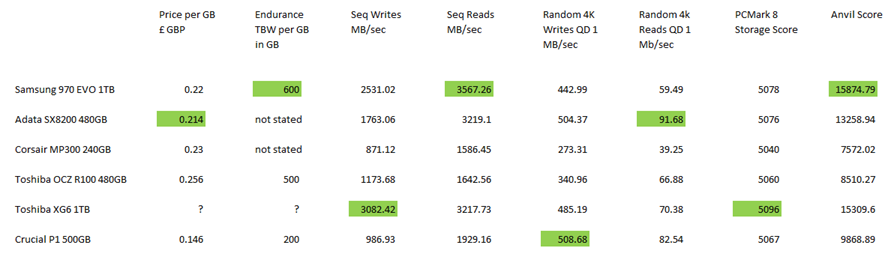
The summary includes the following factors:
- The best price for the nearest to 0.5 TB version of the
drive, as found on amazon.co.uk (LambdaTek for Toshiba OCZ R100) at the
time of publishing (Samsung 970 EVO 500GB - £109.95, Adata SX8200 480GB -
£101.92, Corsair MP300 480GB - £110.76, Toshiba OCZ R100 480Gb - £122.81,
Crucial P1 500GB - £72.99) converted to a price per GB. Please note that
we still do not find a price for the Toshiba XG6 listed in the UK. - Endurance – the amount of data that can be written to the
drive within a 5 year period and for the drive to remain in warranty,
stated as the number of GB that can be written per GB of the drive’s user
capacity. So, for example, the Samsung 970 EVO 1TB is warranted for 600TB
of writes and the GBs that can be written per GB of user capacity is
600,000 / 1,000 = 600GB. - The Sequential Writes and Reads and Random 4K Writes and
Reads results from our OakGate FOB Tests - The PCmark8 ‘Real World’ Storage Benchmark score
- The Anvil Synthetic Benchmark score
The best result for each factor is highlighted in green.
Other drives will be added to the NVMe Comparison Summary as we move forward.
Some observations on the Comparison Summary to date –
The Corsair MP300 and the Toshiba OCZ RC100 are 2 lane
drives (2 x PCIe 3) whereas the others are 4 lane, so they are expected to have
lower performance.
Top scores in performance benchmarks are now being shared by
the Samsung 970 EVO, the Adata SX8200, the Toshiba XG6, and the Crucial P1.
It’s interesting to note that the difference in the PCMark8
Storage benchmark results is relatively marginal and this suggests to me that
the user experience to be gained from each drive would be very similar – or to
put it another way I very much doubt that a user could tell the difference.
So where does the Crucial P1 stand? My feeling is that it
has reasonable performance but clearly the endurance level could be seen as a
negative. The Crucial P1 has a significant price advantage but is it enough
given the endurance level? For me the Crucial would be great value for a drive
that is to be used very largely for reading data. For example, I have several TBs
of movies and a few TBs of games that are essentially static data and I would
be happy to use P1’s for holding this type of information, but I would be
reluctant to use it as a boot drive.
All in all though, I am happy to award the Crucial P1 our
rating of 'Excellent'.


")


