|
|
Review: Corsair Reviewed by: Antonis Provided by: Corsair Model: Corsair Neutron XTi 480GB SSD Firmware version: SAFC02.3
|
|
|
|

Technology wise SSDs have changed a lot
over the last couple of years, they went from a luxury item for the very few
enthusiasts to a component that is almost essential by today’s standards. For SSDs
to achieve that it helped that prices became more affordable to everyone, also
the capacity of the drives is now much higher. But for all this to have
happened sacrifices had to be made, a large number of new drives comes with TLC
NAND that sacrifice a big part of the write speed, but give larger capacities at
lower prices.
Now the question is, where do you look when
you want the best performing drive that you can get for your money?
Thankfully Corsair is here and has
introduced the new Neutron XTi SSD series, SSDs that are the best that Corsair
has to offer, without making any compromises. Today I will be taking a closer
look at the Neutron XTi 480GB SSD and thanks to Corsair for providing the drive
for this review.
You can check the Corsair website to find
you more about Corsair, and their high quality products, to do so just click here.
So let's start this review by taking a look
at the packaging and its contents, before moving on to some testing.
The Corsair Neutron XTi 480GB SSD
As always I will start by taking a look at
the package and the contents that are included with the Corsair Neutron XTi SSD.
We'll start with the package.
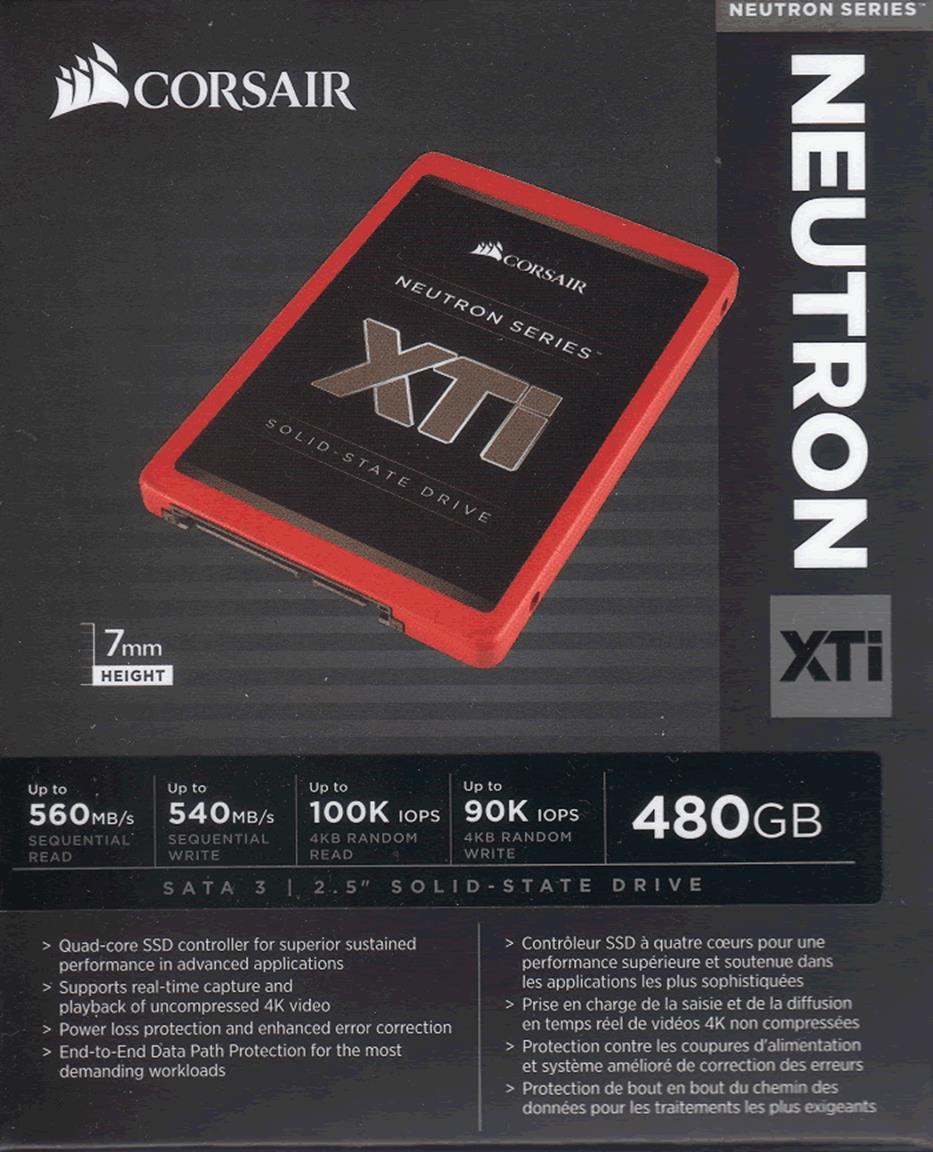
The front of the box.

Here is the back of the box.
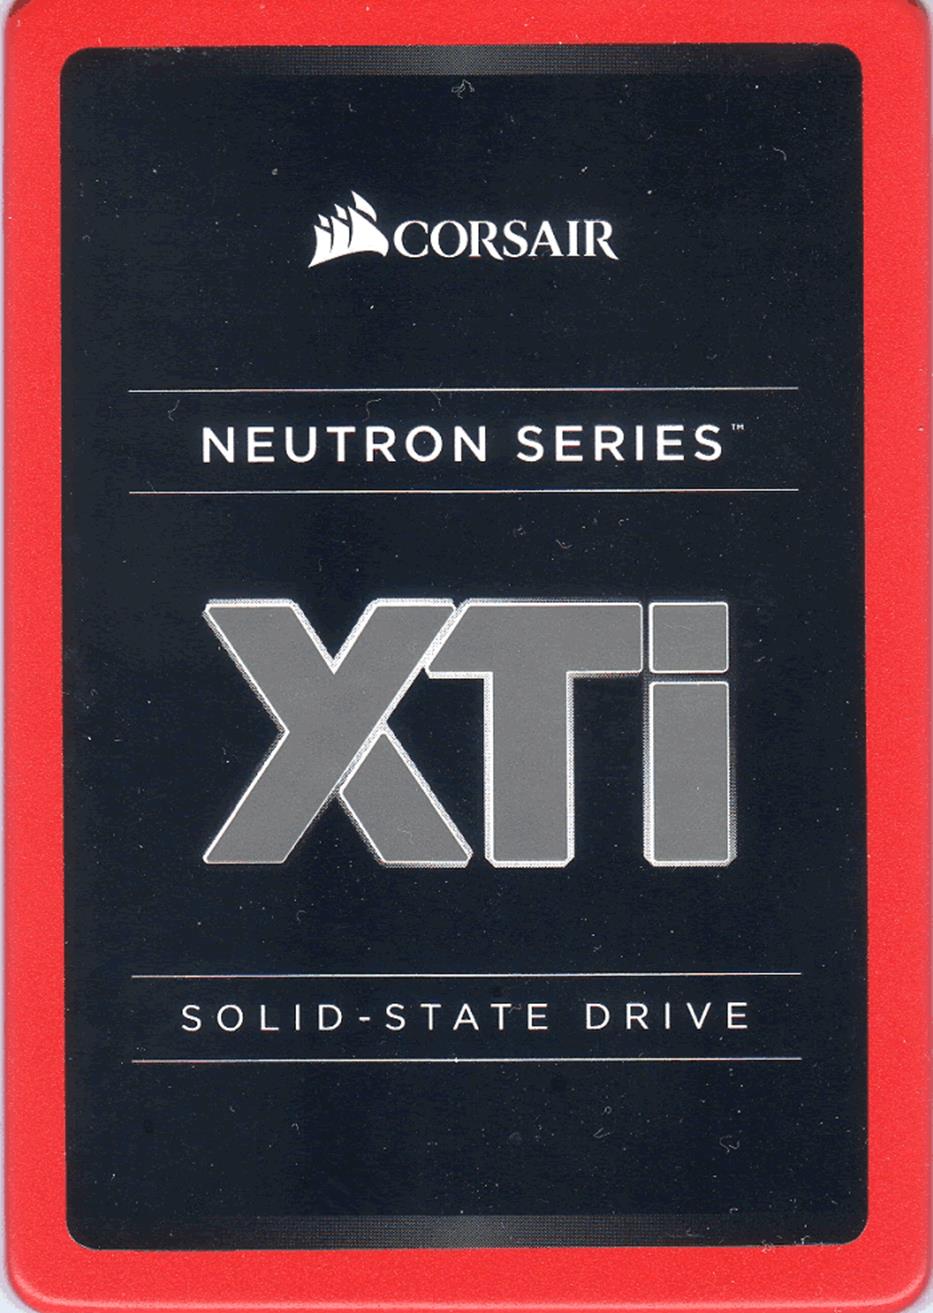
The top side of the SSD is mainly covered
by a big sticker that covers the majority of the red painted chassis. Inside
the box there is also a 2.5mm adapter.
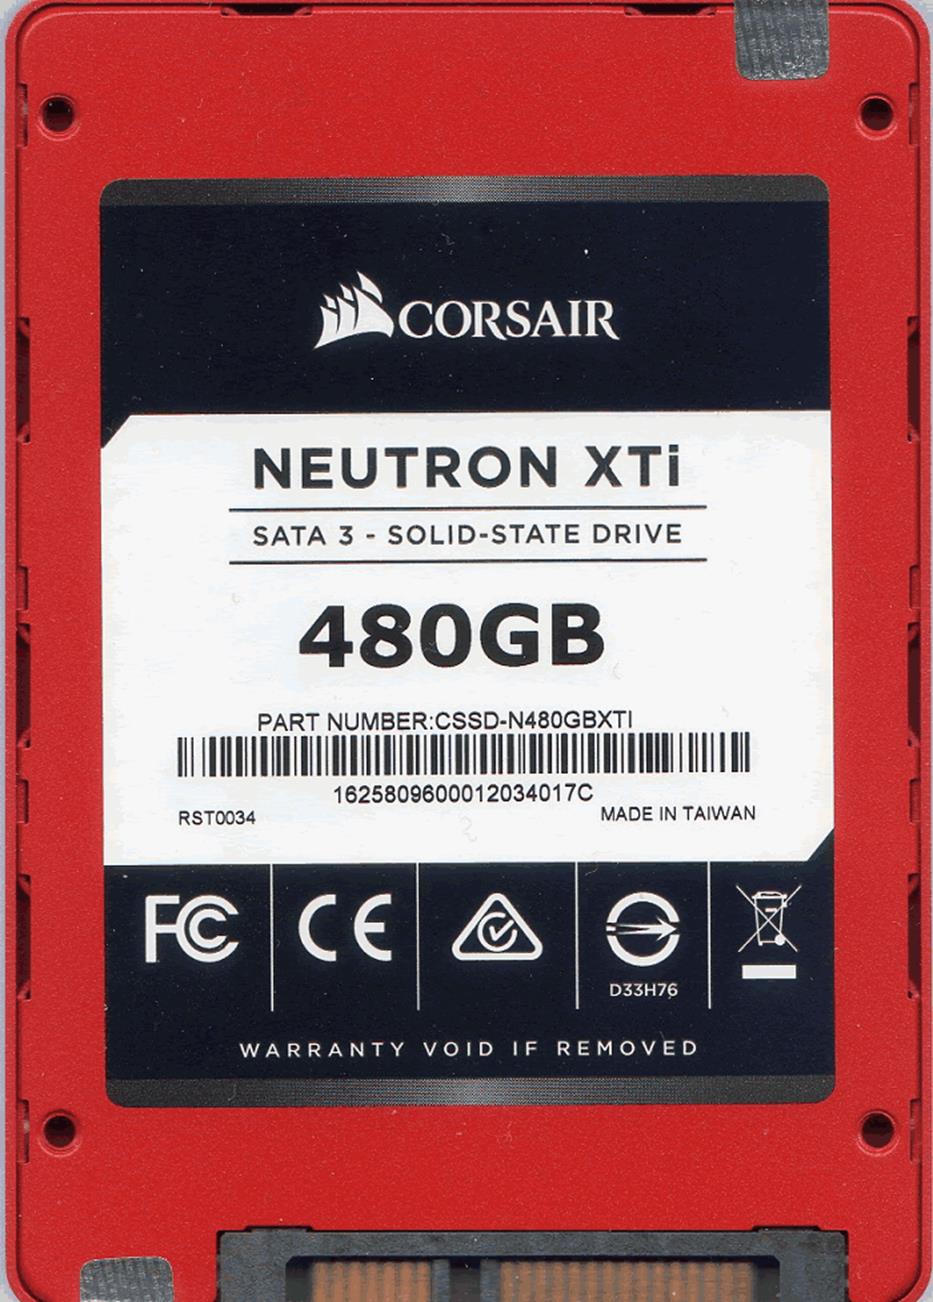
The rear
of the Corsair Neutron XTi SSD.
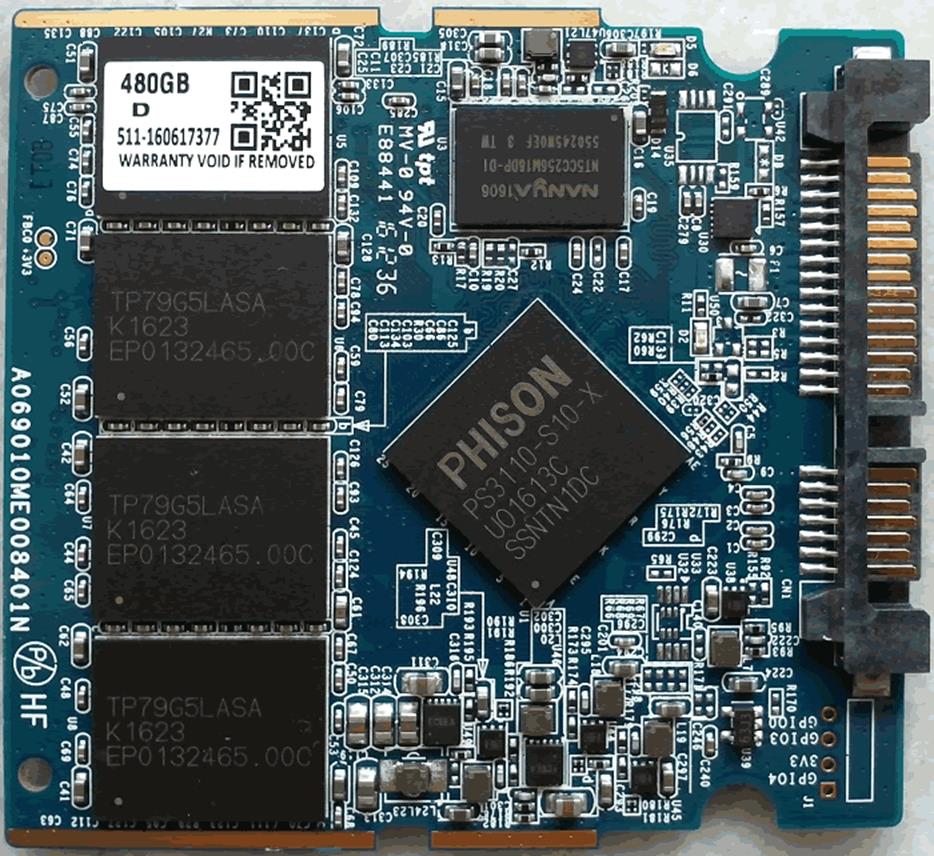
Four Toshiba 15NM MLC NAND on this side of
the PCB, the Phison S10 controller, and NANYA DDR3L 256MB RAM.
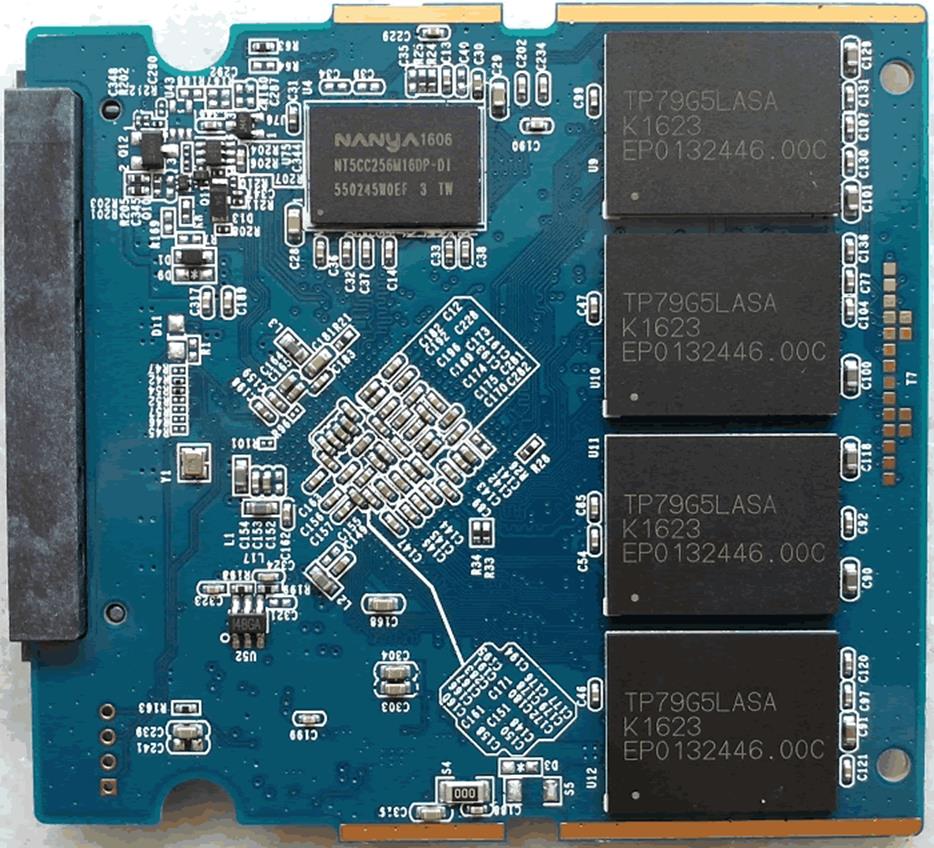
On the other side of the PCB we find
another set of four Toshiba 15nm NAND, and another NANYA 256MB DDR3L, making a
total of 512MB of RAM, and a lot of capacitors.

The Phison PS3110-S10-X controller.
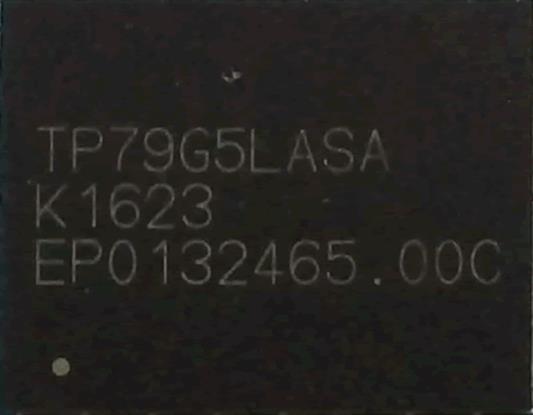
The Toshiba NAND.
Specifications of the Corsair Neutron XTi 480GB SSD
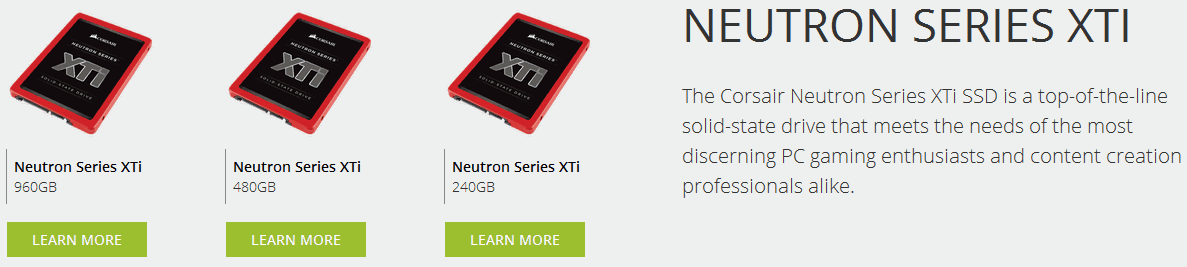
We can see that the Neutron XTi is
available in three capacities, 240GB, 480GB, and 960GB. Corsair was kind enough
to send me the 480GB drive, so this is the drive that I will be testing.
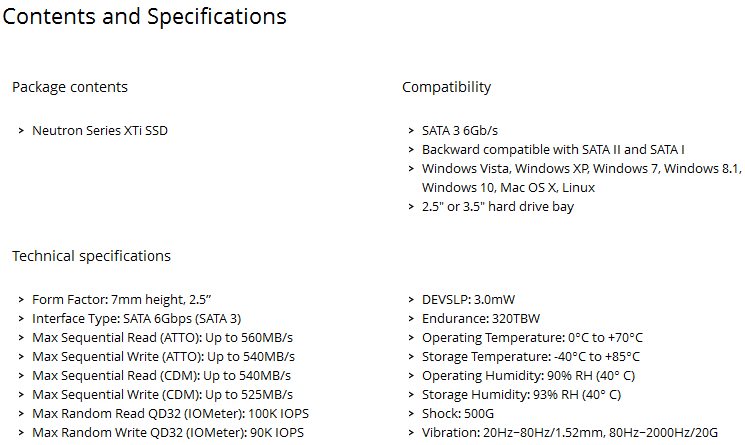
A more detailed specification for the
Corsair Neutron XTi 480GB SSD.
CrystalDiskInfo
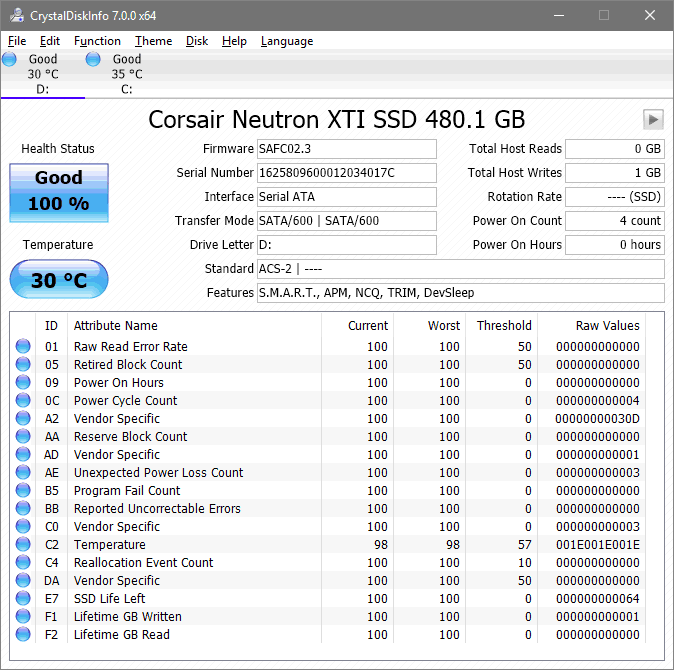
In
the above screenshot we can see all the available info for the Corsair Neutron
XTi 480GB SSD.
Let’s head to the next page where we
take a look at our testing methods and the review PC.
Test machine
For this review I will be using a computer
with the following configuration:
Hardware:
- Motherboard: ASUS X99-A (Intel X99 chipset)
- Processor: Intel Core i7 5280K @ 4.4GHz
- RAM: RAM: Crucial Ballistix Sport 4x4GB 2400
- GFX: MSI GTX 960 2GB
- Sound: Onboard Realtek HD audio
controller - OS SSD: HyperX Fury 240GB
- PSU: Seasonic 750W
- Display: Futsiju Siemens 22”
- Operating System: Windows 10
The Corsair Neutron XTi 480GB SSD was
connected to first SATA port on the ASUS X99-A motherboard. All power saving
features were disabled during all of my synthetic benchmarks.
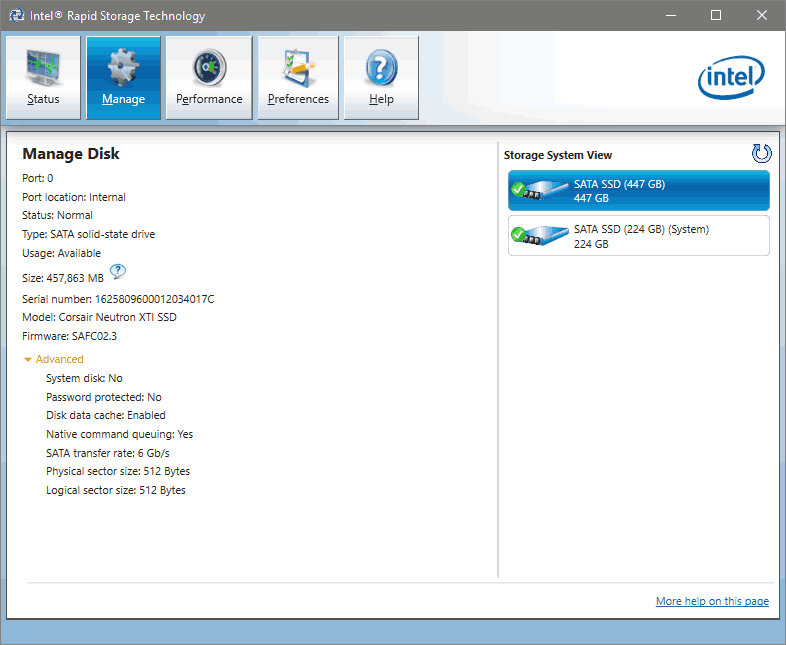
The
SATA 6Gbps drivers used on our review PC were Intel Rapid Storage Technology
(RST) Version 14.5.0.1081.
Test applications
To test the performance of the Corsaur
Neutron XTi 480GB SSD, I will be using the following test applications in this
review.
- HD Tune
Pro - ATTO
- Iometer
- AS SSD
Benchmark - CrystalDiskMark
- Anvil’s
Storage Utilities - PCMark
Test procedures
I will start off our testing procedures
explanation by stating that I did not run many synthetic benchmarks on the Corsair
Neutron XTi 480GB SSD. You may ask why I have run so few synthetic benchmarks.
SSD technology has moved so fast in the
last couple of years, that basic synthetic benchmarks alone are now of very
limited use, as they don't really tell us much about performance and how the
drive will behave in the real world. I have therefore decided to show some
basic benchmarks for the Corsair Neutron XTi 480GB SSD, and will complement
this with advanced benchmarks using IOMeter and AS SSD benchmark. I will also show
how the Corsair Nutron XTi 480GB SSD performs in the real world.
The reality of SSD performance
While I can easily show you which SSD is
technically the faster, when you use one of these modern SSDs as an operating
system drive it becomes very difficult to tell them apart as far as performance
is concerned.
A typical use of a small capacity SSD at
the moment is to have your operating system and applications installed onto the
SSD. The performance difference compared to a traditional HDD is enormous,
however when you start to compare SSD to SSD the difference becomes almost
impossible to detect.
Let’s look at why this is the case.
Drive A can boot to the desktop in 8.11
seconds, and drive B can boot to the desktop in 8.12 seconds, the difference in
time is milliseconds, and can one really tell the difference?
The fact is, all modern SSDs are only
ticking over when they are only running the OS and launching applications, it’s
only when you get to some of the larger capacity SSDs, with enough free space
to be able to hold the actual data that you’re going to be working with, be
that video, audio or pictures, for example, that you actually get a tangible
difference in performance. This is where the SSDs with the better sequential
performance start to pull well ahead of the SSDs which have lower sequential
read/write performance.
Small file random IOPS vs sequential performance
IOPS
This is a fairly complex subject, but I
will do my best to explain things in a manner that is easy to understand.
The term IOPS is the amount of input or
output transactions that can take place in a one second interval, so for
example, if an SSD is quoted as being able to cope with 20,000 4K random write
IOPS, then the SSD should be able to cope with 20,000 input transactions in a
period of one second. If the same SSD is said to be able to produce 20,000 4K
random read IOPS, then the same SSD should be able to produce 20,000 4K random
read output transactions in a one second interval.
Ok, now we have some figures to work with,
the next question is how many IOPS are actually required?
This will depend on your usage pattern. If
you are a typical desktop user who browses the internet, does some word
processing or perhaps some audio or video editing, and perhaps plays a few
games, then in actual fact, you don’t need to have massive 4K random read/write
performance. The actual amount of 4K random performance that is required for a
fast and smooth running system for a desktop user with a usage pattern similar
to the above will be well under 1,000 4K IOPS.
On the other hand, if the SSD is being used
for running a large and complex database server, then 4K random performance is
the absolute measurement of how fast that server will run, as this type of
application does most of its input and output transactions in the 4K domain.
So why would I need an SSD with 80,000 4K
IOPS for a desktop?
In fact you don’t need this type of
performance for a desktop, but an SSD which is capable of coping with 80,000 4K
IOPS will be faster than an SSD which can only cope with 20,000 4K IOPS.
OK, I just said if under 1,000 4K IOPS are
actually required for typical desktop usage, why is an SSD with 80,000 4K IOPS
faster than an SSD with only 20,000 4K IOPS, confused?
You may ask, if I only require 1,000 4K
IOPS surely the rest is wasted?
While you may never need 80,000 4K IOPS,
IOPS is all about latency. The reason that an SSD can cope with as much as 80,000
4K IOPS is because latency in this domain is very low. With 4K files, even if
you require to process 500 of them at the same time, you are not talking about
a huge amount of data, it has far more to do with how long it takes the SSD to
process a single file, and the amount of time required to process a single 4K
is all about how long it takes for the SSD to access or store that data before
it can move on to the next transaction.
In other words an SSD with 80,000 4K IOPS
performance will handle those 500 files faster than the SSD with 20,000 IOPS.
So how will a desktop user even notice this
faster speed if so little 4K random IOPS and data are actually used?
Multitasking is a good example. The more
tasks you run at the same time, you more you will notice the speed difference.
Sequential performance
I have always maintained that sequential
performance was every bit as important as small random file performance for a
desktop SSD. Some highly regarded people on other sites found this statement
quite funny a couple of years ago when I made it, but my, how times have
changed in the world of SSD reviewing.
To me this was always so obvious for a desktop
user. For example, let’s say you want to launch an application or game. Both
have some fairly large files to load, and also a great many small files, but
the point is, even the smaller files are sequential in nature. Now let’s say
you’re into audio or video editing. Video files tend to be huge, and the files
are written or read sequentially. Isn’t this how many users are using their PCs
these days?
Summary
So how does this shape up in the real
world? Which is better, massive 4K IOPS or massive sequential performance?
In an ideal world you want both, as an SSD
with massive random 4K IOPS and sequential performance will always be faster
than an SSD that has high sequential performance and moderate 4K random IOPS
performance, and the same applies to an SSD that has massive 4K random
performance and moderate sequential performance. The SSD which has high
performance in both patterns will always be the faster SSD.
However, you can still have an SSD that is
very fast for desktop use that has moderate random 4K performance and massive
sequential performance, the same can be said about a drive having massive
random 4K performance and moderate sequential performance, as it is about
getting the balance right if you have to compromise on one or the other.
Drive preparation for running the tests
All the SSDs used in this article were in a
clean and fresh state when the testing period started. From then on, each drive
had to rely on its own NAND cleaning effectiveness for the remainder of the
tests.
- Both our spinning HDD drives were
defragged before the start of each test.
- All SSD and HDD used in this article had
their partitions aligned to the Windows 7 x64 defaults.
Where I use graphs in this article to
display results, I will use the following colours to make it easier, for our
readers to see which drive we are reviewing.
![]() Corsair
Corsair
Neutron XTi 480GB SSD
![]() Comparison SDD
Comparison SDD
Let's take a look at the Corsair SSD
Toolbox software
Corsair SSD Toolbox
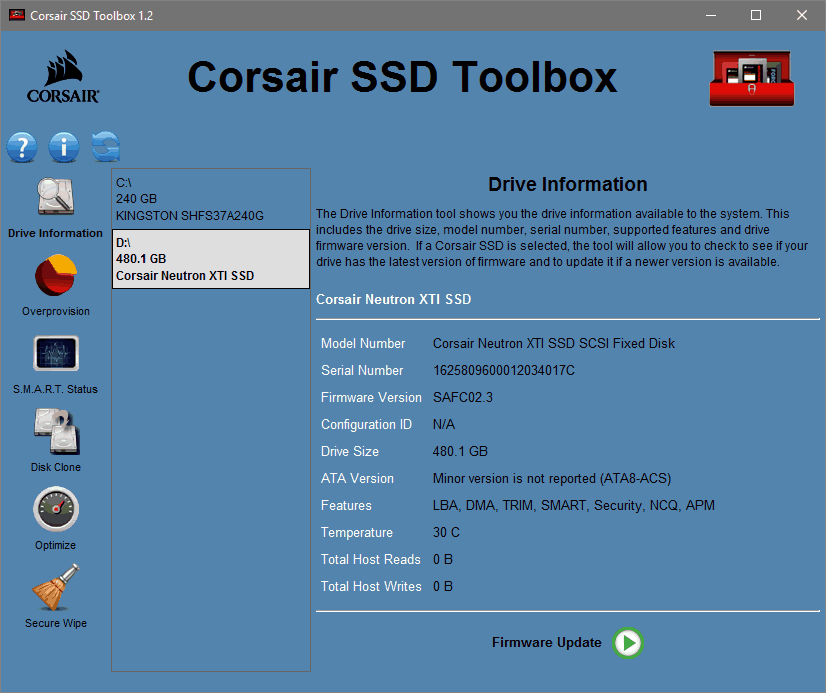
The first screen of the Corsair SSD Toolbox
displays all the information about the drive that you need. It also allows you
to manually check for a firmware update, and this option should make the update
to the new firmware much easier.
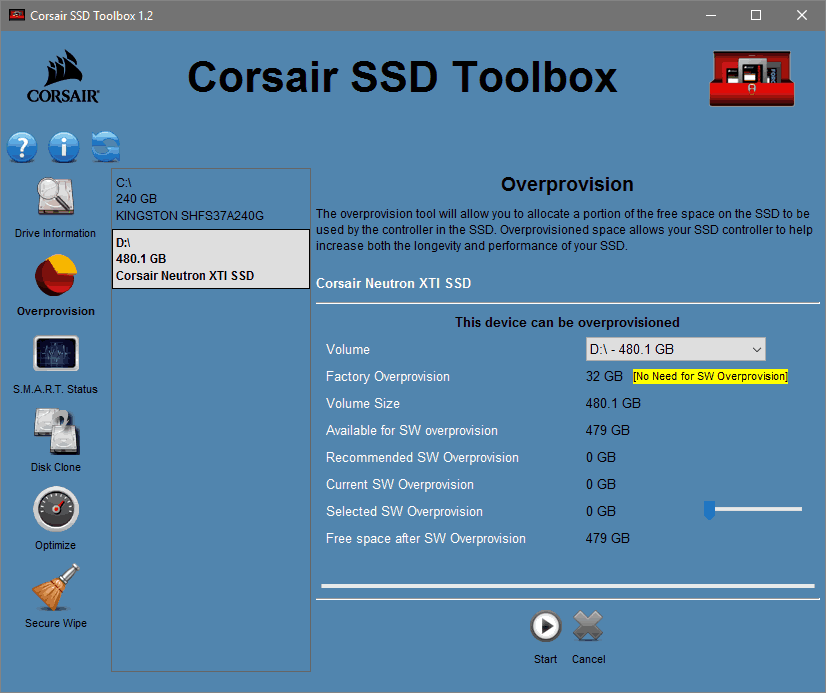
On the second tab there is the overprovisioning
option, something that will make OP much easier and very use full for older drives.
In the case of the Neutron XTi we see that the drive already has 32GB of
Overprovisioning, but if you want you can increase it.
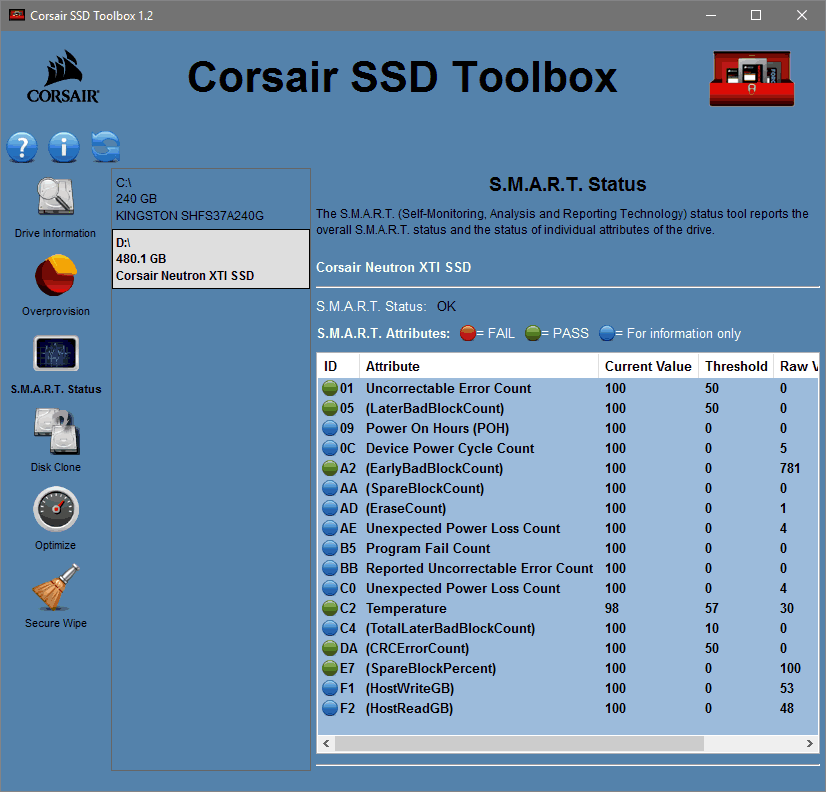
The S.M.A.R.T. status does exactly what it
says.
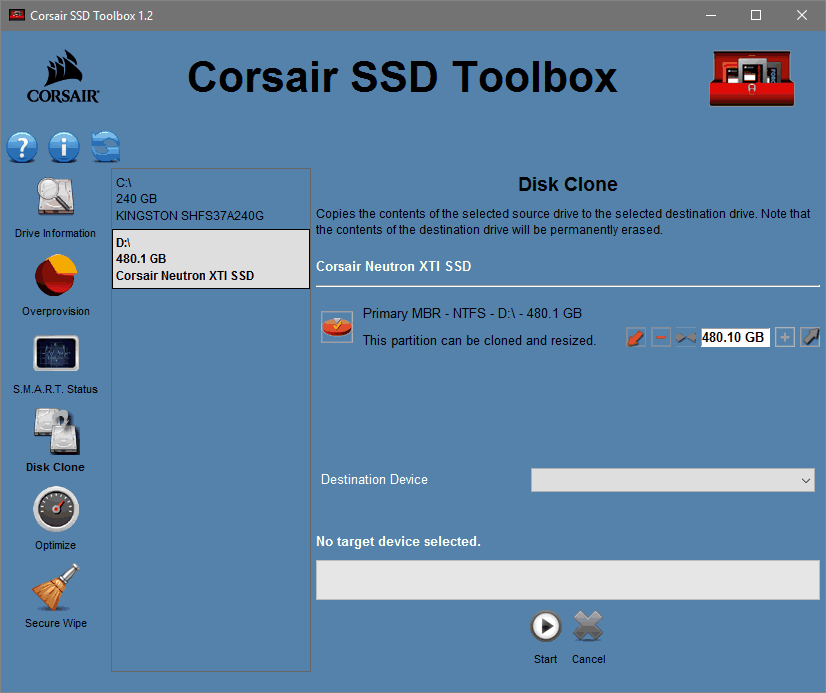
The Corsair SSD Toolbox also gives you the
option to clone you drives, something that would be useful to those who want an
easy way to clone their old drive to the new SSD, without having to pay for additional
software.
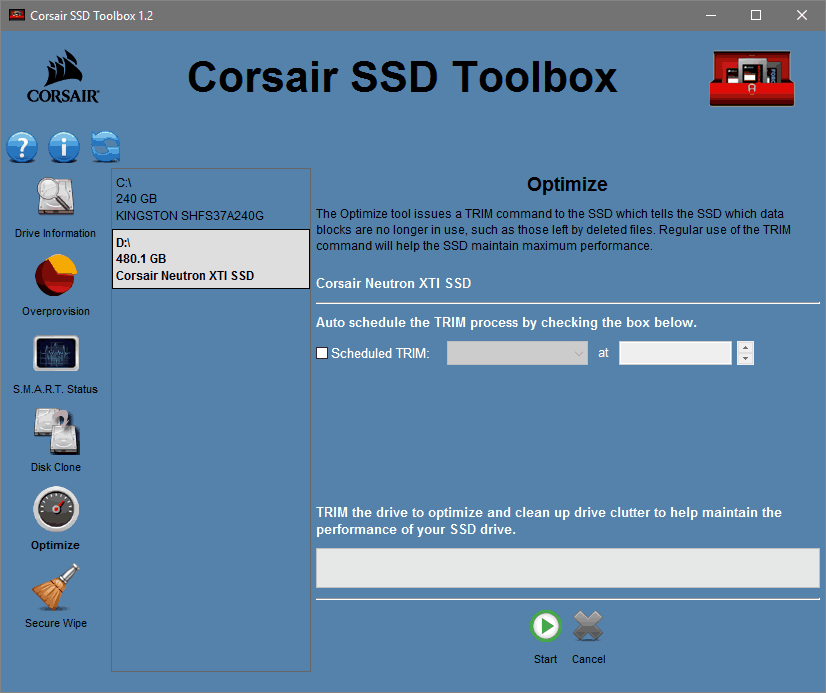
The option to manually TRIM your SSD, or to
schedule it, is welcome and useful to those that have an OS which doesn’t
support TRIM, however most modern SSDs will do a clean once they are idle for a
few minutes.
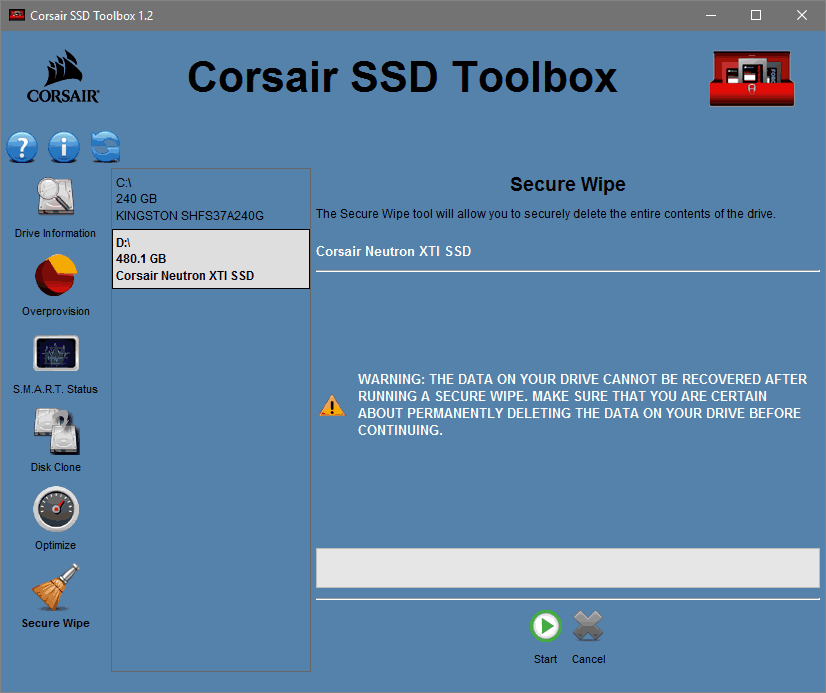
The last option will securely wipe the data
from your SSD, a welcome feature if you are planning on selling the drive.
Overall the Corsair SSD Toolbox is a nice program that adds extra to the overall
package of the Neutron XTi, and also to the rest of the Corsair SSDs.
Now let's head to the next page, where I
look at some basic benchmarks...
Reading Benchmarks
HD Tune
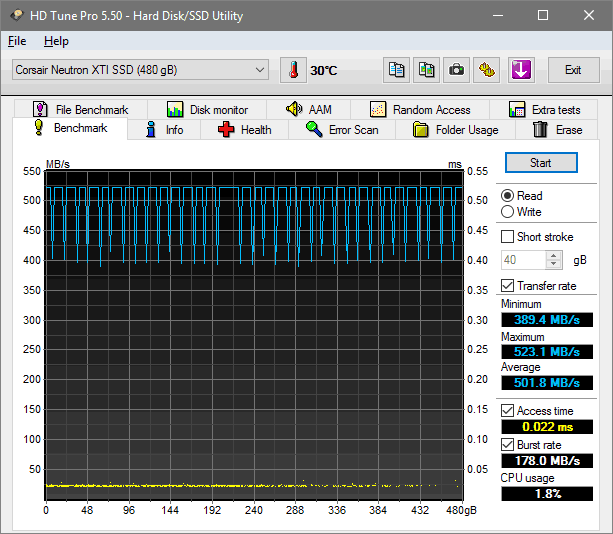
HD
Tune Test – Sequential reading test
The Corsair Neutron XTi SSD isn't the best
performing drive in this test, but the result is still very good.
ATTO disk benchmark
ATTO has become a standard tool for
measuring the data throughput of HDDs and SSDs. It measures the reading and
writing performance, using different file sizes and block sizes.
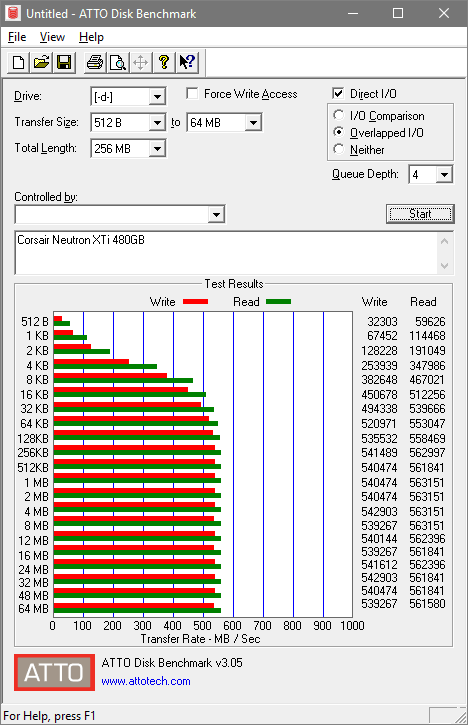
With the ATTO test the Corsair Neutron XTi
SSD was able to verify the numbers that Corsair displays on the box, 540MB/Sec
write and 560MB/Sec read, which is an excellent result.
CrystalDiskMark 3.0
CrystalDiskMark is quite a handy
benchmarking application, as it focuses on the file sizes that can cause problems
for a system drive.
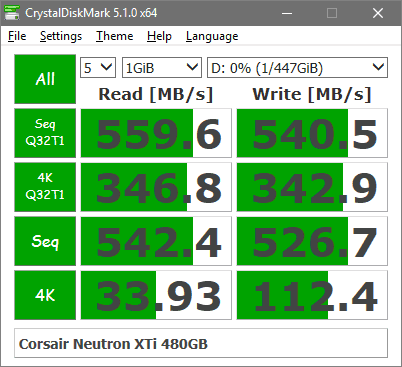
In this test the Corsair Neutron XTi SSD gives
an excellent result for both read and write speed.
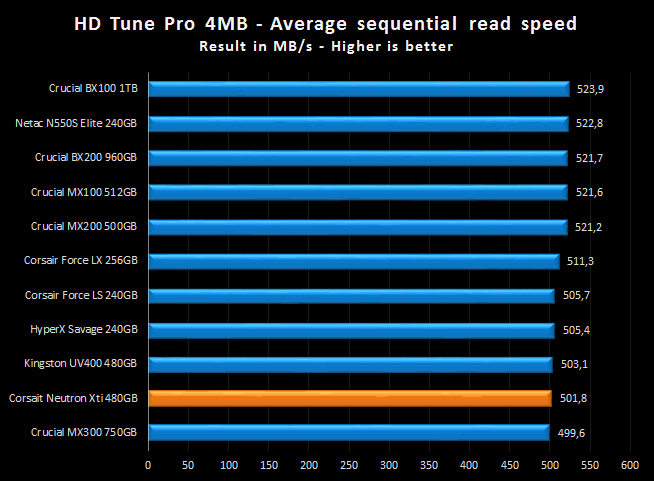
The two graphs below will give a more
detailed view of how the Corsair Neutron XTi SSD compares with other SSDs that
I have tested.
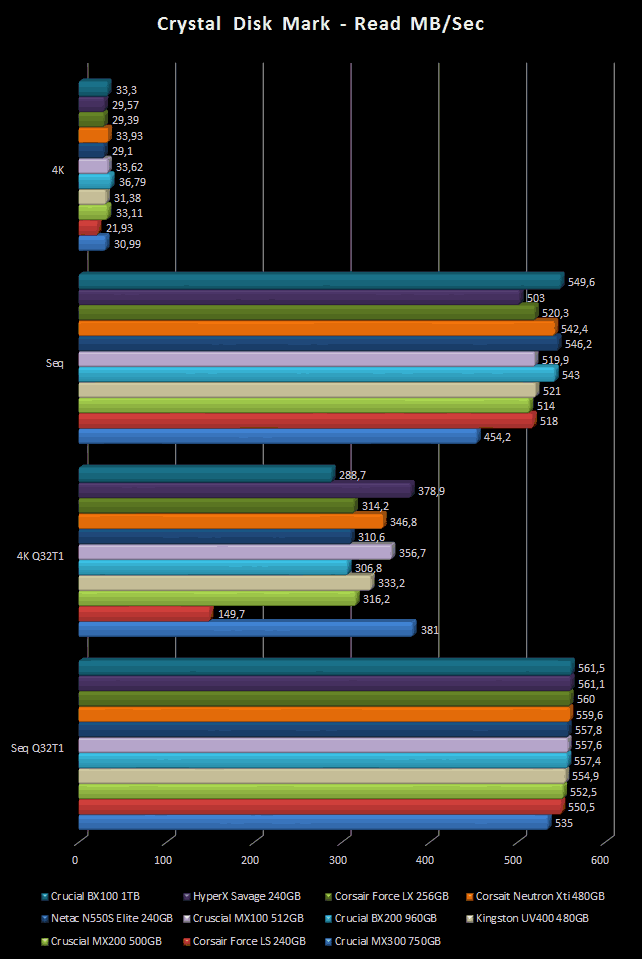
Here I present the graph for the read speed
tests. You can compare the Corsair Neutron XTi performance with other drives I
have tested.
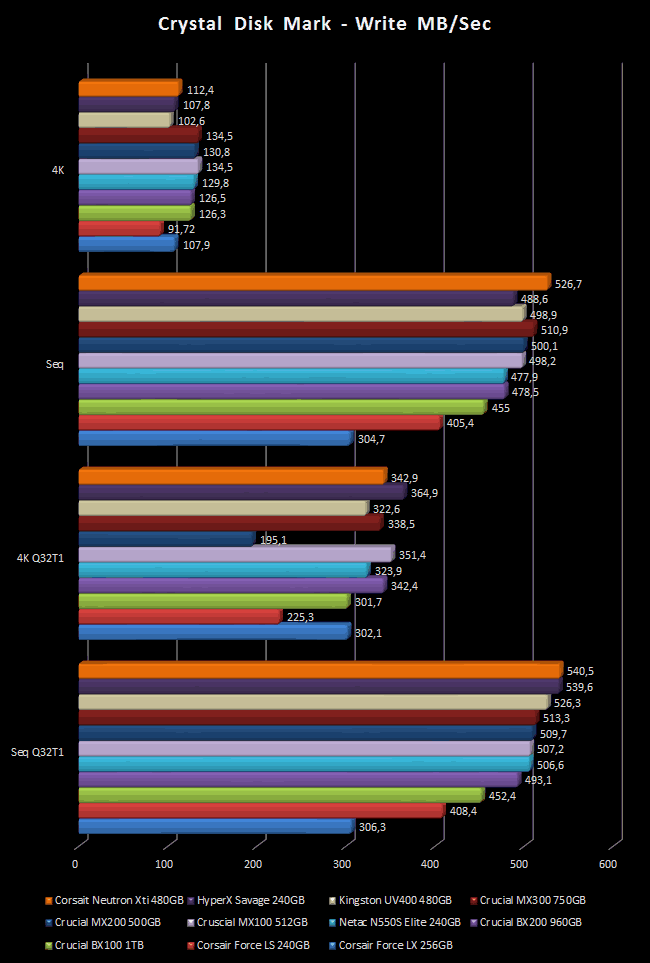
Finally the results for the Corsair Neutron
XTi SSD for write speed, and again you can compare it with other drives.
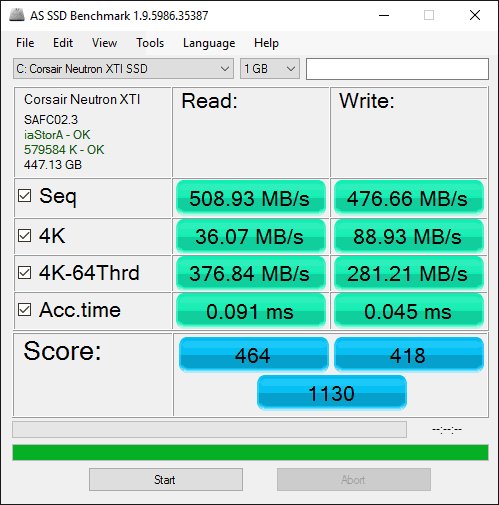
AS SSD Benchmark
AS SSD benchmark is a benchmarking tool
specifically designed to test SSDs. The application tests sequential reading
and writing performance, 4K random reading and writing performance.
AS SSD benchmark also tests 4K threaded
performance. This is very exciting, as this test is the first available test
that I am aware of, that simulates how a PC operating system actually works. A
modern PC and OS, such as Windows Vista/7 does not just run a single thread at
a time, it runs many threads. The AS SSD benchmark "4K 64Thrd" tests
run 64 threads simultaneously throughout the test. If this result is good, then
you can be pretty sure the drive will perform extremely well as a system drive.
After the tests complete, AS SSD benchmark
derives a total score for the drive being tested. This is based on all aspects
of the test results, and gives an indication of how the drive is performing
overall.
Now let’s look at the results for the Corsair
Neutron XTi 480GB SSD in the form of a screenshot. All our other comparison
drives’ results are presented in the form of a graph.
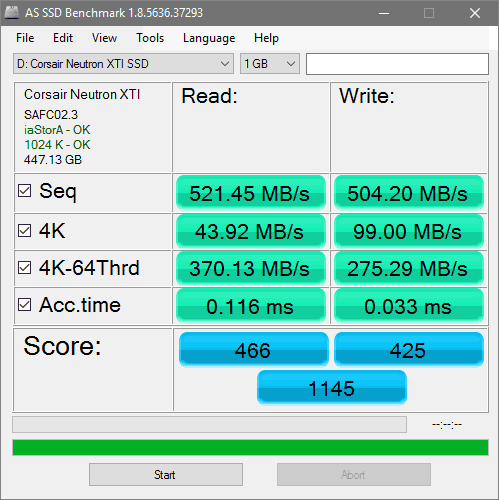
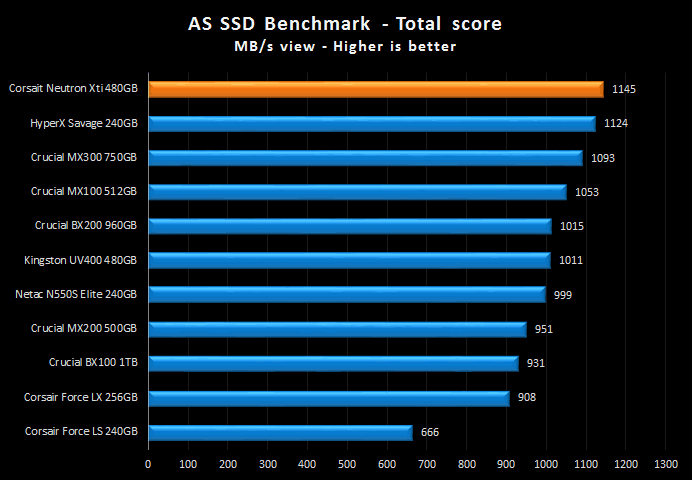
This is another excellent result for the
Corsair Neutron XTi SSD.
Let's head to the next page and run some
tests using PCMark 8.....
PC Mark 8 - HDD Suite
We have built quite a close relationship
with FutureMark software, the authors of the PCMark PC benchmarking software
that we use in our tests. I decided I would use PCMark Vantage as stopgap
measure until the more up-to-date PCMark 8 benchmarking suite became available.
I'm pleased to say that PCMark 8 is now available, and it gives me great pleasure
to introduce you all to the results obtained by this new 'real world'
benchmarking suite.
I will describe the basic way that each
test is carried out, above the graph for each test.
PC Mark 8 HDD suite results
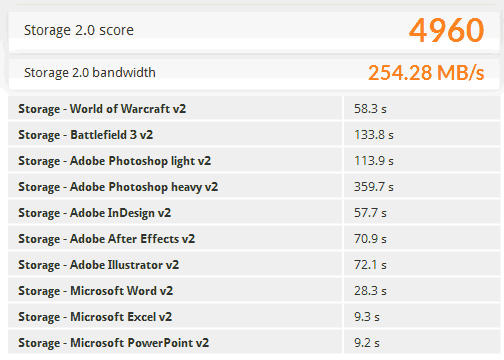
Here
is a screenshot displaying the results for the Corsair Neutron XTi 480GB SSD.
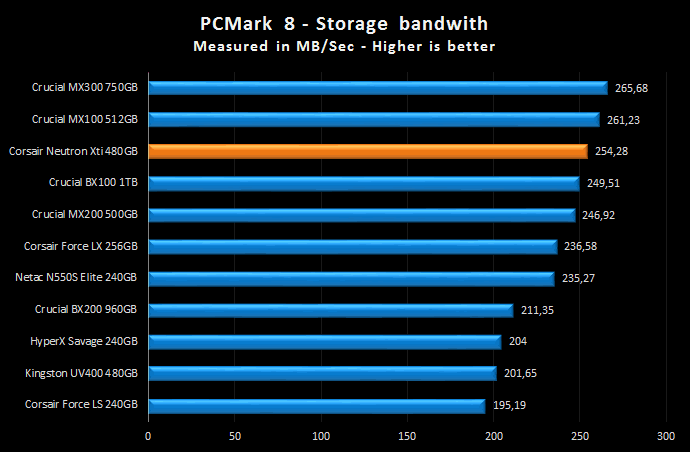
As we can see in the above graph the
Corsair Neutron SSD continues to give excellent performance.
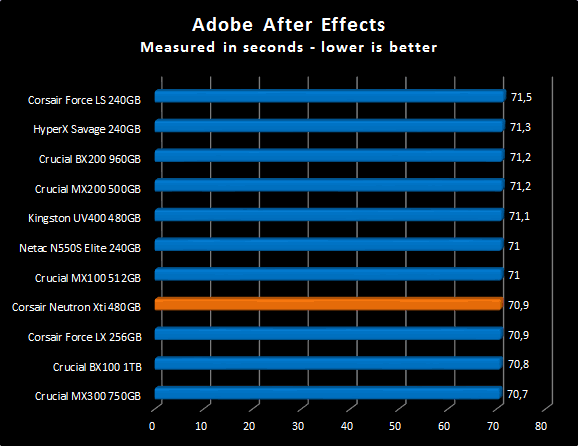
The
result for the After Effects test.
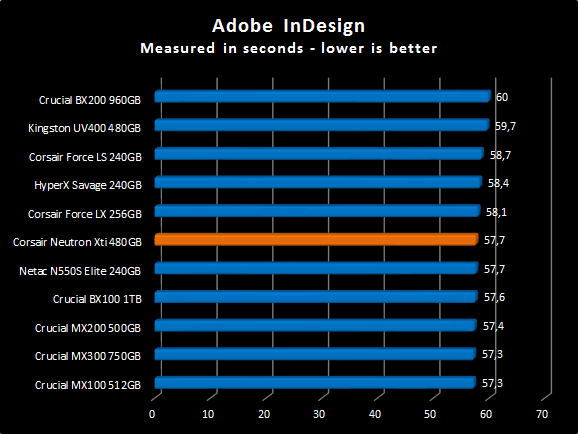
The
result for the InDesign test.
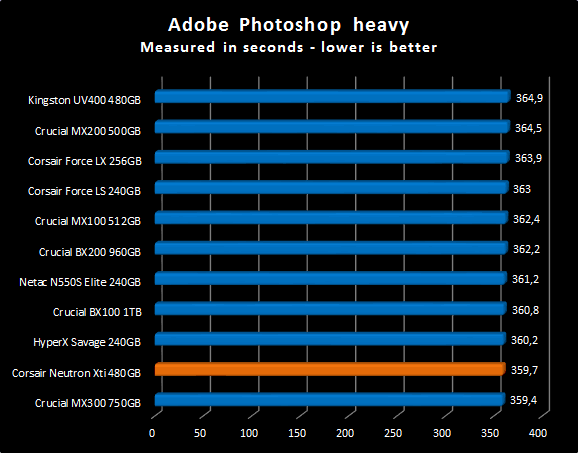
The
result for Photoshop heavy test.
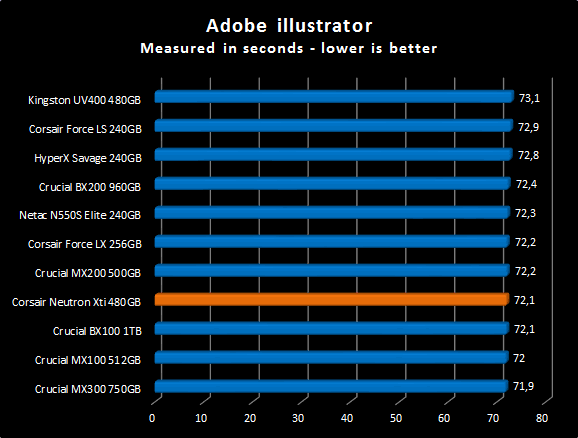
The
result for the Illustrator test.
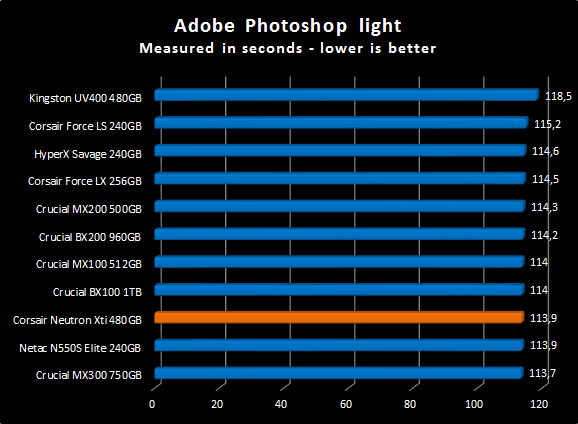
The
result for the Photoshop light test.
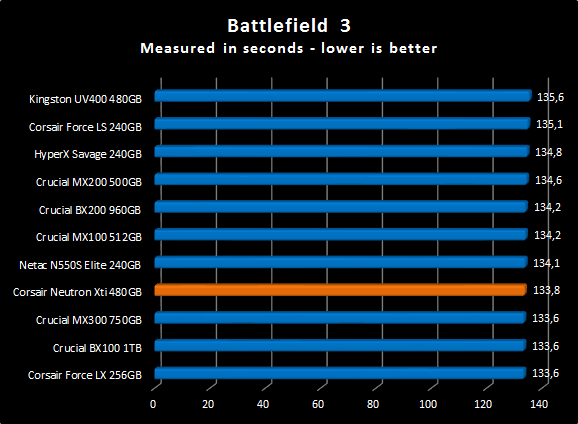
The
result for Battlefield 3.
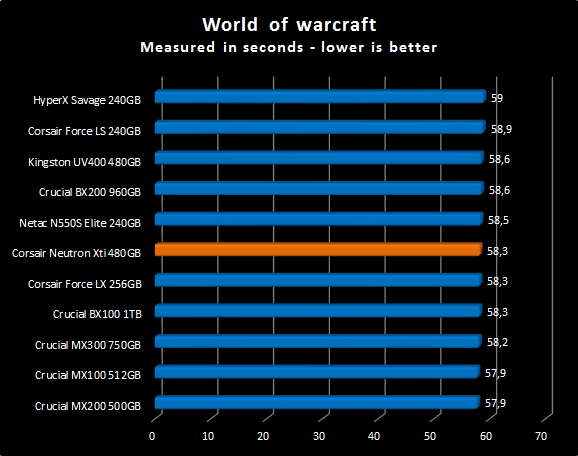
The
result for World of Warcraft.
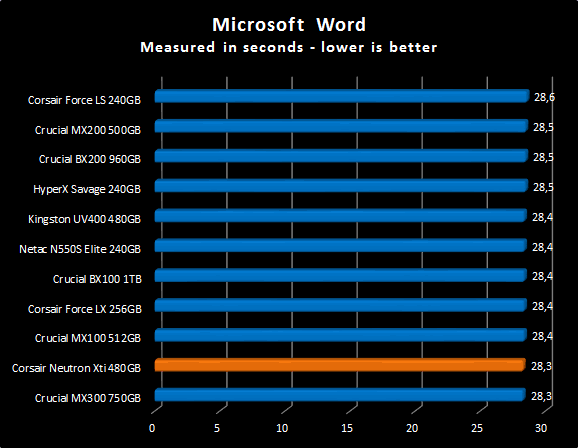
The
result for the Word test.
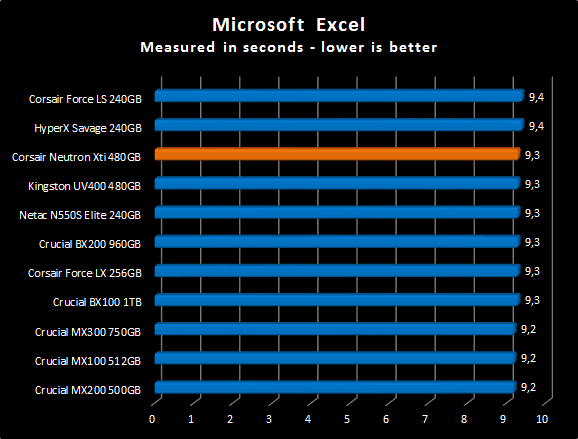
The
result for the Excel test.
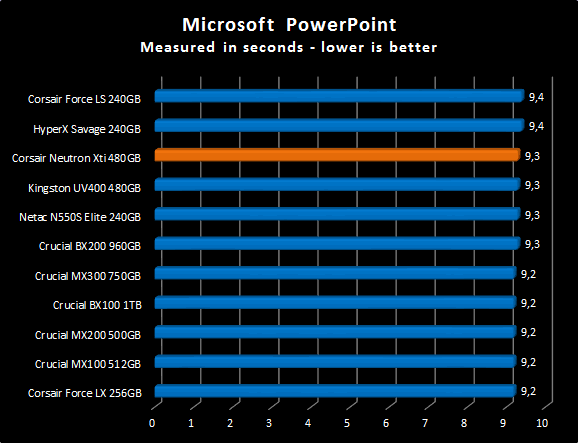
The
result for the PowerPoint test.
Summary:
In every single test that PC Mark 8 uses
the Corsair Neutron XTi SSD was able to stay very close to the top performing
drives, so overall the performance of this SSD is excellent.
Let's head to the next page for our
IOMeter test results.....
I/O Performance
There is little point of having an SSD
drive that has blazing sustained reading and writing speeds, if the drive can't
handle reading and writing of small random files. If you intend to use your new
SSD drive to store and run your operating system, then the drive must be able
to cope with the many small random files that Windows will write to the drive
continually. So I feel it is very important to test how many of these random
files that a drive can handle in one second. I believe that anything over 1,000
I/O’s per second would be enough for most users running a consumer grade
mainstream PC, and should provide a smooth running system. But obviously, the
more I/O's that a drive can handle, the faster the drive will feel and leave
more headroom for those huge multitasking sessions that users sometimes engage
in.
The things that I will look at are the
total I/O per second and total MB/s.
Partition alignment and sector boundaries
Windows 7 and Vista will automatically
align a partition to 4k boundaries during partition creation, Windows XP won’t.
It is imperative that an SSDs partition is aligned. Windows XP is also
restricted to sector boundaries, while Windows 7 will use 4k boundaries if it
can. The Corsair Neutron XTi 480GB SSD is 4k boundary aware, and will use these
boundaries if possible. Of course it will also remap LBAs for compatibility
with the sector boundaries so that the drive can be used with Windows XP.
IOMeter allows us to set the sector
boundaries for conducting the tests, and I have therefore set the sector
boundaries at 4K, which means the IOMeter tests are valid for Windows 7 and
Windows Vista users. XP users will not be able to obtain such results.
I will provide a screenshot of the tests on
the review drive for those of you who like to see the actual test result. All
the comparison drive results are represented in the form of graphs.
If any of you would like to see a
screenshot from any IOMeter test on a particular drive, please feel free to request
one, and I’ll post the screenshot in the forum thread.
All the IOMeter tests create a 10GB data
set on the target drive, and each test is run for a duration of 3 minutes.
IOMeter 4K random write test with repeating data.
The first test involves creating continual
4KB random files on the target drive with IOMeter. I use a 4KB file size, as it
is believed that Windows will create and modify many of this size of file
constantly in the background during a typical Windows session. It is said that
most 4K random writes take place at a queue depth of only one.
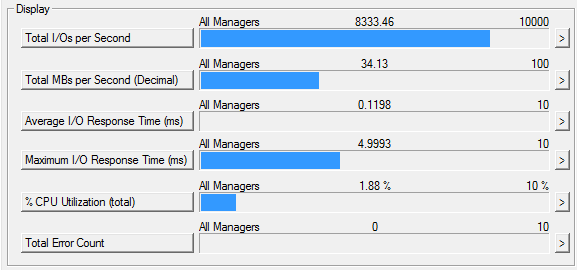
Queue depth 1
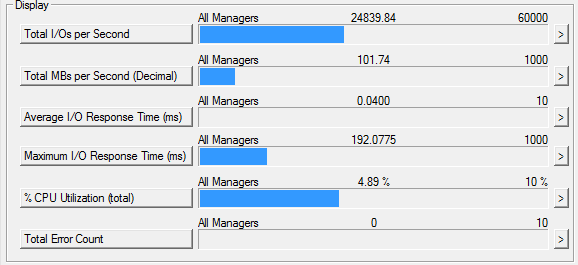
Corsair Neutron XTi 480GB SSD (Queue depth 1)
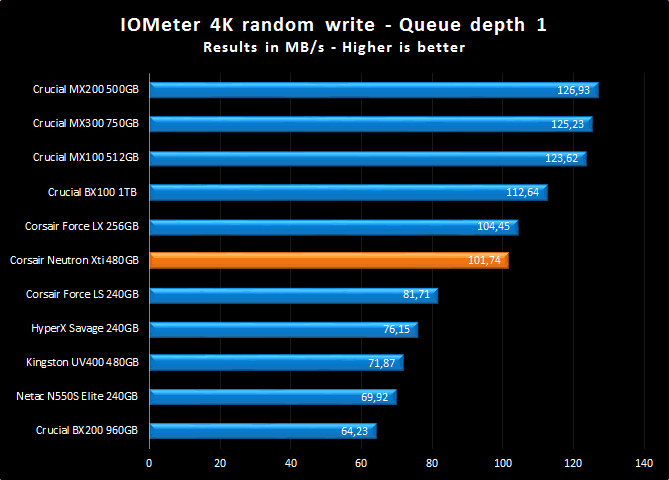
The result is very good.
Queue depth 4
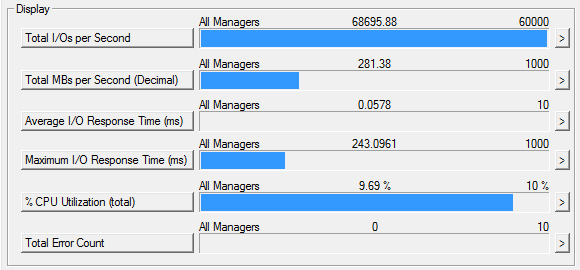
Corsair Neutron XTi 480GB SSD (Queue depth 4)
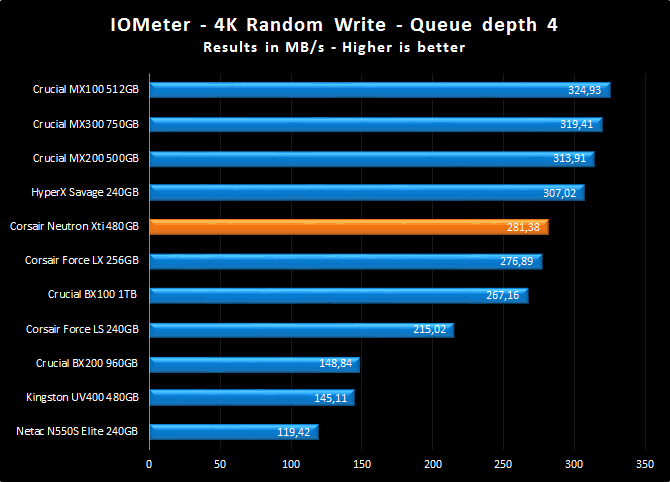
Again the result is very good.
Queue depth 32
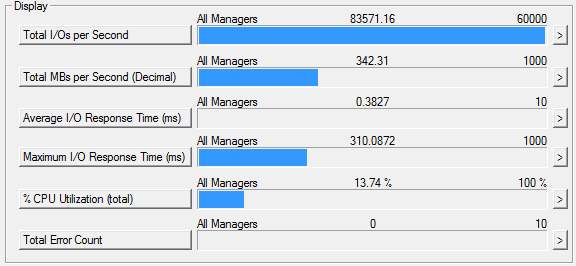
Corsair Neutron XTi 480GB SSD (Queue depth 32)
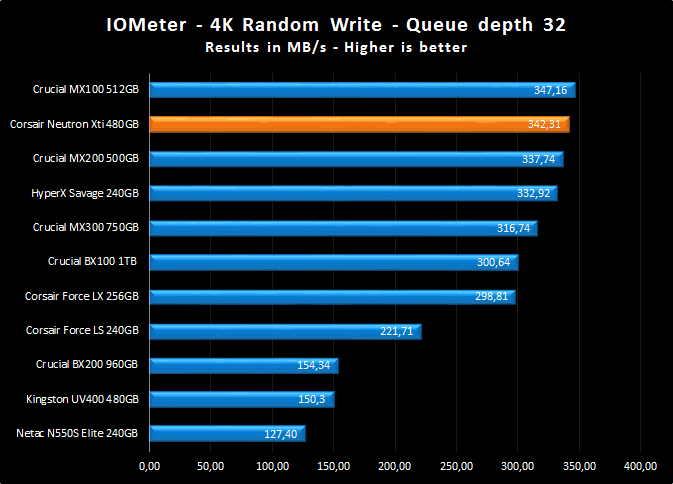
This time the Corsair Neutron XTi shines
and is able to achieve the second best result that I have seen so far.
4K random write queue depth profile
For this
test I used various queue depths from 1 – 32 to give you an idea how this SSD
performs at different queue depths. For a normal desktop user, with lightweight
multitasking, the queue depth will rarely rise above 2. For heavy multitasking,
the queue depth is unlikely to rise above a value of 8.
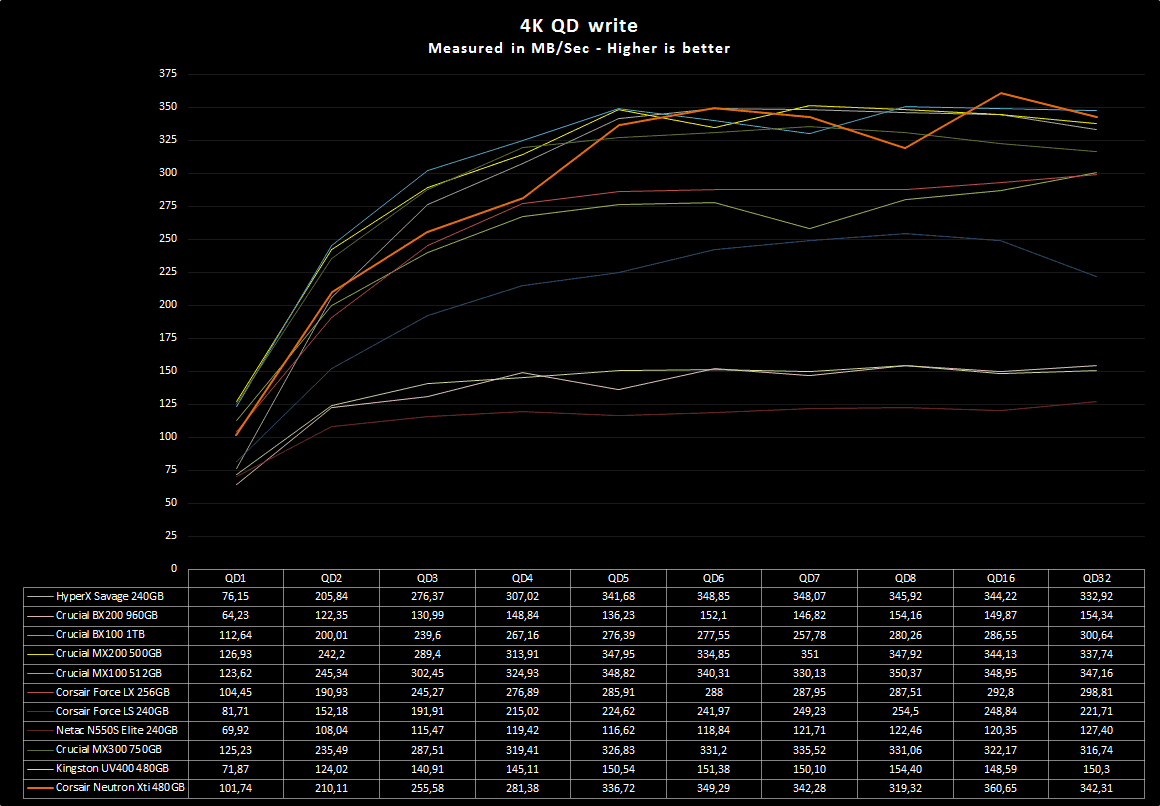
The overall performance of the Corsair
Neutron XTi is very good and in some cases close to excellent for an SATA3 SSD.
IOMeter 4K random read test.
If there are many 4k files created, then
that must also mean that many 4k files need to be read. This test measures 4k
reading performance.
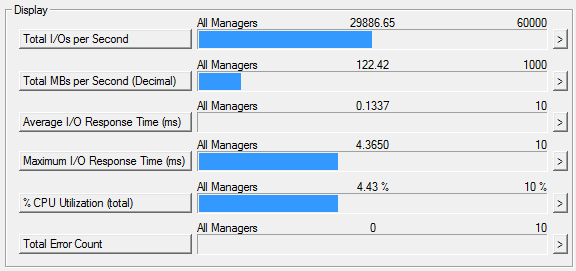
Queue depth 1
Corsair Neutron XTi 480GB SSD (Queue depth 1)
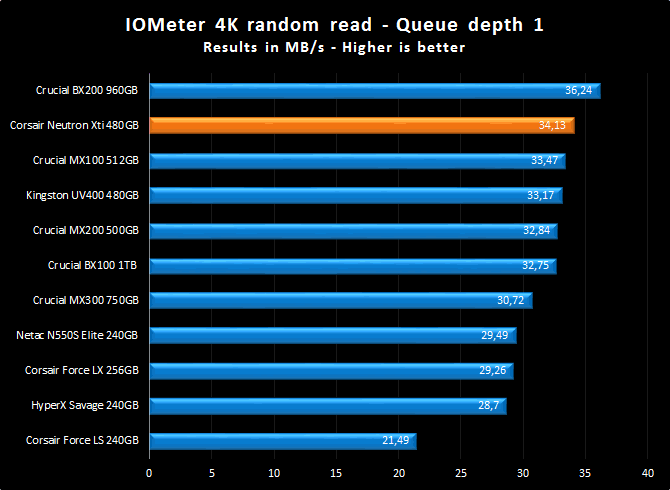
An excellent result to begin with.
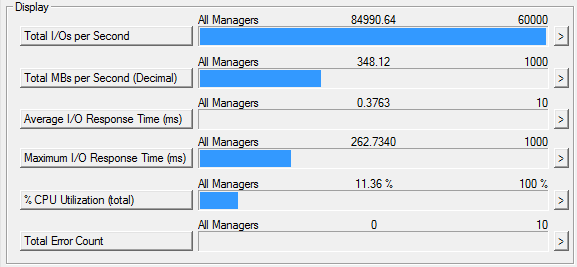
Queue depth 4
Corsair Neutron XTi 480GB SSD (Queue depth 4)
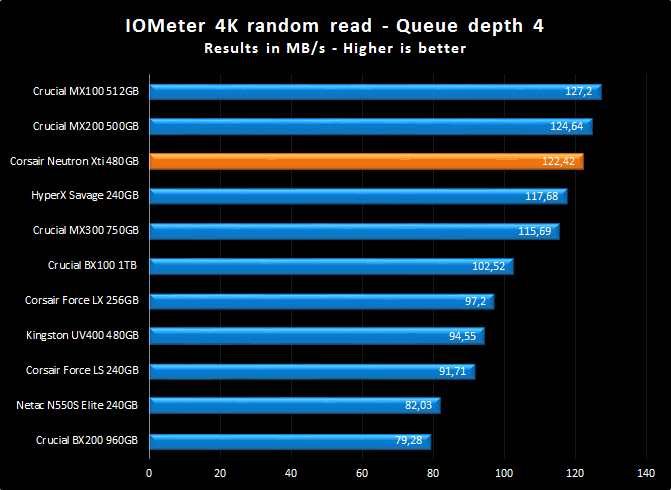
The performance of the Neutron XTi SSD is
excellent.
Queue depth 32
Corsair Neutron XTi 480GB SSD (Queue depth 32)
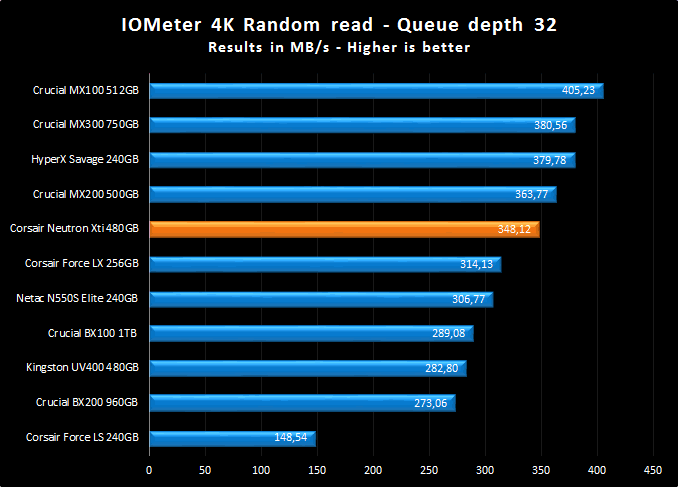
The result is very good for the Corsair
Neutron XTi SSD.
4K random read queue depth profile.
This test
shows how the review drive scales with increasing queue depths.
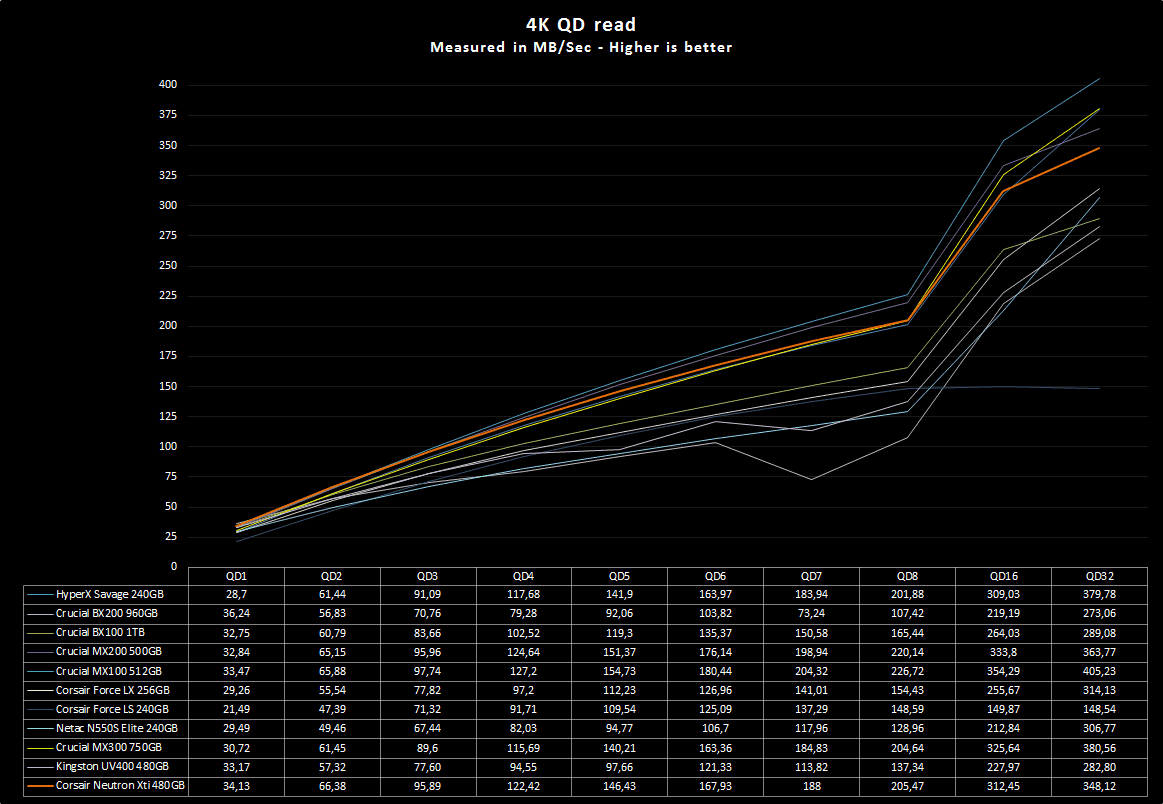
The performance of the Corsair Neutron XTi
is excellent up to QD8, after that it falls behind, but even then the result is
still very good.
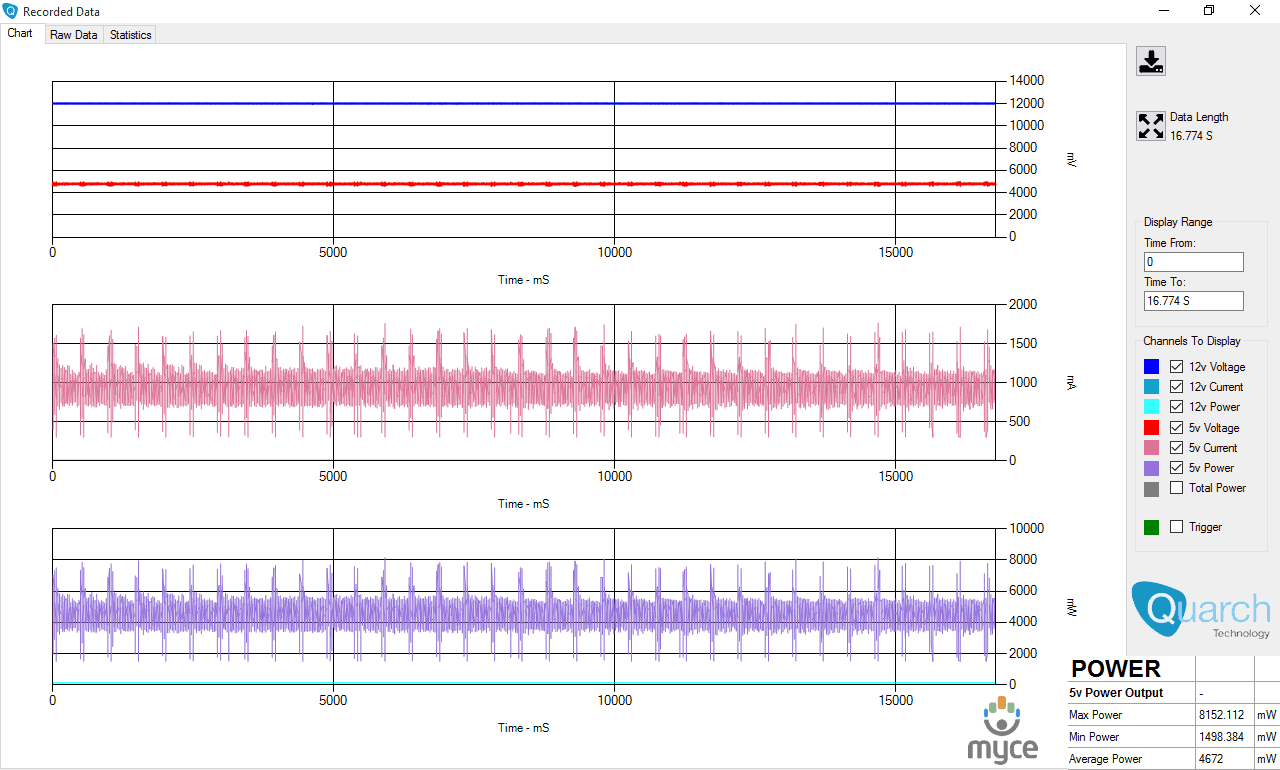
IOMeter 512KB write test with repeating data.
Sequential writing performance is also very
important, and in this test I will be measuring the sequential writing
performance of the drive.
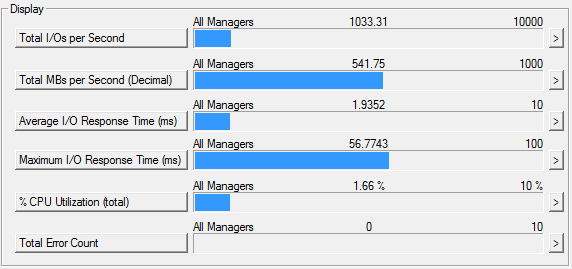
Corsair Neutron XTi 480GB SSD - 512K Sequential write with repeating data
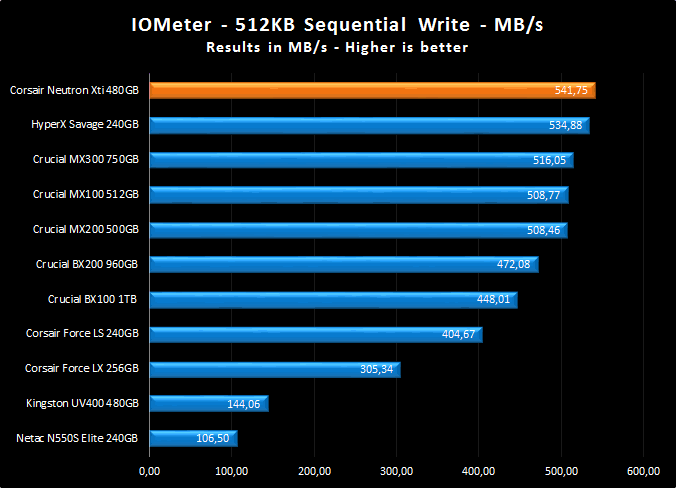
An outstanding result for the Corsair
Neutron XTi SSD.
IOMeter 512KB read test.
This test measures 512k sequential reading
performance.
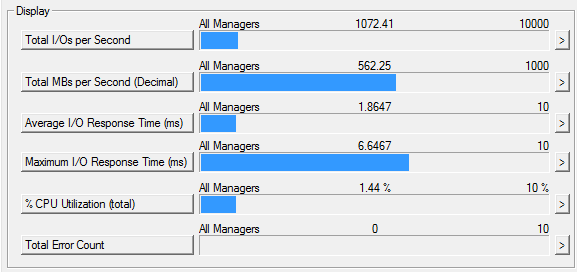
Corsair Neutron XTi 480GB SSD – 512K sequential reading test
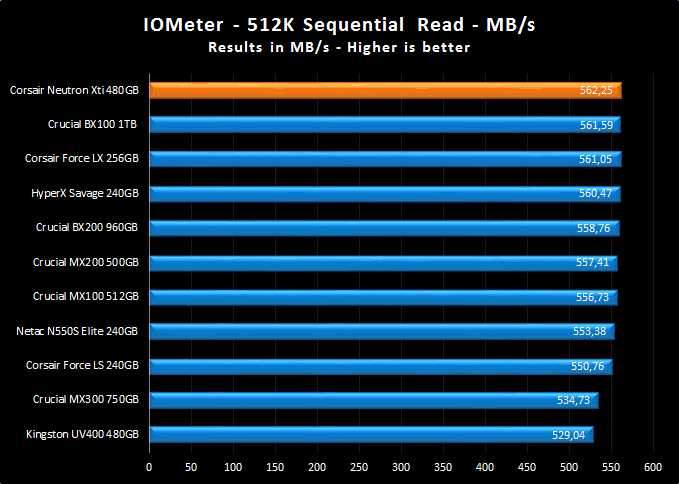
The same outstanding performance for the
sequential read test.
IOMeter Workstation simulation (outstanding I/Os = 64).
When running applications you will find
that there is a mixture of small random files and larger sequential files,
being created and read. Not only that, it isn’t just one file at a time. In
this test I measure a simulated workstation pattern, with a queue depth of 64
(threaded).
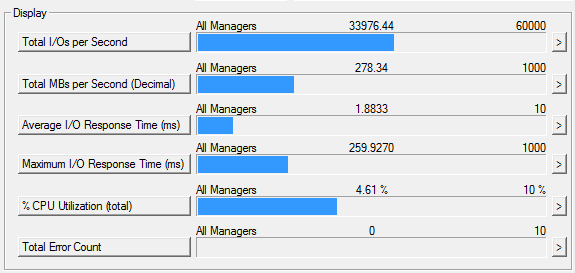
Corsair Neutron XTi 480GB SSD – Workstation simulation
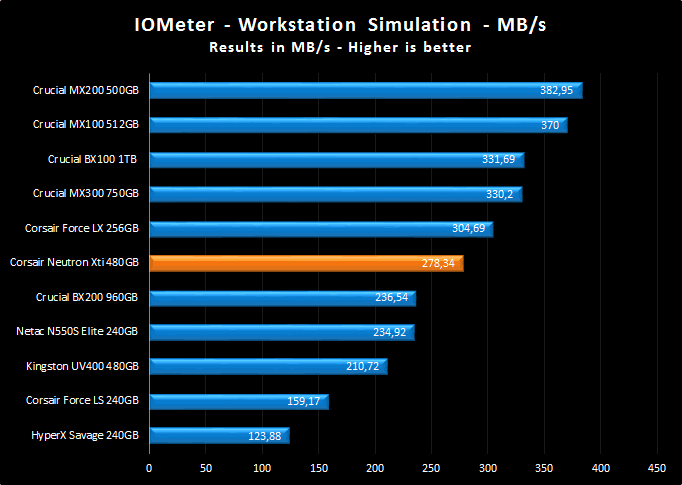
The result is very good.
Summary
Overall the Neutron XTi is a very fast SSD,
random read results were excellent, and very good in the random write test, but
its strongest part was with sequential data where the drive was able to give
outstanding results.
Let's head to the next page for our
power consumption test results.....
Power requirements and efficiency
Storage device manufacturers by law must
provide power consumption specifications with their storage device products.
Quite often these specifications are quite vague, and rarely, if ever, publish
the power efficiency of their storage devices with regard to how much work a
storage device can do for a given amount of energy consumed. In this article we
will disclose with unprecedented precision, the energy efficiency of some
popular storage devices.
Myce has now secured a piece of 'state of
the art' test equipment, which takes a sample every four micro-seconds, that I will
be using to measure the power consumption of consumer grade SSDs and HDDs. I'm so
very proud to be able to announce that Myce.wiki, in partnership with Quarch Technology, now aims to bring our
readers the most comprehensive, and accurate, power consumption tests ever
carried out on consumer grade storage devices, to be found anywhere on the
Internet.
Myce’s Power Testing will be carried out using
Quarch Technology products. More specifically we are privileged that Quarch has
allowed us to use their latest Programmable Power Module (‘PPM’) and we would
also like to take this opportunity to give a huge 'thank you' to Quarch for
providing this equipment. The PPM is specifically designed for testing low
power sleep states on modern SSDs and as such has a remarkably accurate low
level current measurement, down to 100μA (micro amps,
or millionths of an amp). Please click here
for details.
Quarch Technology is a world leader in the
supply of testing solutions for the data storage industry and if you would like
any further information please visit their website by clicking here.
Let's take a closer look at the Quarch PPM
box in a bit more detail.
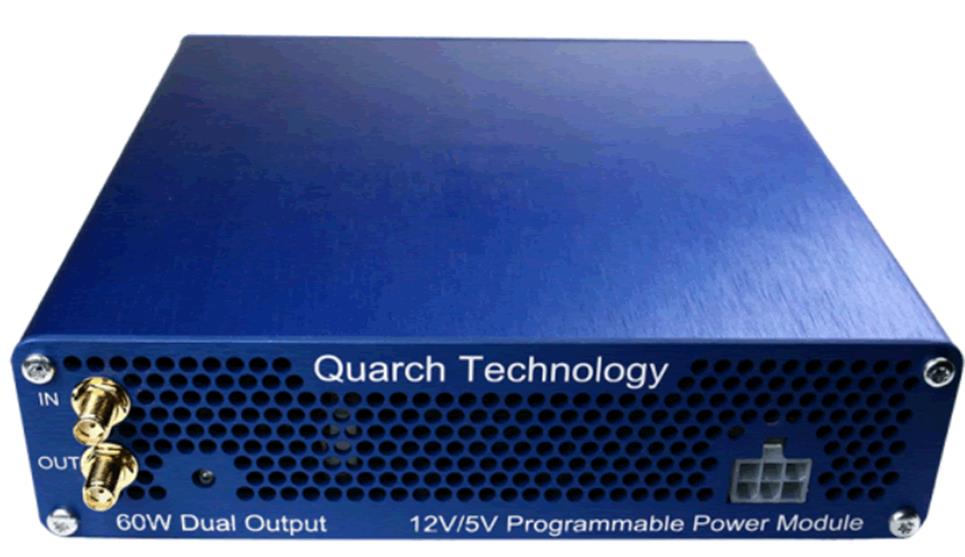
Quarch
Technology PPM
The Quarch Technology PPM is able to
provide two power supply rails to the target SSD. A 12V (volt) rail is required
for PCIe based SSDs, and also for SATA HDDs, SATA HDDs also require the 5V rail
to function. All the power requirements of a SATA SSD are handled by the 5V
rail.
The Quarch Technology PPM can switch
between 5V and 3.3V on the secondary power output channel as required. So for
SATA based SSDs it is set to 5V, and for PCIe based SSDs, it is set to 3.3V.
On the right of the Quarch PPM, you can see
the socket where the main power injection lead connects.
On the rear of the box (not shown) you will
find a USB 2 socket, a power socket (to supply power to the unit) and a
Torridon connection interface, for connecting to external equipment.
My setup.
Although the Quarch Technology PPM can be
used on a single PC, which can act both as host and measurement system, I will
be using two PCs to run the tests. One PC will handle the measurements, and the
second PC will act both as a host for the target SSD, and will also be used to
load the target SSD with data. This will allow me to do some pretty fancy power
consumption tests.
I will first show the type of workload
being used to load the SSD during the power consumption test. I will then
present the power consumption graph, and power consumption statistics of the
SSD.
I will display the results in the form of
bar graphs, at the end of each test carried out in this article, so one can
compare the results obtained on all the SSDs featured in this article.
I will use the following IOMeter test
patterns to load the SSD or HDD.
- 4K random read and write at a queue depth
of 1 (to emulate a lightweight consumer workload). - 4K random read and write at a queue depth
of 4 (to emulate a medium workload). - 4K random read and write at a queue depth
of 32 (to emulate a heavy workload). - 512K sequential read (to emulate reading
a sequential file from the storage device). - 512K sequential write (to emulate writing
a sequential file to the storage device).
Power requirements for a lightweight consumer workload. -
4K random read and write QD1
A typical lightweight consumer workload
will generally be at very low queue depths. Typically at a queue depth of one
or less. I'm testing random data at a block size of 4 Kilobytes, as this block
size of small random files is generally accepted as the most frequently
occurring in the consumer environment.
I will show the chart generated by the
Quarch PPM for the drive that I have tested. I will then show the results in
the form of bar graphs, so one can easily compare with other recently tested
SSDs.
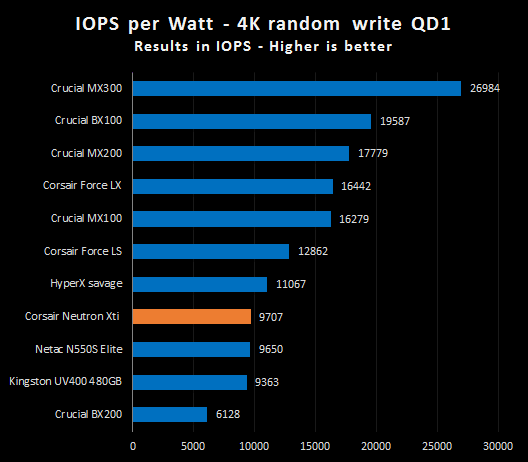
There will actually be two bar graphs for
each test. The first graph will show the average power consumption during the
test run. The second graph, which is much more important, will indicate the
power efficiency of the storage device, showing how much work the storage
device can do for each Watt of energy it consumes.
4K Random Read - queue depth 1
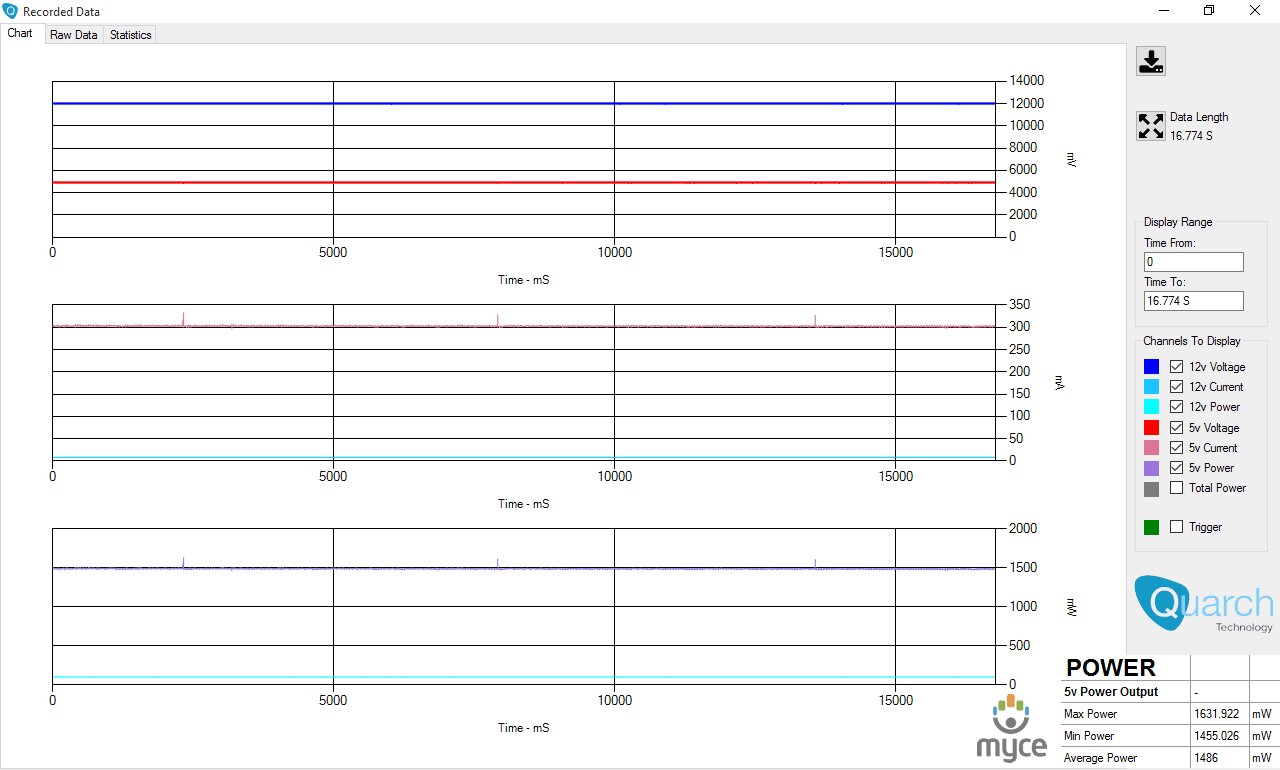
Corsair
Neutron XTi 480GB – 4K random read QD1
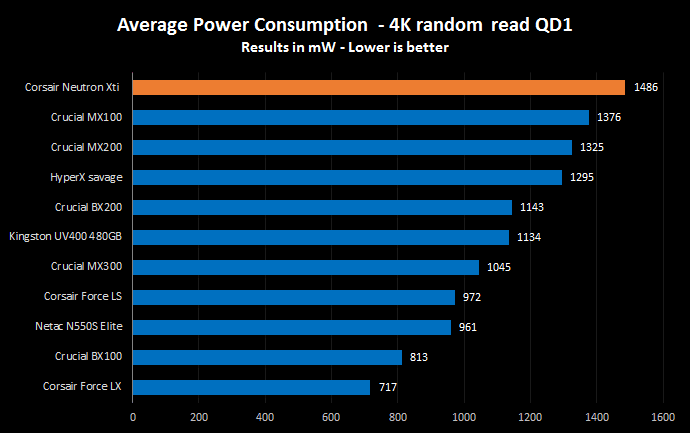
We can see that the Corsair Neutron XTi
requires a lot of power.
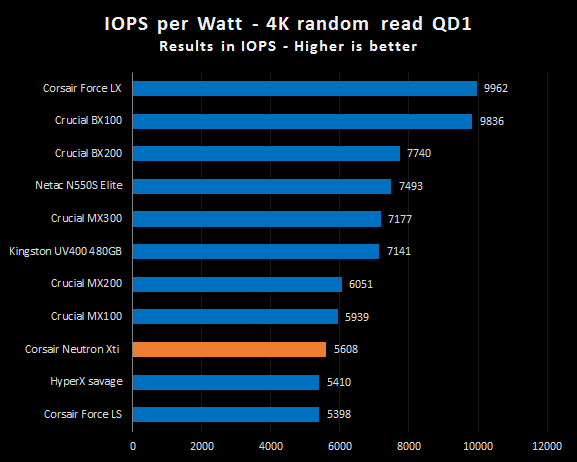
That extra power that is needed has an
impact on the IOPS per WATT score.
4K Random Write - queue depth 1
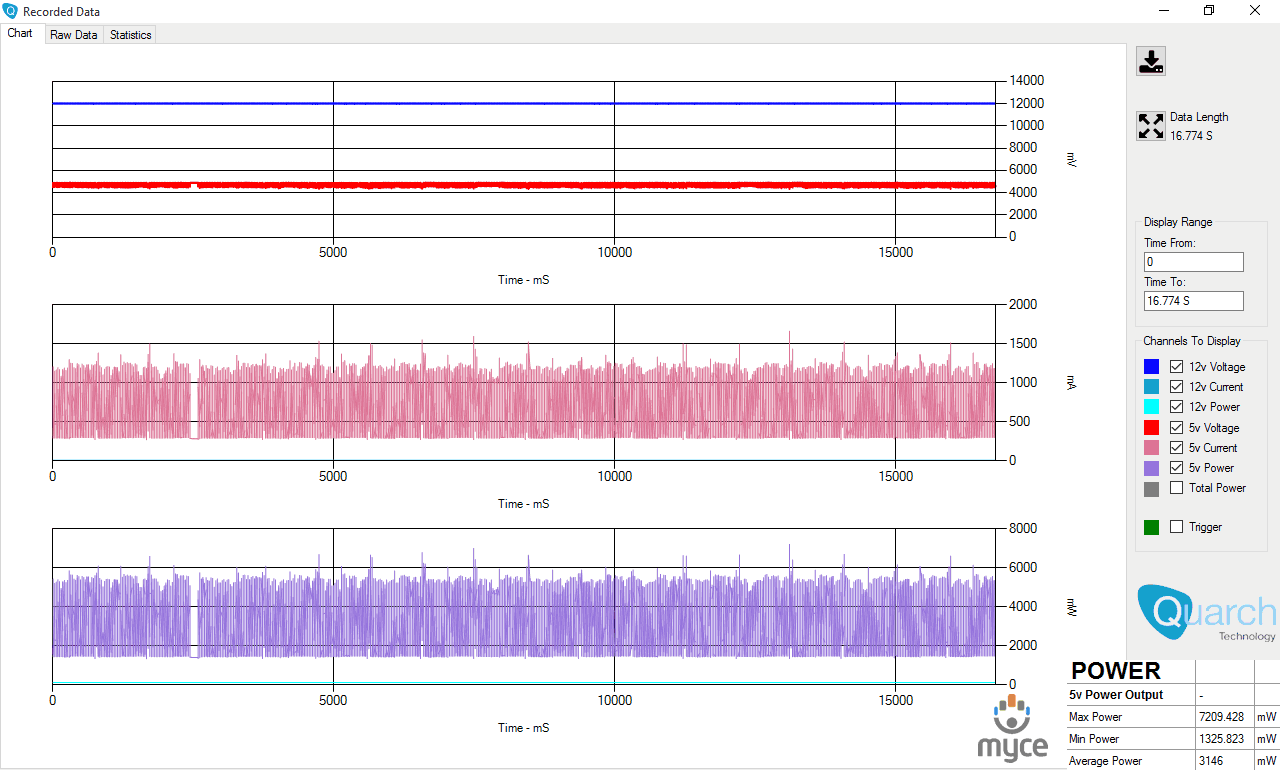
Corsair
Neutron XTi 480GB – 4K random write QD1
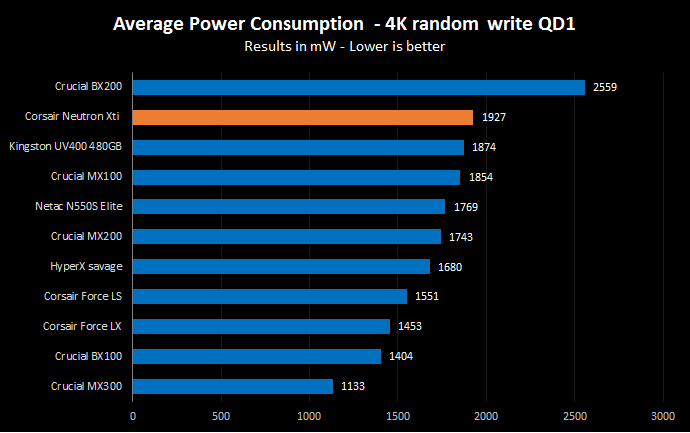
Also in the write test the Corsair Neutron XTi
is on the upper scale of the chart.
The result is good.
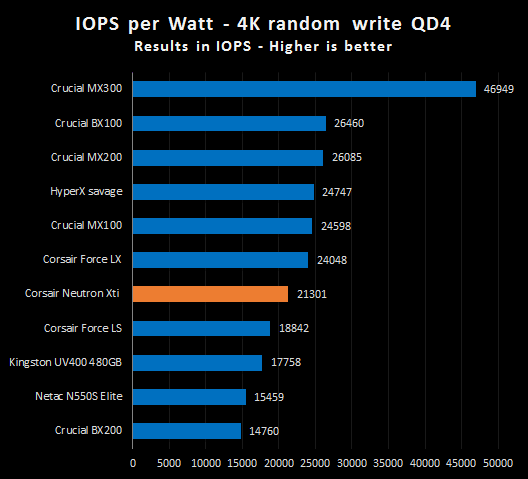
Power requirements for a medium weight consumer workload.
- 4K random read and write QD4
A typical medium weight consumer workload
will generally be at a queue depth of four or lower. This workload would
typically involve some multitasking, with perhaps two or three applications
running, and processing data simultaneously. I'm testing random data at a
block size of 4 Kilobytes, as this block size of small random files is
generally accepted as the most frequently occurring in the consumer
environment.
I will show the charts generated by the
Quarch PPM, for the drive that I have tested. I will then show the results in
the form of bar graphs, so one can easily compare with other recently tested SSDs.
4K Random Read - queue depth 4
Corsair Neutron XTi 480GB – 4K random read QD4
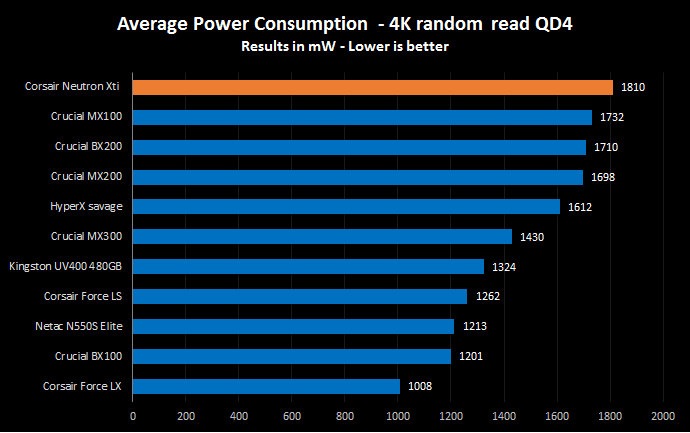
Again the result is not what I expected
from this SSD.
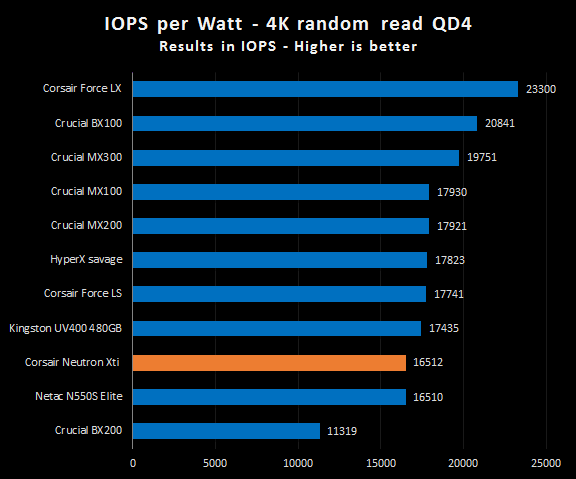
As expected the higher power consumption
impacts the IOPS per WATT performance.
4K Random Write - queue depth 4
Corsair
Neutron XTi 480GB – 4K random write QD4
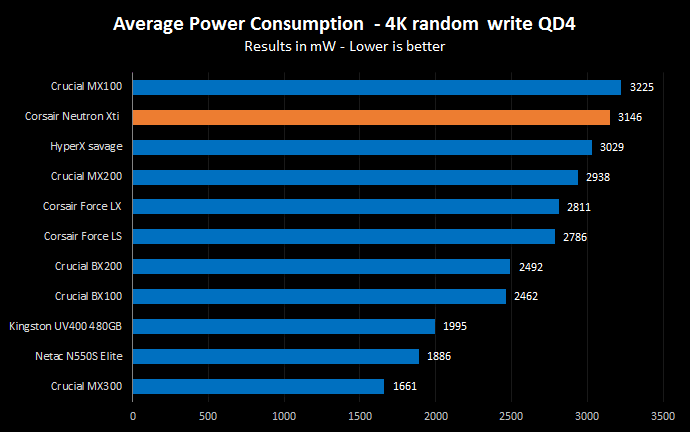
The Corsair Neutron XTi SSD is amongst the drives
that require a lot of power.
Nothing has changed, the extra power that
the drive draws limits its overall performance in this test.
Power requirements for a heavyweight consumer workload. -
4K random read and write QD32
Whilst this workload is unlikely arise for
the casual consumer PC user, it could well appear in a semi-professional
consumer environment, such as in a graphics workstation. This workload would
usually involve heavy multitasking, and having several processes running
concurrently that require constant access to small files located on the storage
device for input or output.
I'm testing random data at a block size of
4 Kilobytes, as this block size of small random files is generally accepted as
the most frequently occurring in the consumer environment.
I will show the chart generated by the
Quarch PPM, for the drive that I have tested. I will then show the results in
the form of bar graphs, so one can easily compare with other recently tested
SSDs.
4K Random Read - queue depth 32
Corsair
Neutron XTi 480GB – 4K random read QD32
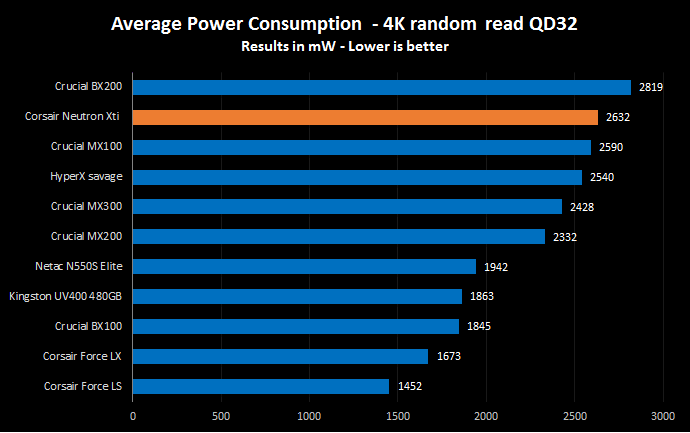
Nothing has changed, and for higher queue
depths the drive still needs more power.
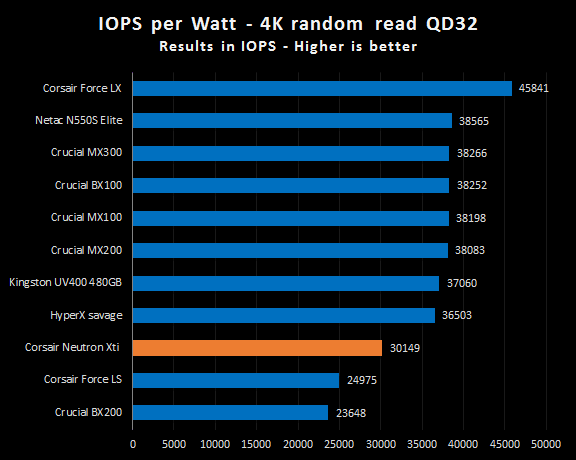
Once again the IOPS per WATT result puts
the Corsair Neutron XTi closer to the bottom of the chart.
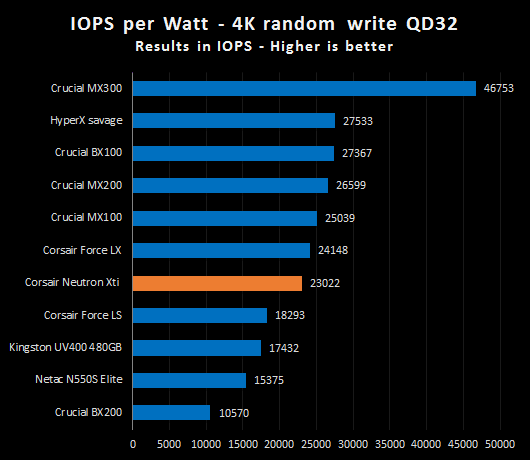
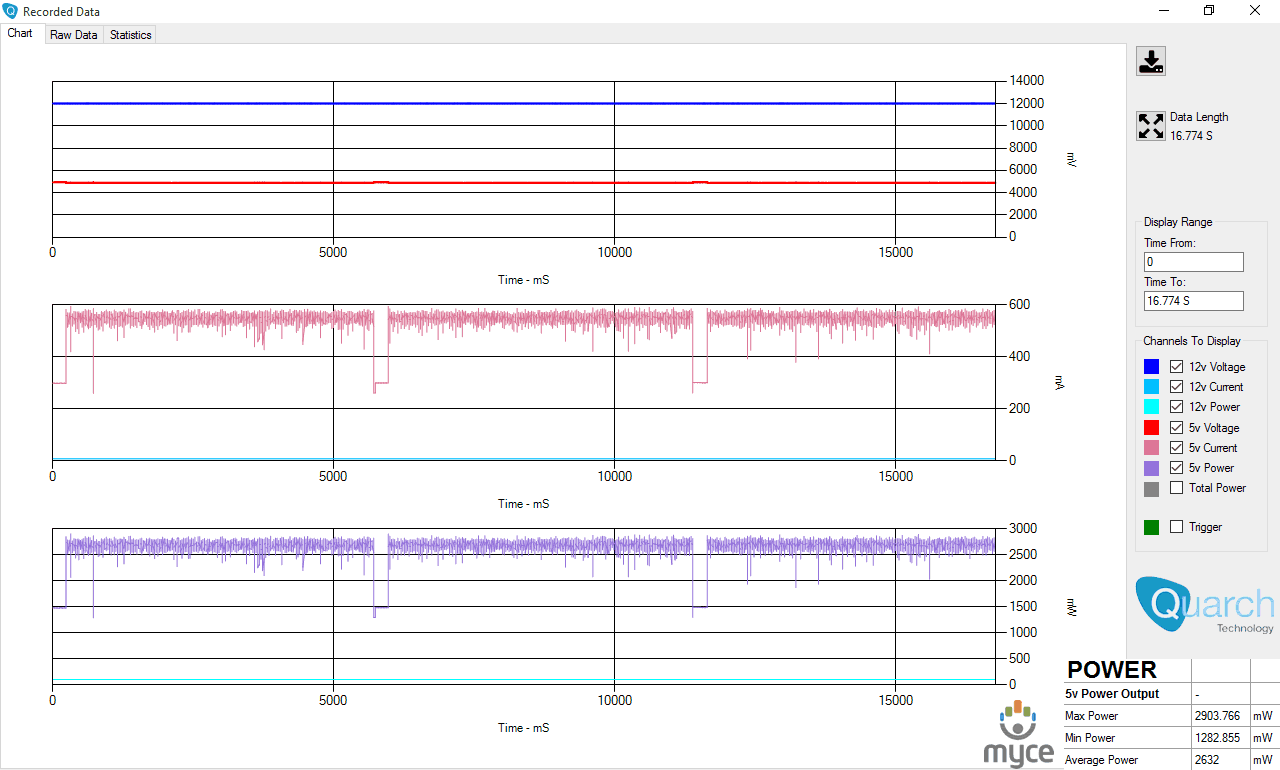
4K Random Write - queue depth 32

Corsair
Neutron XTi 480GB – 4K random write QD32
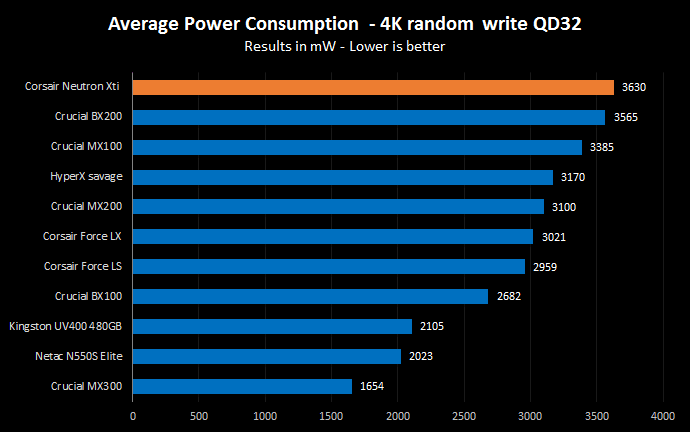
Again the result is not that good for the
Neutron XTi.
This time the Neutron XTi is much closer to
the middle of the chart but I would still have hoped for a better result.
Power requirements of a storage device when reading and
writing sequential data
Not all of a consumer workload is based
around the reading and writing of small random files. Many files are sequential
in nature, and can vary in size from a few Kilobytes to several Gigabytes, so
your storage device will spend a lot of time reading and writing sequential
data.
I'm testing sequential data at a block size
of 512 Kilobytes.
512KB Sequential read
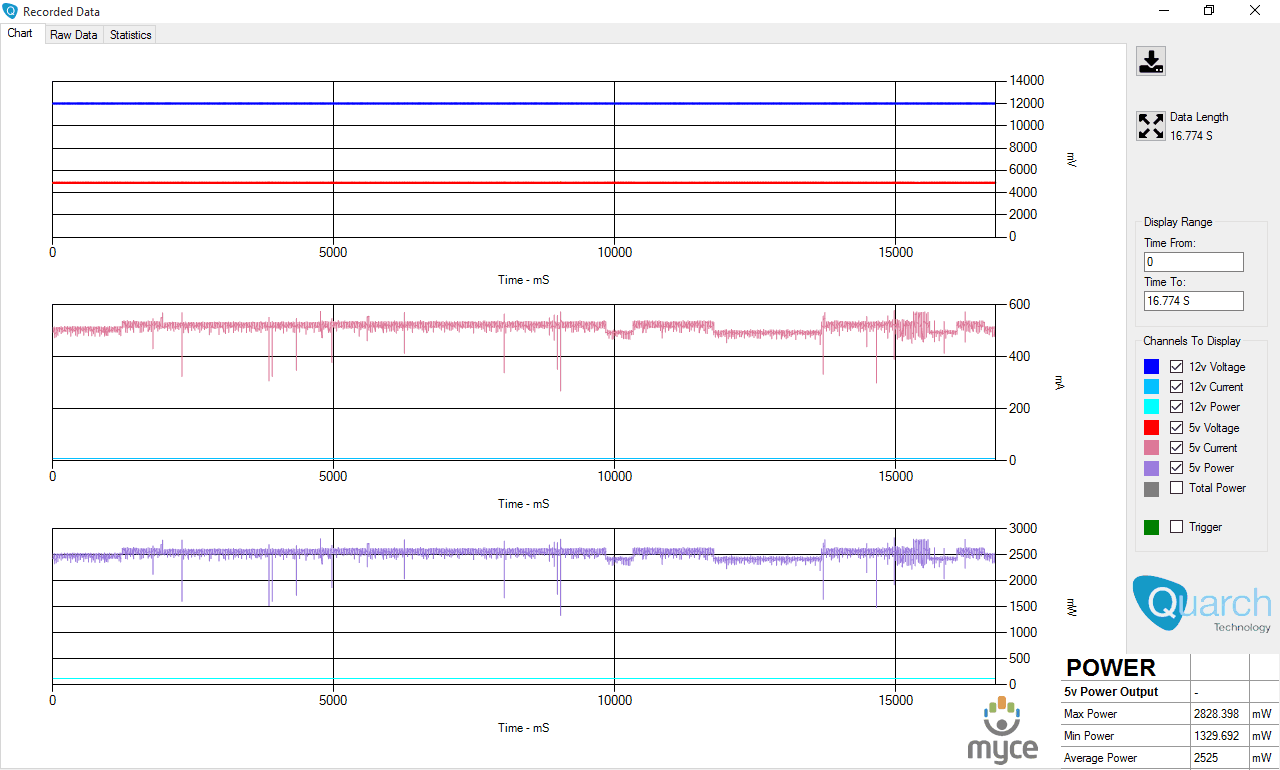
Corsair
Neutron XTi 480GB – Sequential read
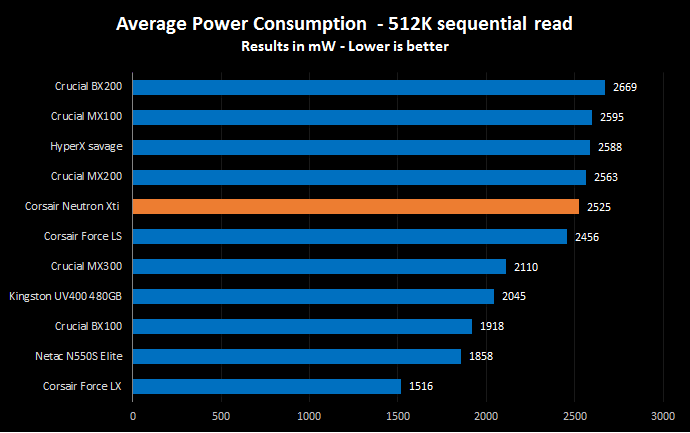
This result is very good for the Corsair
Neutron XTi SSD.
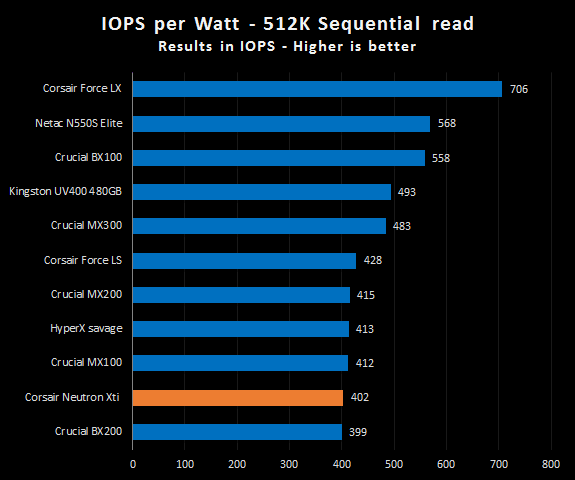
Unfortunately this doesn’t translate that
well for the IOPS per WATT chart.
512KB Sequential write
Corsair
Neutron XTi 480GB – Sequential write
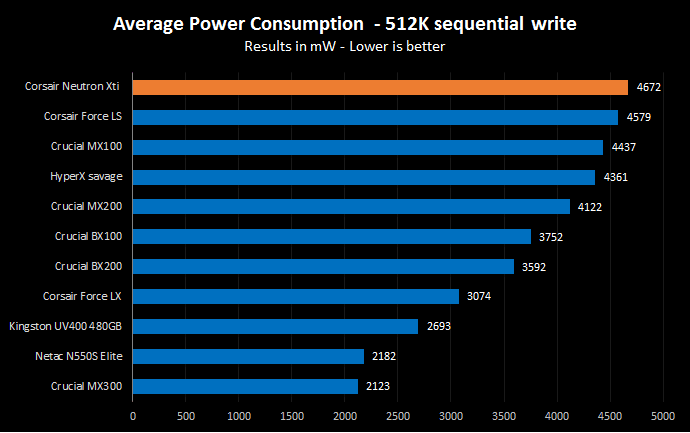
Again the Corsair Neutron XTi is showing
that it needs a lot power to complete this test.
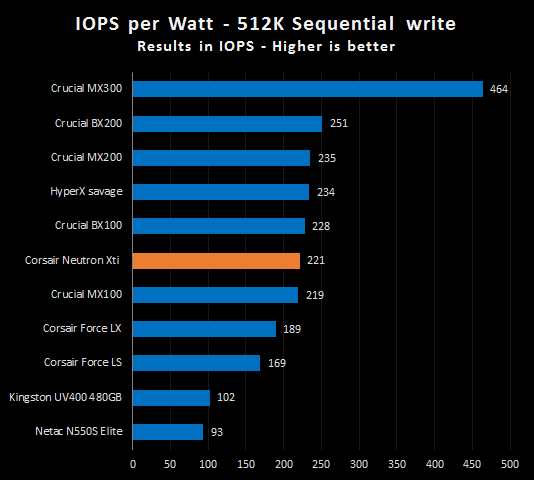
This time the result is very good.
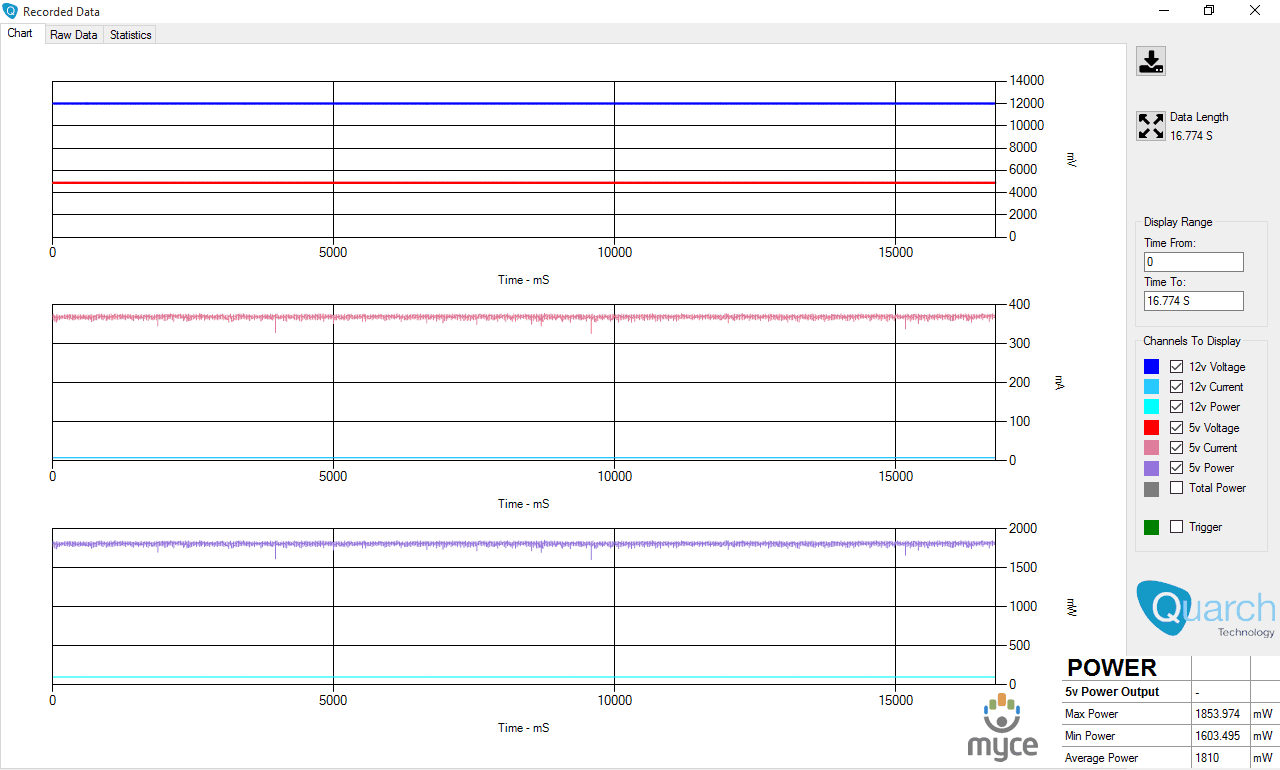
Power requirements of storage devices when they are idle
and doing no work at all
The practical reality relating to power
consumption is that it can be quite erratic and sometimes unpredictable. Some
of us will invest in the most powerful PC we can afford, only to find that the
PC can spend quite a lot of time running and doing absolutely nothing. Storage
devices are no different.
Often we can be sitting idly pondering what
to do next, or perhaps browsing the Internet. When we arrive at a page that
interests us, we will read it, and that can take a fair amount of time to
complete. During this period the storage device will most likely be idle, but
still consuming energy.
In this test, I'm measuring how much energy
the storage device consumes when doing no work at all and with link power
management disabled.
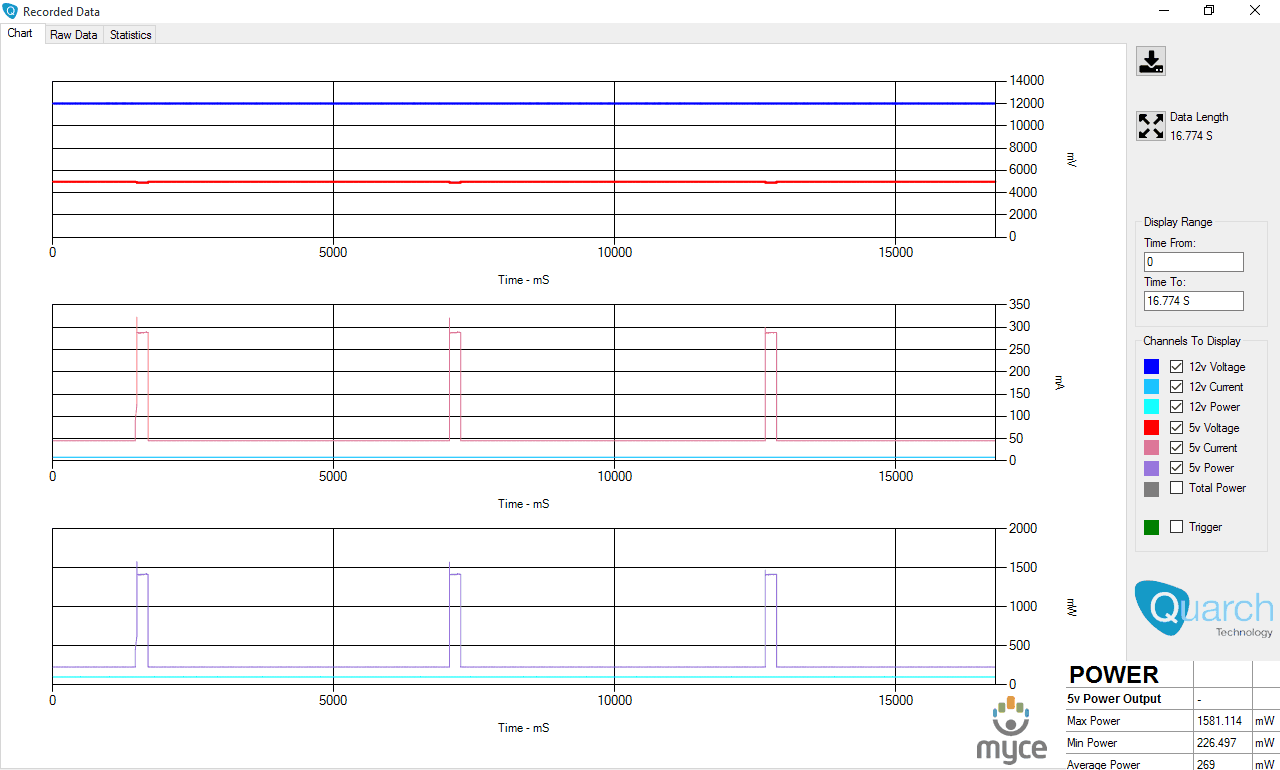
Corsair
Neutron XTi 480GB – Drive idle
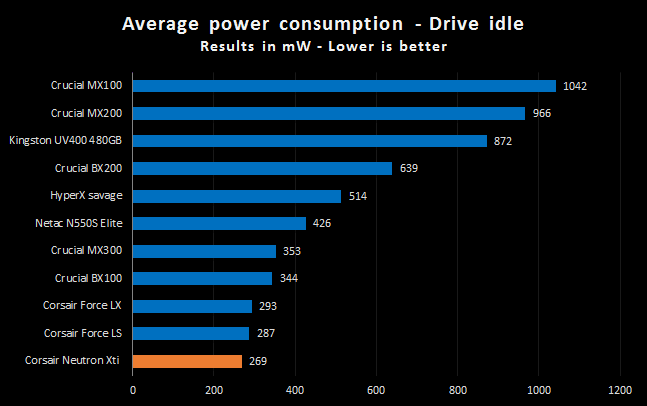
With all power saving features disabled the
Corsair Neutron XTi gives an outstanding result.
I will now show one more test, and this
should be regarded as for information purposes only.
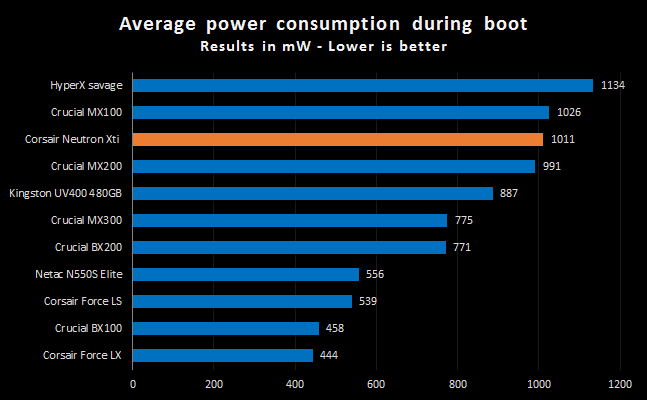
Power requirement trace of an SSD booting Windows 10, in
real time.
This test is for interest only, and shows
the power requirements of the review SSD booting Windows 10 to the desktop.
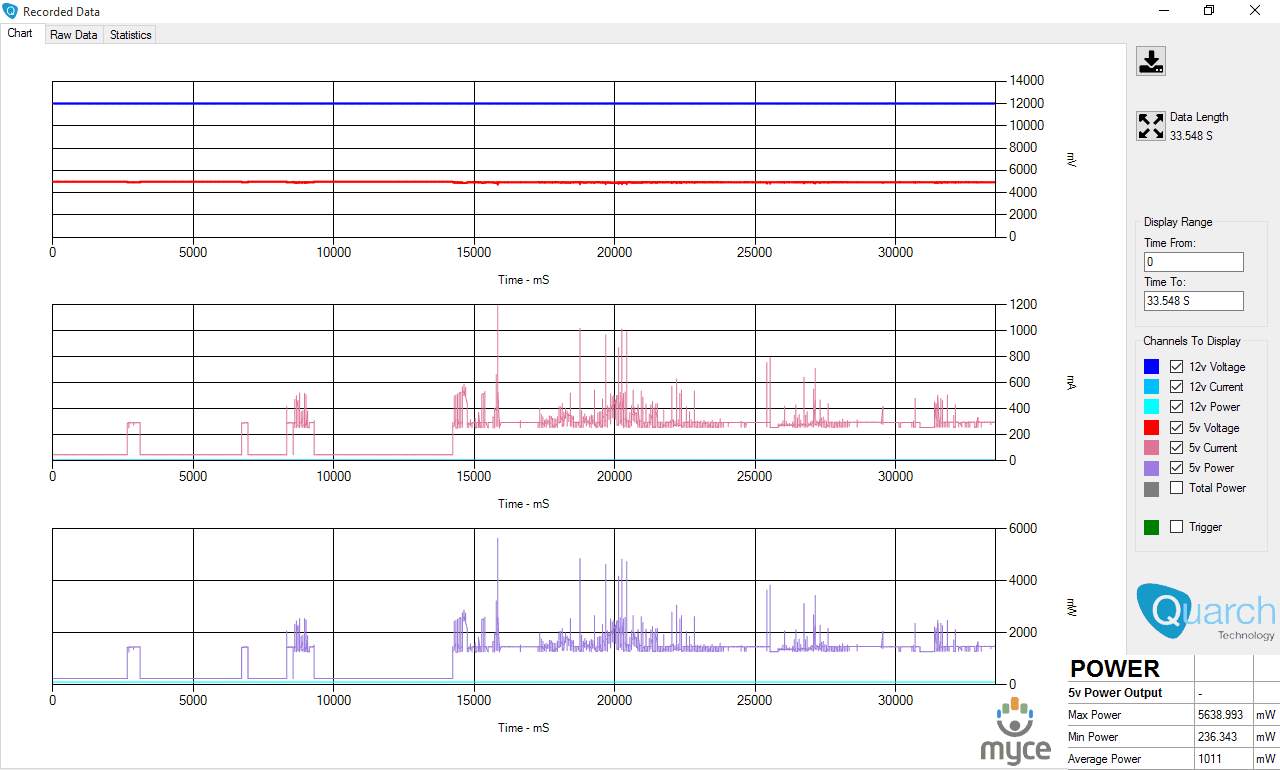
Corsair
Neutron XTi 480GB – Real time trace of the drive booting Windows 10 to the
desktop.
Here is the result for the Corsair Neutron
XTi SSD.
Summary
It is clear that the Corsair Neutron XTi
SSD requires some extra power to deliver the high performance, and for most desktop
users this probably won't be a problem. To be honest most power users will want
the extra performance and won't care about the extra power consumption. The
drive also gave an impressive result when it was idle, so maybe there is room
for improvement with a future firmware? I hope so.
Now let’s head to the next page where we
will look at how the Corsair Neutron XTi SSD performs using Anvil's Storage
utilities....
Anvil’s Storage Utilities
As well as performing SSD endurance tests.
Anvil’s Storage Utilities has a very nice SSD benchmarking application. The SSD
benchmark tests many different aspects of SSD performance, including 4K random
at different queue depths, and also sequential performance, but more importantly
than this, all using real test data.
Another very nice feature of Anvil’s SSD
benchmark is the fact that you can change the compression levels of the test
data. The compression levels of the data sets used for the tests can be varied
from 0% compression right up to 100% compressed data, and there are even a few
data profiles already included, such as database (8%) compression, and also an
application profile (46%) compression, which is designed to simulate real
application data being read and written to the SSD.
Anvil’s Storage Utilities is still in beta
at the moment, but the application is currently solid enough to use in this
article, and I have already verified the results obtained using an SATA
analyser.
I will include a screenshot of the review
drive, and all comparison results will be presented in the form of graphs. If
you would like to see screenshots of the test results obtained on the other
SSDs in this article, you can do so by following the link here.
I will also be testing three different
compression profiles, which are as follows.
- 0 fill (100% compressible data)
- Application simulation profile (46%
compressed) - 100% (non compressible data)
So let’s begin the tests.
0 fill

Corsair Neutron XTi 480GB SSD (0 fill)
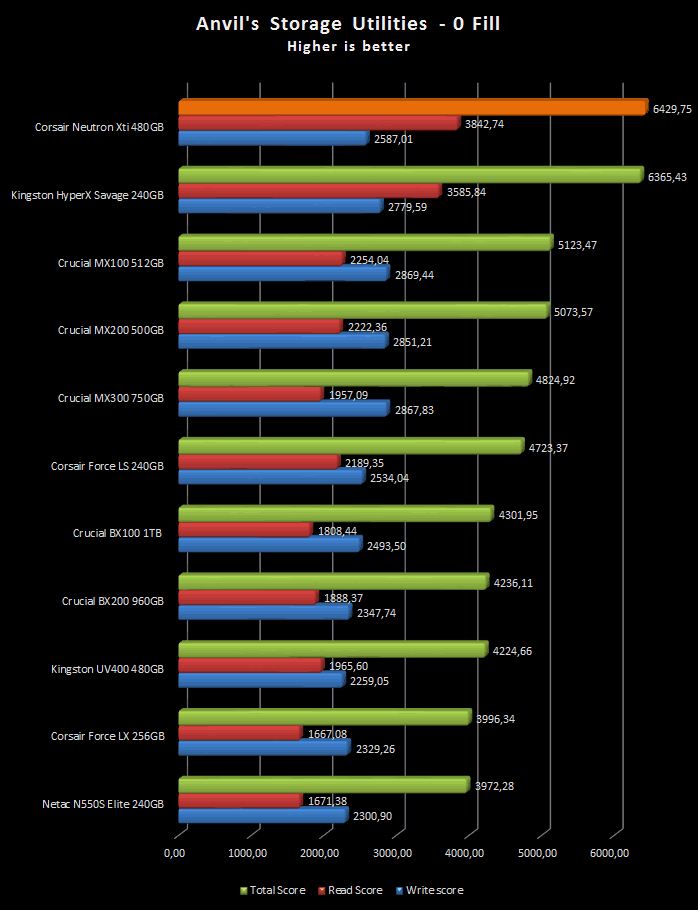
Results
are ranked by highest total score.
An outstanding result for the Corsair
Neutron XTi SSD with compressible data.
Application profile
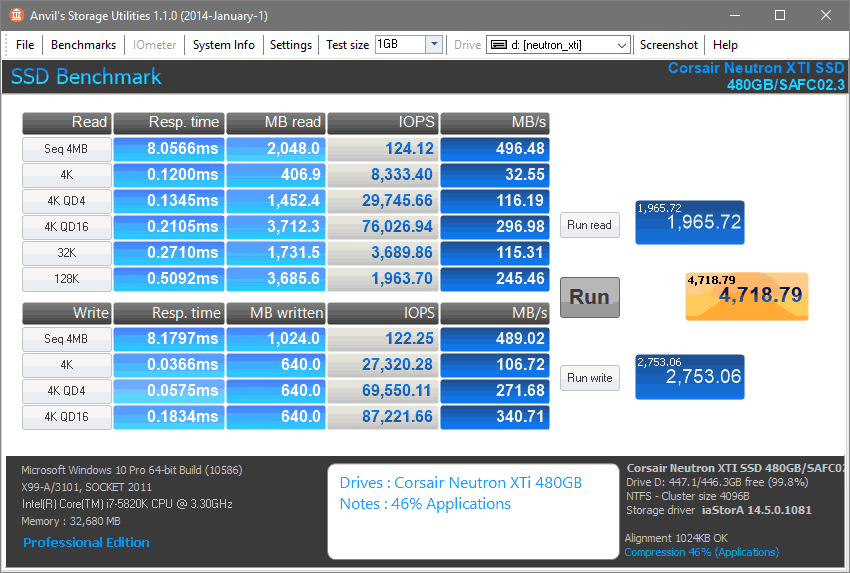
Corsair Neutron XTi 480GB SSD (application profile)
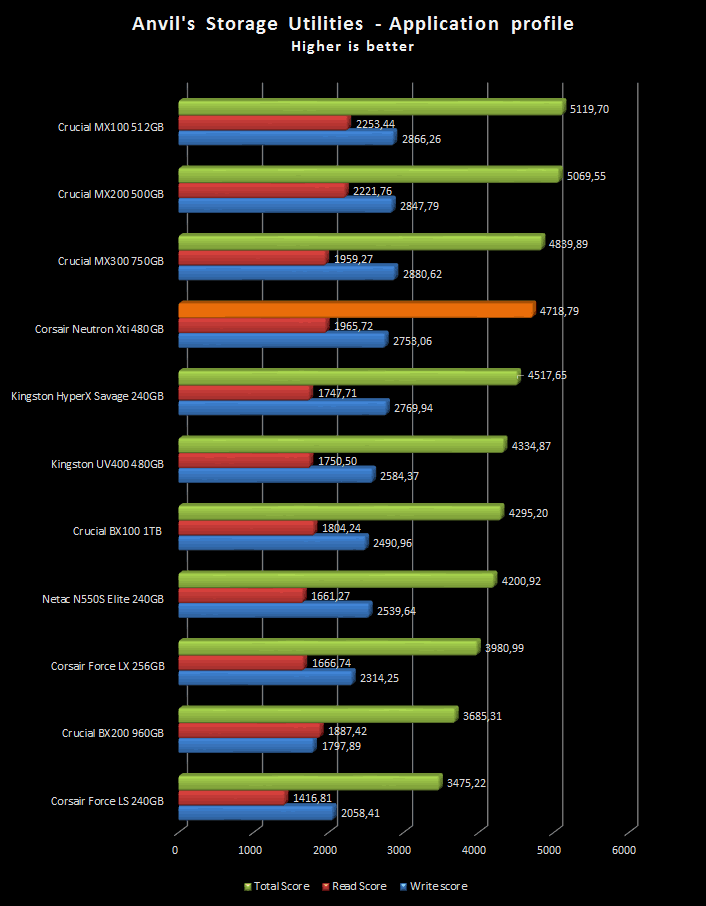
Results are ranked by highest total score.
Again the result is very close to excellent.
100% incompressible
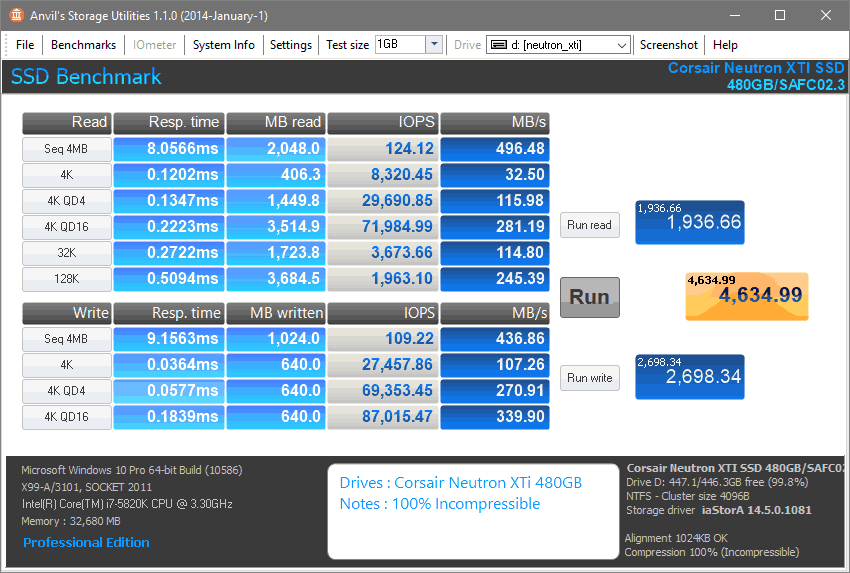
Corsair Neutron XTi 480GB SSD (100% incompressible)
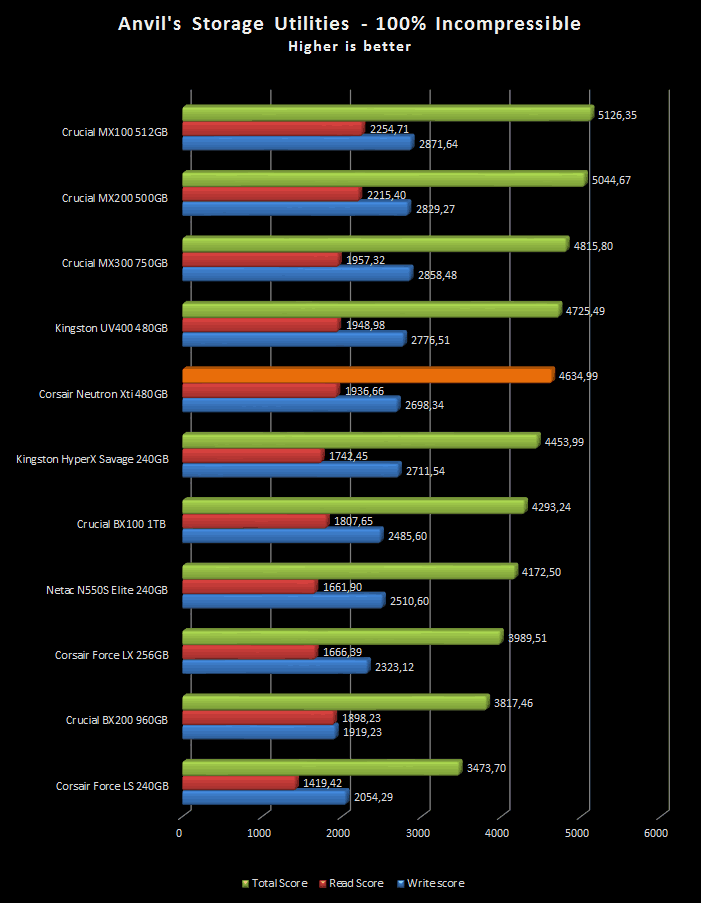
Results are based on the highest total score.
It looks like the Corsair Neutron XTi SSD doesn't
like incompressible data that much, but still the result is very good.
Summary
The Corsair Neutron XTi SSD loves compressible
data, after that there is a drop in performance but it still managed to give an
almost excellent result.
Now let's head to the next page for some
real world tests....
It has become clear that simply conducting
endless benchmarks on SSD drives is pointless. Real users may run a few
benchmarks when they first fit their SSD drive, but most users just want a
drive that performs well in the real world. They want their drive to work
"out of the box" and work fast and smoothly.
Most of the latest SSD drives can deliver
very fast sustained reading and writing speeds, but these alone tell you very
little about how the drive will perform in the real world.
If you intend to use your SSD as your
primary system drive, with an operating system and applications installed and
running from the drive, real world performance becomes much more important than
just fast sequential read and write speeds, in this case I felt that it was
time to move into a different method of testing.
From now on I will only use the log files
from the Event Viewer to measure the start-up and shutdown of the system, and
also use filecopy to measure all my copy tests from a RAM disk to the selected
storage drive that I will be testing. For these tests I will also enable all
power savings features that are available, since I believe that this is the way
that the majority of the users will have them set on their PC.
Real
world copy tests
I will now conduct some real world copy
tests so that you can have a much better view of how the drive will perform. In
these simple tests I try to simulate what a real user does with their drives. I
will be copying some mp3 files, various picture and MKV files, and finishing by
installing MS Office 2007.
As I said earlier from now on all my test
files will be stored in a RAM disk and copied/pasted to the destination drive
using filecopy. The filecopy utility will be used from now on for all my tests,
and I’ll be using it this way to measure the time that it takes to copy the
files.
Before I move on to the test, I want to
give you an idea on how fast your RAM is. Below you can find the results.
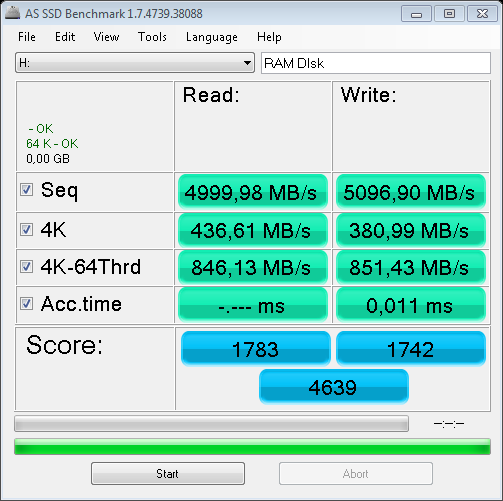
As
we can clearly see speed isn’t going to be an issue in these tests.
Read write tests – 259 MP3 song files (1.36GB total)
I will start this set of tests by copying
259 MP3 files from the RAM disk to the destination SSD and also from the SSD to
the RAM disk.
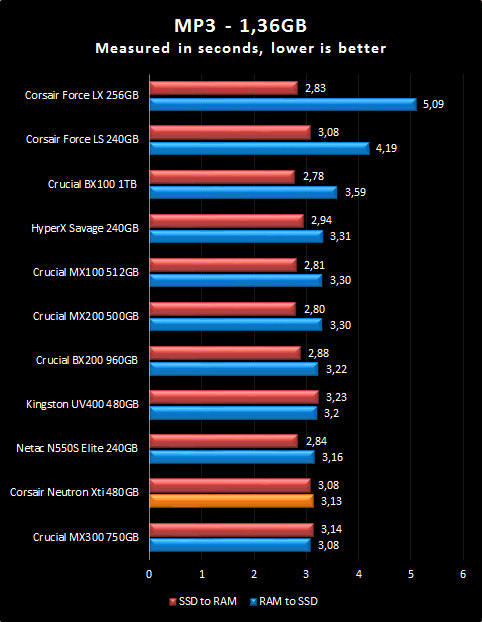
The write result is excellent also the read
result is very good for the Corsair Neutron XTi.
Read write tests – 3,377 JPEG picture files (2.56GB total)
Continuing my set of tests, but this time I
will be copying 2.54GB of pictures that are stored in the RAM disk to the
currently testing SSD and vice versa.
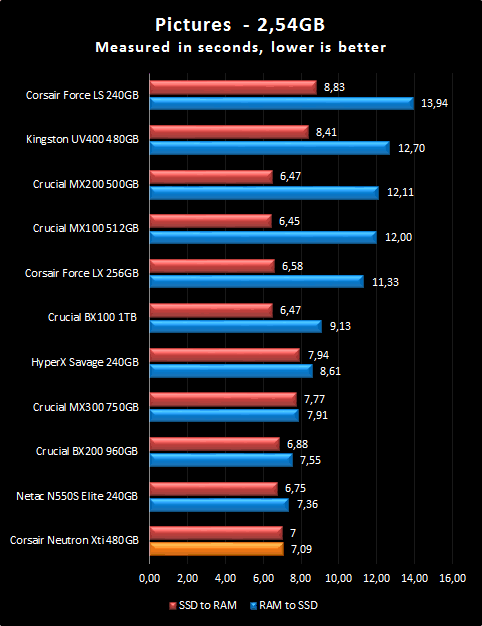
Both read and write results are excellent.
Read write tests – 1 MKV and 1 SRT file (3.46GB)
Copying a movie is very common task for all
of us, and in this test there are two files that will be copied from the RAM
disk to the SSD and again from the SSD to the RAM disk.
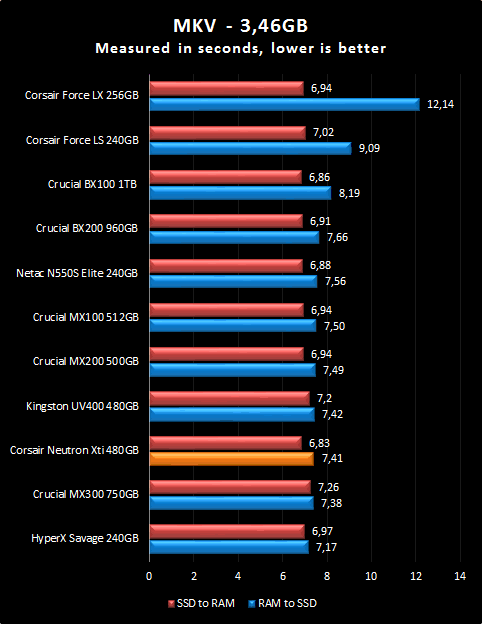
Again both results are excellent.
Read write tests – ISO (7927MB)
For this test, I copied ISO of the 'Iron
Man' movie from the RAMDisk to the SSD and vice versa.
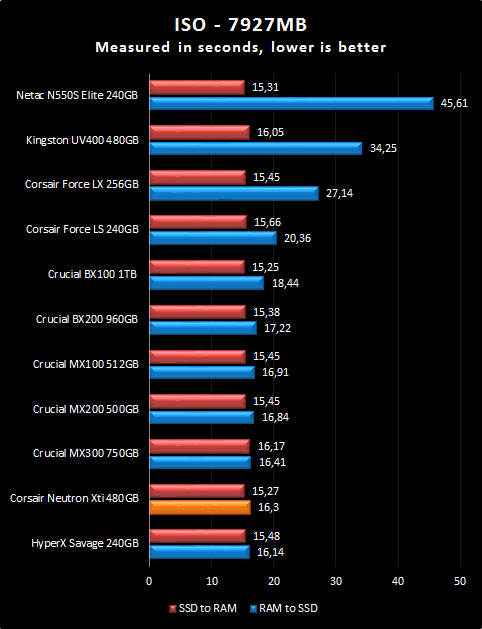
It’s clear that large files are what this
drive likes, both result are excellent.
Read write tests – Small files (533MB)
I have decided to adapt the very small
files test that I am using as part of my USB3 flash tests, so this time I will
be also copying all the files from the RAM disk to the SSD, and again from the
SSD to the RAM disk.
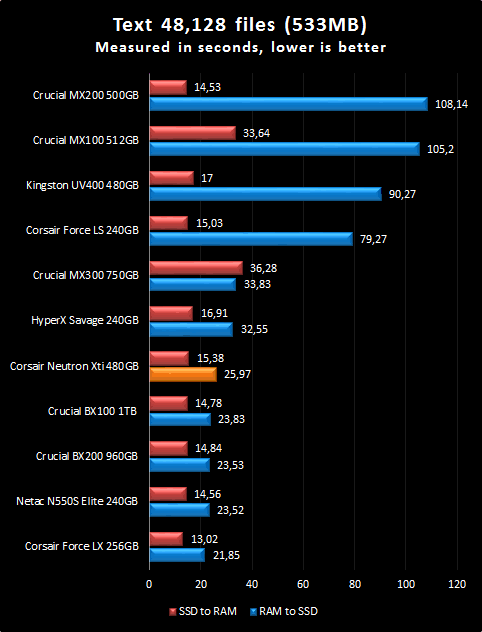
Even with very small files the Corsair
Neutron XTi SSD gives a very good performance.
Windows start-up based on the Boot Racer 5.00
Start-up time
On the next screen shot you can compare the
current tested SSD and compare it to other drives that I have tested. Below I
present the results.
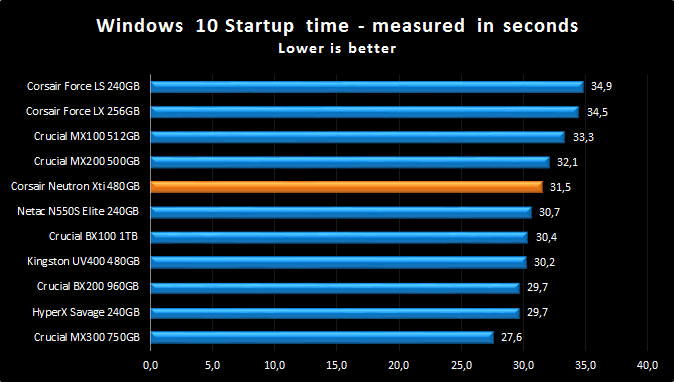
The Corsair Neutron XTi SSD gave a very
good result of 31.5 seconds to boot into Windows 10.
Installing applications
Installing applications is possibly
something you don't do that often. But should you replace your system disk,
then you will most likely have to re-install your applications. Most of the SSD
drives I have tested up until now are quite slow at installing applications,
most likely because their I/O performance was quite limited.
For these tests, we picked some popular
applications and copied the entire contents of the CD or DVD media to the RAM disk.
We did this to make sure that the reading speed of our CD/DVD reader would not
hamper the performance of the target drive.
We then installed these applications onto
our comparison HDD drives, which were all running mirror image installations of
our Windows 7 Home Premium 64-bit installation, and timed the amount of time
taken to install the application with a stopwatch on each of the drives.
MS Office 2007 Enterprise (full install)
Now let’s see
how the Corsair Neutron XTi 480GB SSD performs with the installation of MS
Office 2007 Enterprise Edition.
The procedure
followed was very simple. I copied all the files from the CD to the RAM disk and
used the virtual drive as a source for the installation files.
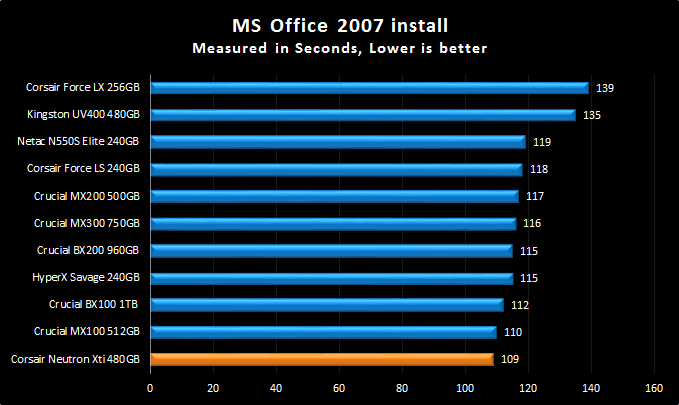
Another excellent result for the Corsair
Neutron XTi.
Speed degradation after heavy testing
On this page I will measure how the SSD
performs after heavy testing and usage.
I will run an AS SSD benchmark test when
the OS is freshly installed so that we can get a good view of how the drive
performs with the OS. After that I will fill the drive up to 50% of its
capacity, use the drive for a few days, and then re-run the AS SSD benchmark.
The same procedure will be followed once again, but this time the drive will be
filled close to 90% or higher of its capacity. To finish this test, I will
simply delete all the extra data and leave the PC idle for a few hours so that
the controller has the time to perform any necessary cleaning, then see how the
drive performs.
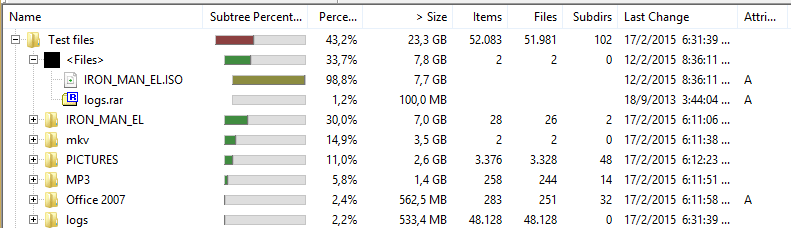
In this picture you can see the test files
that I will be copying to fill the drive with data, as you can see files vary
from 8GB ISOs to very small text files.
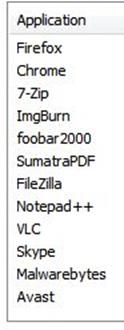
In the picture below you will find all the
applications that were installed for this test using Ninite, and I have also installed Microsoft
Office 2007.
Now let’s start our tests.

Starting with the fresh install of Windows 10,
and running AS SSD to get an idea of how the Corsair Neutron XTi performs, we
can see that the score is very close to the one that I got when the drive was
connected as a spare for my testing with all power saving features disabled, so
with everything now enabled and also an OS running the result is excellent.
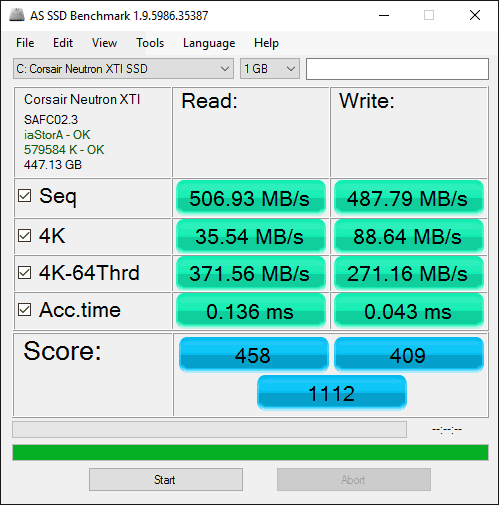
The 32GB of over provisioning appears to do
a very good job. This result is with the drive having less than 4GB free space.
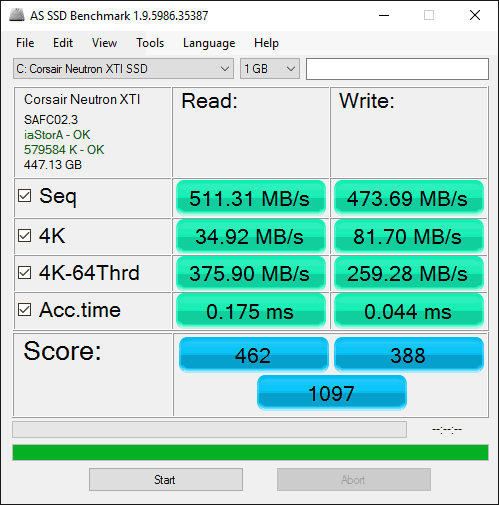
This time the drive is half empty, and the
result is very good. Keep in mind though that I didn’t give the drive much time
to do its cleaning.
With all the extra files deleted, and
allowing it to run idle for a few minutes, the result is again very good.
This concludes our review. To read the final
thoughts and conclusion, click the link below....
The cons:
My main complaint would have to be the
power that drive needs to achieve its performance. I would also have to say
that the red colour can be a plus or minus for some.
The pros:
The first thing that caught my eye was the
red colour of the SSD. I might not be a fan of red, but I have to admit that
this was very attention grabbing. The next thing that I liked was the fact that
it comes with the Corsair SSD Toolbox. A small update in the colour of the
software would be welcomed, but you can do almost everything that you need and
also monitor the SSD.
The five year warranty is more than
welcome, and it shows that Corsair has a lot of faith in the drive.
Performance with sequential reads and
writes is excellent, also numbers in the 4K test are very good, but most
importantly the real world performance was impressive. The way that the drive
was able to maintain a high performance even when it was almost 100% filled
with data was very impressive. This might have to do with the drive having 32GB
of overprovision by default, which is another plus, and you don’t have to
manually set the overprovisioning. The Idle power results were also very good,
and hopefully with a firmware update there will be even better results with
this aspect of its performance.
To sum up, this is what I would say:
Corsair has done an excellent job with
the Neutron XTi SSD, excellent performance, excellent choice in NAND, lots of
RAM, and all this works great with the Phison controller. It shows that you
still can have an excellent SSD without any sacrifices in quality and
performance.
Therefore, I give the excellent award to
the Corsair Neutron XTi SSD.

Thanks to:
|
|
EFD |
|
|
Alex Schepeljanski for |
|
|
|
|
|
FutureMark |
|
|
Quarch |


You may comment on this review here, you
can also post your benchmarks in our forum.


")


