 |
Review: Intel DC P3700 1.6TB NVMe Enterprise SSD |
Welcome to Myce’s review of the Intel DC P3700 1.6TB NVMe Enterprise
SSD (hereafter referred to as the Intel P3700).
This is the first NVMe drive we have reviewed. NWMe stands
for ‘Non-Volatile Memory express’. NVMe, is a specification that allows a
solid-state drive to make effective use of a high-speed Peripheral Component
Interconnect Express bus in a computer. Intel has taken a leadership role in
the implementation of NVMe and is the first to bring an NVMe drive to market.
Fortunately for Myce, our partner OakGate Technology has
been at the forefront of NVMe testing and validation. OakGate’s Marketing
Director, Vipul Mehta says - "OakGate Technology was the first company to
offer an advanced test platform for NVMe flash storage. Working closely with
industry leaders, the company has incorporated a number of cutting-edge
features and functions for PCIe flash products supporting both NVMe and AHCI
protocols. Today, all leading suppliers of solid state storage rely on
OakGate's systems for test and validation of their NVMe products." Check
out Oakgate’s website - here
So please read this review for an authoritative performance
assessment of the Intel P3700 – it is a truly amazing drive!
Market Positioning and Specification
Market Positioning
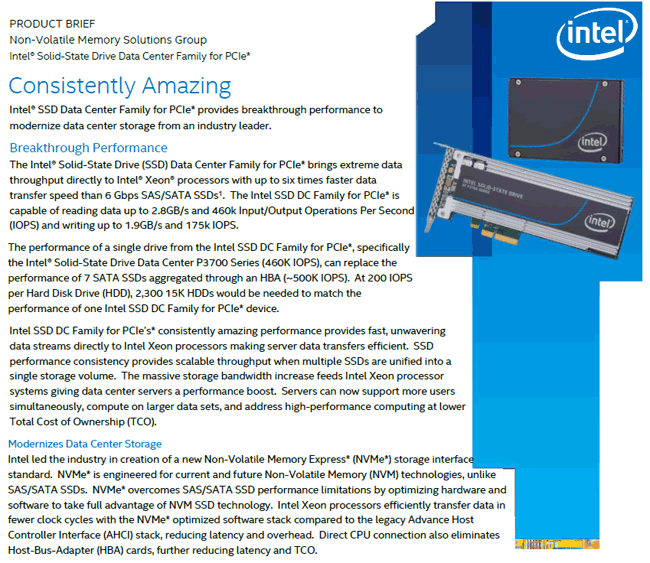
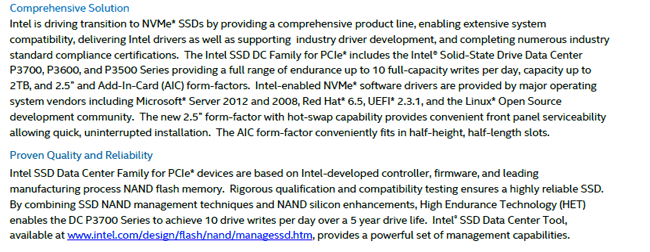
This is how Intel positions the Intel P3700 –
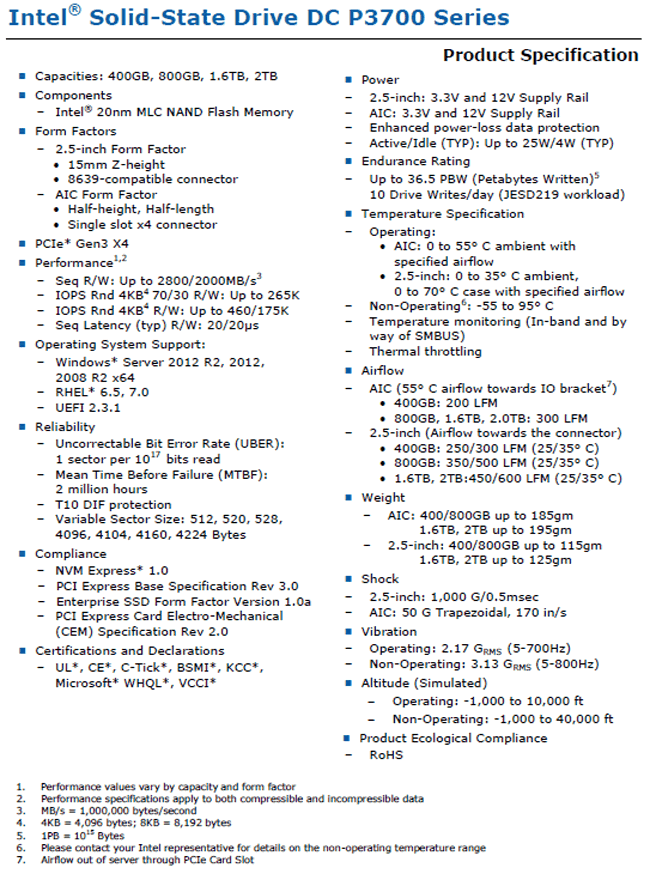
Specification
Here is Intel’s specification for the Intel P3700 series –
NVMe
Here is a brief introduction to NVMe, taken from the NVMe
organisation’s website –

The NVM Express specification, developed
cooperatively by more than 80 companies from across the industry, was released
on March 1, 2011, by the NVMHCI Work Group (commonly referred to as the NVM
Express Work Group). The NVM Express 1.0 specification defines an optimized
register interface, command set and feature set for PCI Express®
(PCIe®) Solid-State Drives (SSDs). The NVM Express 1.1 specification
was released on October 11, 2012 adding additional Enterprise and Client
capabilities. The goal is to deliver the full performance capabilities of
current and next generation non-volatile memory, supporting at least a 10 year
life of the interface, while standardizing the PCIe SSD interface to enable
broad ecosystem support.
The significant advances in performance
enabled by non-volatile memory-based storage technology, as embodied in
PCIe-based SSDs, has demanded the surrounding platform infrastructure evolve to
keep pace, to realize the full potential of these devices. A primary goal of
NVM Express is to provide a scalable interface that unlocks the potential of
PCIe-based SSDs now and at least a decade into the future. The interface
efficiently supports multi-core architectures, ensuring thread(s) may run on
each core with their own SSD queue and interrupt without any locks required.
For Enterprise class solutions, there is support for end-to-end data
protection, security and encryption capabilities, as well as robust error
reporting and management capabilities.
The NVM Express Work Group is directed by a
multi-member Promoter Group of companies that includes Cisco, Dell, EMC, HGST,
Intel, LSI, Micron, NetApp, Oracle, PMC-Sierra, Samsung, SanDisk and Seagate.
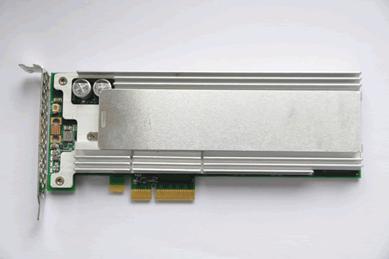
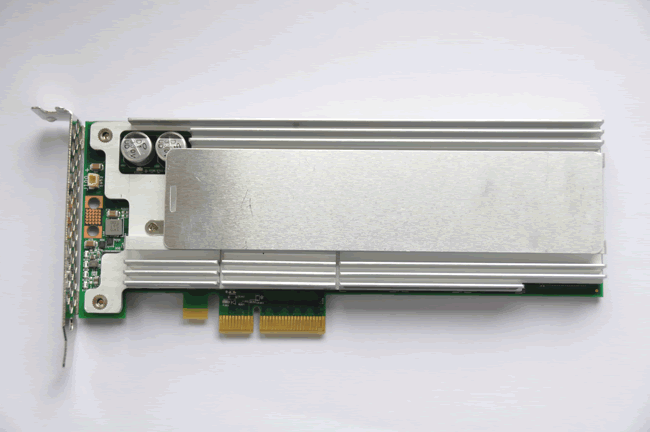
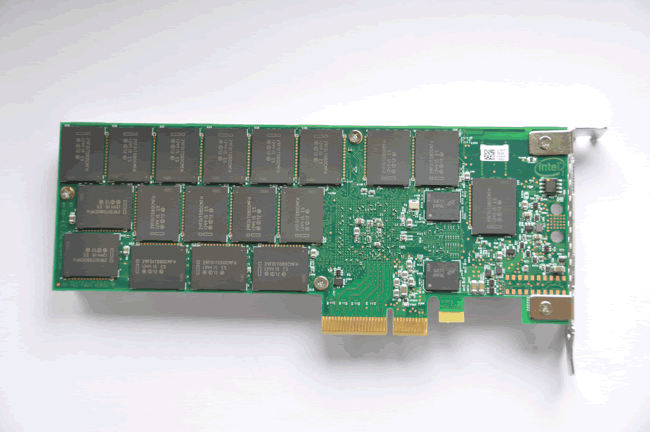
Product Image
Here are some pictures of the Intel P3700 1.6TB we tested –
Now let's head to the next page, to look at Myce’s
Enterprise Testing Methodology.....
Please click
here
to view or download a detailed introduction to Myce’s Enterprise Class Solid
State Storage (‘SSS’) Testing Methodology as a PDF.
Put briefly:
All testing is performed on an OakGate Technology test unit
We perform two sets of Performance Tests:
- A full set of the mandatory Storage Network Industry
Association’s (‘SNIA’) tests as specified in their Solid State Storage
Performance Test Specification Enterprise V1.0 – SNIA
SSS PTS Version 1.0. - A set of tests, known as the ‘Myce/OakGate Full
Characterisation Test Set’, that provides readers with a fuller
characterisation of the solution.
We also review other important factors such as Power
Consumption, Data Reliability and Failover features.
A word about SNIA testing – before striking a partnership
with OakGate Technology I spent some time researching how I might implement
SNIA testing using freely available tools such as IOMeter and FIO. I arrived
at the conclusion that whilst it was theoretically possible it was
impractical. The reason for this is as without the automation offered by a
test bench, such as the OakGate Unit, the only way to meet the SSS PTS requirements
is to run the maximum number of test cycles and then to manually look back at
the results to determine when/if steady state has been achieved in the workload
specific test cycle, and then harvest the data from the qualifying Measurement
Window. This means that the test runs would always take a maximum elapsed time,
and there would be a great deal of human effort required to review, gather, and
report upon the data. I empathise with, acknowledge, and respect the efforts
of other reviewers who endeavour to meet the SNIA’s principles in their testing
- I am privileged and thankful to be able to use a superb test bench which
automates the whole process and allows me to meet the SNIA’s specification in
full.
Before we move on, let’s remind ourselves of some basics –
When reviewing the performance of an SSS solution there are
three basic metrics that we look at:
1. IOPS – the number of
Input/Output Operations per Second
2. Bandwidth – the number of
bytes transferred per second (usually measured in Megabytes per second, ‘MB/s’)
3. Latency – the amount of time
each IO request will take to complete (usually, in the context of SSS
solutions, measured in Microseconds, which are millionths of a second).
It is true to say that IOPS and Bandwidth had all been
growing rapidly before the advent of SSS solutions, but Latency can only be significantly
decreased by eliminating mechanical devices, and thus Latency is the single
most important aspect that SSS solutions deliver to enhance performance.
Latency in a technical environment is synonymous with delay.
In the context of an SSS solution it is the amount of time between an IO
request being made, and when the request is serviced.
Bandwidth, also commonly referred to as ‘Throughput’, is the
amount of data that can be transferred from a storage device to a host, in a
given amount of time. In the context of SSS solutions it is typically measured
in Megabytes per second (MB/s).
A great enterprise SSS solution
offers an effective balance of all three metrics. High IOPS and Bandwidth is
simply not enough if Latency (the delay in an IO operation) is too high. As we
will see in the test results presented below, as Latency increases IOPS will
inevitably decrease.
Queue Depth is the average amount
of IO requests outstanding. If you are running an application and the Average
Queue Depth is one or higher and CPU utilisation is low, then the application’s
performance is most probably suffering from a ‘Storage Bottleneck’.
Another important factor to
remember is that SSS performance is influenced by previous workloads, not just
the current workload, and especially by what has previously been written to the
drive. As specified in the SNIA SSS PTS the goal of all good Enterprise level
testing is to provide consistent circumstances, so that results can be compared
fairly across different SSS solutions – it is for this reason that all of our
tests start with a purge of the drive, so that it starts in a ‘Fresh Out of the
Box’ (FOB) state. Most tests then have a pre-conditioning phase where the drive
is put into a ‘Steady State’ before the test phase begins. Put briefly, a
‘Steady State’ is achieved when the performance of the drive no longer varies
over time and settles into a consistent level of performance for the workload
in hand. You can find a detailed explanation of ‘Steady State’ and how it is
determined in the SNIA tests in our Enterprise Testing Methodology paper, which
can be viewed or downloaded as a PDF by clicking here.
For interest, here are some
generally accepted assumptions that differentiate the use and therefore the
approach to testing Enterprise/Server and Consumer/Client SSS solutions:
Enterprise/Server SSS
assumptions:
- The drive is always full
- The drive is being accessed 100% of the time (i.e. the
drive gets no idle time) - Failure is catastrophic for many users
- The Enterprise market chooses SSS solutions based on their
performance in steady state, and that steady state, full, and worst case
are not the same thing
Consumer/Client SSS
assumptions:
- The drive typically has less than 50% of its user space
occupied - The drive is accessed around 8 hours per day, 5 days per
week, and typically data is written far less frequently - Failure is catastrophic for a single user
- The consumer/client market generally chooses SSS solutions
based on their performance in the FOB state
Esther
Spanjer, Director, Enterprise Business Development EMEA at Sandisk, said, 'I am
happy to commend Myce for their high level of professionalism and cooperation
during the review process', Ms. Spanjer added, 'I wish them every success in
their partnership with OakGate Technology and their initiative to provide
authoritative performance reviews for the Enterprise Solid State Storage market'
Now let's head to the next page, to look at the results
of our SNIA IOPS (Input/Output Operations per Second) Test.....
IOPS performance will typically
vary greatly depending on the nature of the IO traffic, including the mixture
of Read and Write operations, and the mixture of Block Sizes (the size of the
IO operation’s data packet, also referred to as IO Size). This test is designed
to benchmark the IOPS performance profile for random IO operations for 56
different combinations of Read/Write mix % and Block Sizes when in a Steady
State, which are of interest to most users.
All of the SNIA’s test
specifications define a ‘required’ set of parameters that must be run for the
test and then allow the operator to elect to run additional tests with
different parameters of their choice. It is the mandatory test with the
required parameters that we run. Note that all of the mandatory tests must be
conducted with fully random data
As previously mentioned, a key
principle of SNIA testing is to provide a consistent basis for comparing
different solutions from different manufacturers.
To provide a consistent
basis for comparison with other drives we have tested we have run
the SNIA tests at a queue depth of 32. This is why we don't see the
performance levels as specified by Intel.
Here are the results -

You can see here a visual confirmation that Steady State
Convergence was determined at the end of Round 6.
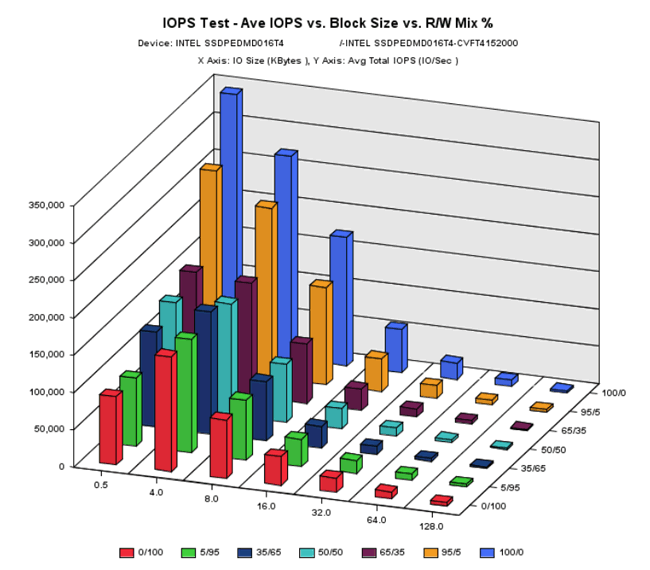

Here is a 3D and tabular presentation of the results. Users
can simply refer to the grid to obtain the R/W mix and Block Size value of
interest. For example, Online Transaction Processing applications
typically run at a Block Size of 8K and a Read/Write Mix of 65/35, and users
can quickly understand how the device might perform under Steady State for
these access characteristics.
You can see that the 4K 100% Read IOPS result is 271,930 and
that the 4K 100% Write IOPS result is a simply outstanding 154,414. These
results are simply awesome and are several orders of magnitude greater than for
anything we have reviewed before.
Product Comparison
For interest we present a comparison of the 4K 100% Writes
and Reads results with those of the other Enterprise SSDs we have tested -
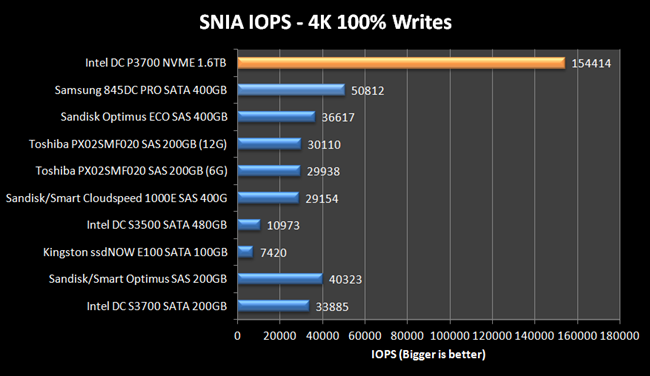

Simply awesome!
Now let's head to the next page, where we look at the
results of the SNIA Write Saturation Test.....
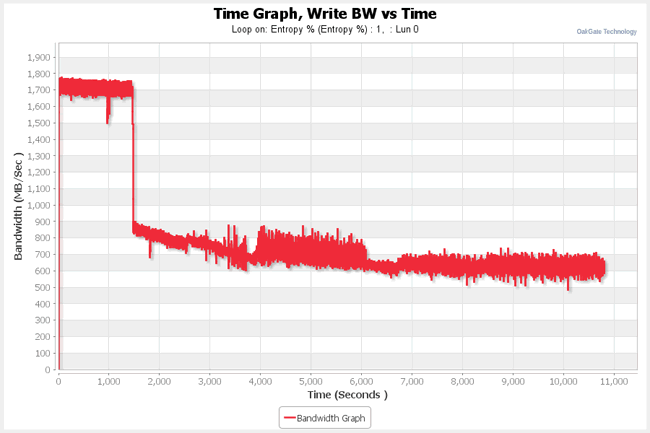
The objective of this test is
to observe the time evolution of the drive’s performance, as a function of
time, from a ‘factory fresh’, ‘fresh out of the box’ (‘FOB’) state. When a
drive is in a FOB state (e.g. after it has been purged by, for example by a
SATA Secure Erase or SCSI Format), we can expect an initial period of time when
writes can easily be accommodated by clean/empty blocks, but once all of the clean
blocks have been written to once and the drive’s controller must first clean
blocks (with erase write operations) before it can write new data, then we can
expect a slow down. The slow-down is usually quite dramatic and is commonly
referred to as the ‘write cliff’.
The Write Saturation Test is
easy to run as it requires no steady state determination – it can be easily run
in freely available software, such as IOMeter.
Here are the results -

You can see here a significant drop in Write IOPS
performance as the Intel P3700 reaches a Steady State. The fall, that begins at
around Round 23, occurs when all of the available NAND has been written to once
and the drive must clean blocks on the fly, in preparation for accommodating
further writes – this is commonly referred to as the ‘Write Cliff’.
Note that the test was halted, as specified in the SNIA SSS
PTS, when 4 x the User Capacity had been written to the drive.
You can see that the Intel P3700 is settling into a steady
state at just over 150,000 IOPS, which is stunning.

You can also see that the latency graph line is a mirror
image of the IOPS graph line.
Now let's head to the next page, to look at the SNIA
Throughput Test.....
The test is designed to measure the sequential Read and
Write IO performance for two IO Sizes, when under Steady State conditions. One
can easily compare the results produced by this test with box-top numbers,
which are usually stated as “Up to xxx MB/S”.
Please note that this test was run with IO sizes of 8K and
128K (as 128K is the largest IO size supported by the Intel P3700).
Here are the results -
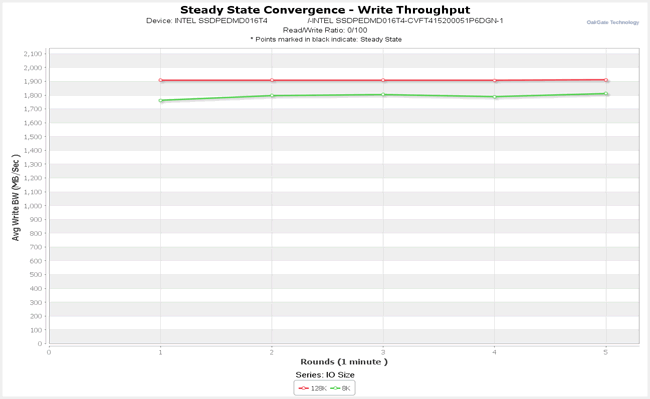
You can see here that Steady State was achieved for both
Write IO sizes by the end of Round 5.
-
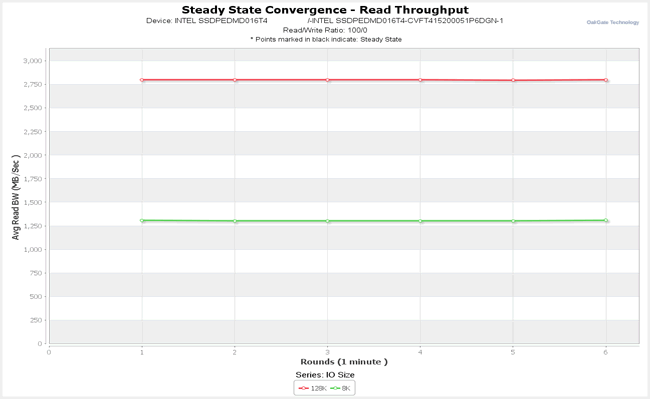
You can see here that Steady State for both Read IO sizes
was achieved by the end of Round 6.
Here are the average values recorded in the measurement
window –
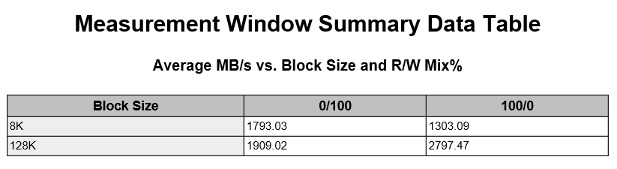
Again, simply awesome results.
Product Comparison
For interest we present a comparison of the sequential reads
and writes performance in comparison with those of the other Enterprise SSDs we
have tested -
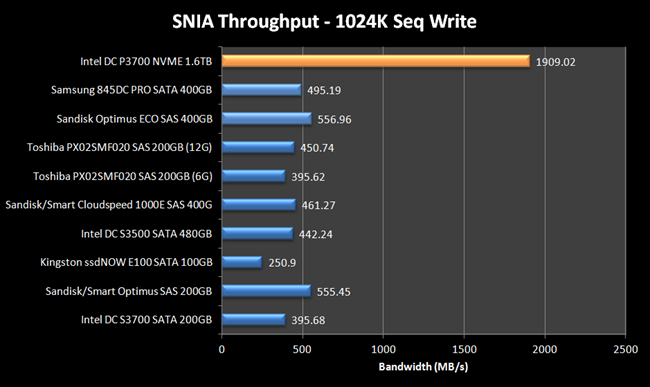
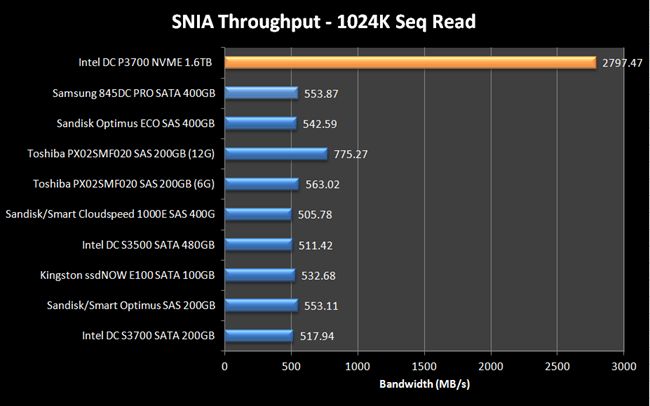
Please note that the Intel P3700’s results are for an IO
size of 128K (as 128K is the largest IO Size it supports). All other the other
drives’ results are for an IO Size of 1024K, which is typically the block size
with which an SSD will achieve its highest level of throughput.
Simply awesome results, again!
Now let's head to the next page, to look at the results
of the SNIA Latency Test.....
The Latency Test measures average and maximum response times
using random IOs at specified Block Sizes and Read/Write mixes, taken under
steady state conditions. The test runs at a Queue Depth of 1 (1 outstanding
IO), thus the results give the baseline response time for a single IO request.
The test also reports maximum latency values, which can be
helpful to see if there might be processes within the drive that may cause max
Latency values to become larger.
Here are the results -
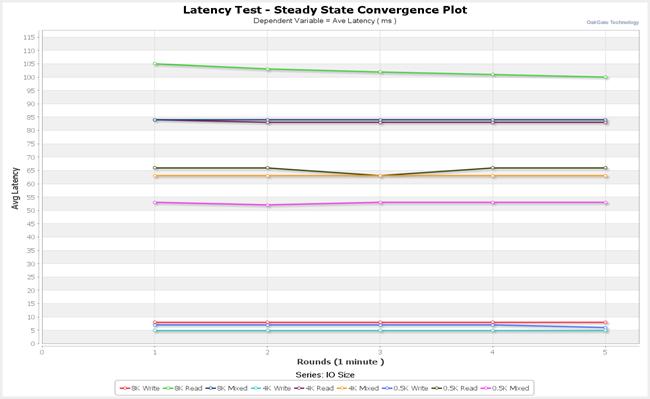
You can see here that Steady State Convergence was achieved
at the end of Round 5.
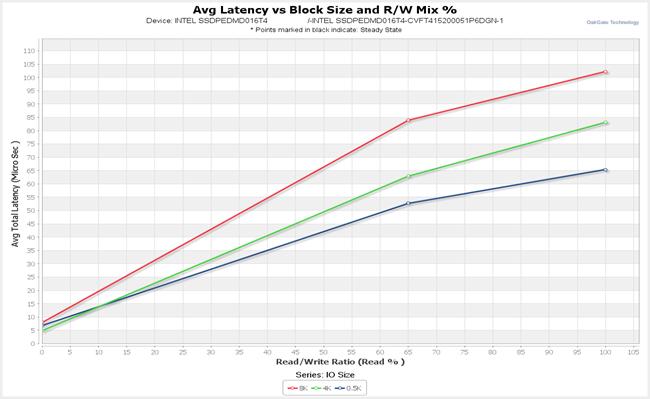
These are the Average Latency Values observed in the
Measurement Window.
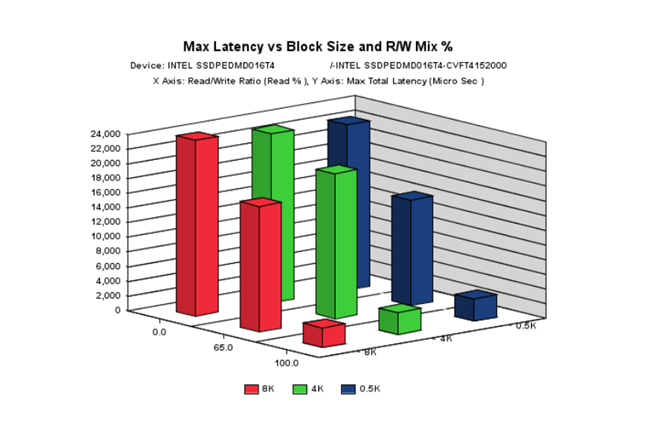
Here is a 3D graph showing, at a glance, the Maximum Latency
values for each combination of Read/Write Mix and IO Size.
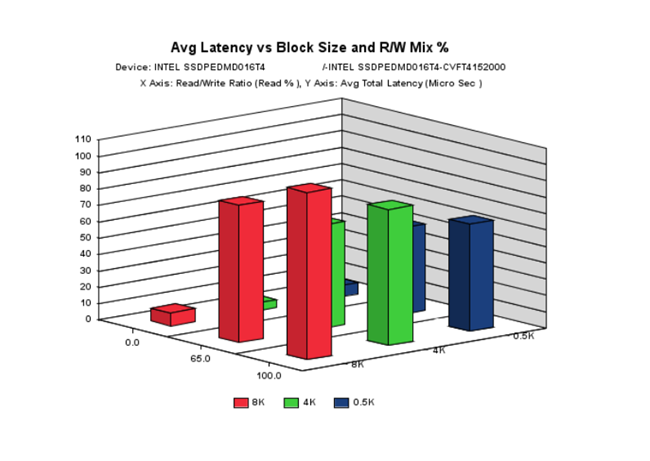
Here is a 3D graph showing, at a glance, the Average Latency
values for each combination of Read/Write Mix and IO Size. These are awesome
results!
Product Comparison
For interest we present a comparison of the 4K 65% Reads 35%
Writes latency results in comparison with those of the other Enterprise SSDs we
have tested -

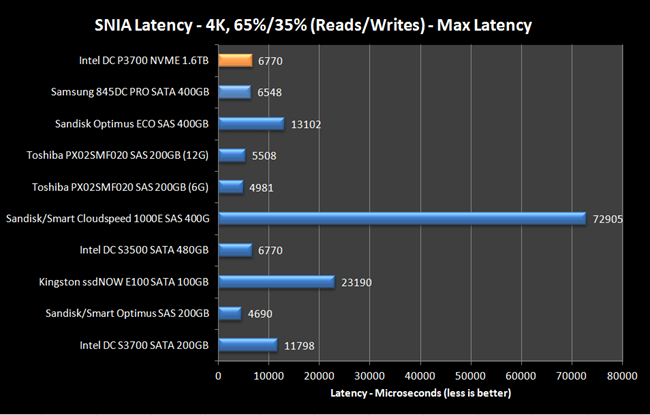
Please note that the performance of the Intel P3700 has
caused us to change these comparison charts to report in Microseconds (as
opposed to Milliseconds). We have also taken the opportunity to change the
results to the average of those seen in the Measurement window (i.e. as
presented in the graphs).
Now let's head to the next page, to look at the results
for the Myce/OakGate 4K Read and Write Latency Tests......
These tests steadily increase the random 4K IO demand in
terms of IOPS, and report the drive's response in terms of Average IOPS, Average
Latency and Maximum Latency. It is designed to show a drive’s maximum IOPS
capability and report the all important Latency numbers for each level of IOPS
demanded. The Maximum latency numbers give us an insight into the occurrence
of Latency peaks that could cause an unexpected response from time to time.
Here are the results –
Please note that this test was run at a queue depth of 32
and this is why Intel's specified IOPS performance level is not being
achieved. When run at a queue depth of 64 the drive exceeds Intel's specs!
Please see my upcoming review of the DC P3700 800GB
Firstly, here is a graph showing the result for the initial
Pre-Conditioning step (4K Random Writes) –
4K Latency Read Test
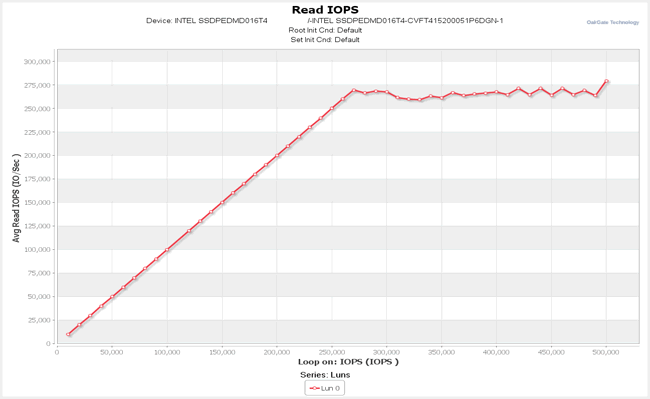
Please note that we have changed the normal scale that we
use here so that results are recorded for increments of 10,000 IOPS (We
normally record in increments of 1,000 IOPS but this was considered impractical
for a drive that can exceed a level of 250,000 IOPS)
You can see that the drive can no longer meet the increase
in IOPS demand at around 270,000 IOPS.
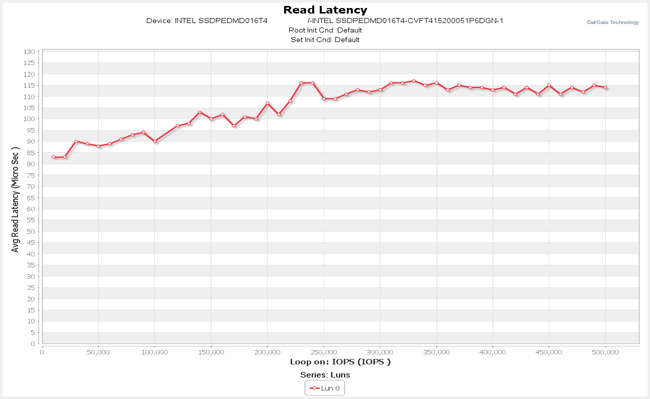
You can see a gradual increase in read latency up to the
maximum IOPS mark. The Read Latency results are excellent.
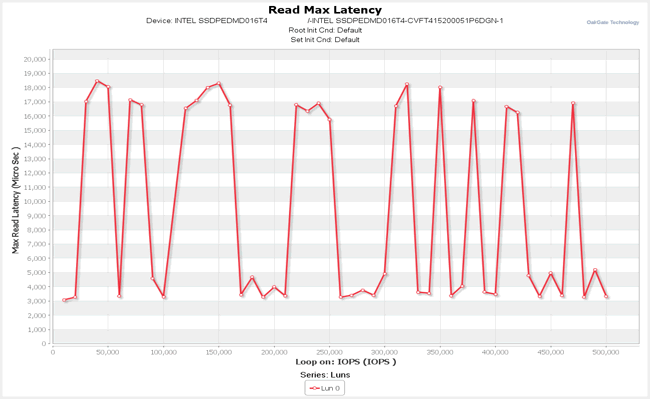
You can see that there are some max latency spikes.
Let’s have a close look at the distribution of the Latency
results at the 150,000 IOPS level (at one of the spikes) –
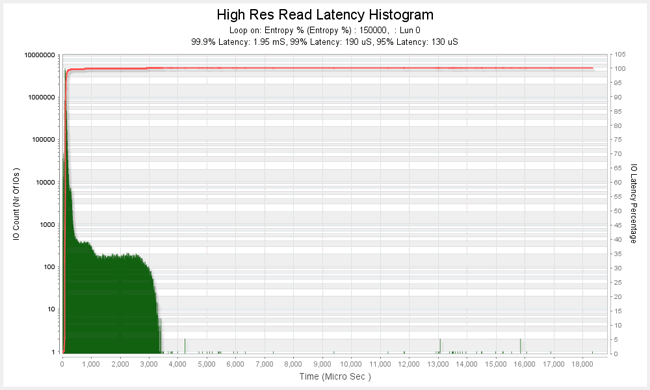
As this is the first time in this review, that we are
looking at a High Resolution Latency Histogram, here’s an explanation – The X
axis to the left is the count of the IOs in the observation period (in a Round)
that had a Latency of the value along the Y axis (please note that the X axis
is logarithmic to allow the low order counts of the huge number of IOs that
have been measured to be visible); the Y axis is the Latency value measured in
Microseconds; The X axis to the right is the % of the Total IOs observed that
have a Latency <= to a given Latency value; the rate of getting to 100% is
highlighted by the red graph line.
You can see that 99% of the Latency values are <= 190 Microseconds
and there are relatively few outliers, so the quality of service is excellent.
4K Latency Write Test
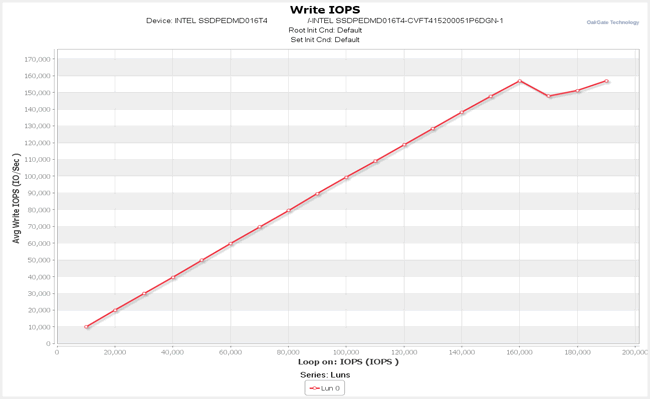
You can see here that the Intel P3700 starts failing to meet
the increase in IOPS demand at just above 150,000. An awesome result!

Here we can see that Average Write Latency stays below 30 microseconds
until a demand of 140,000 IOPS. Another awesome result!
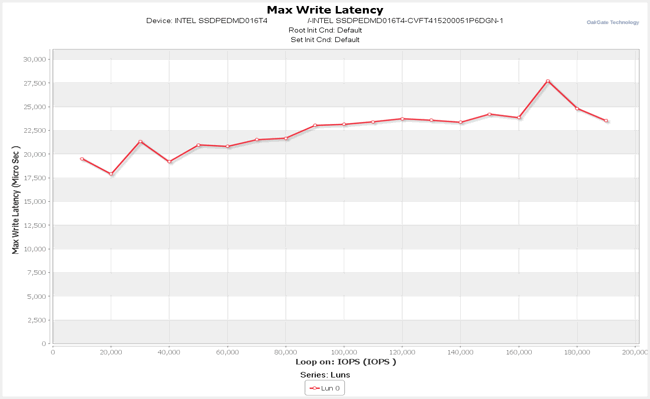
The maximum write latency results are relatively high
(perhaps this is something Intel should take a closer look at :o) ).
So let’s have a look at the distribution of the Max Latency
Values at the 140,000 IOPS Mark –
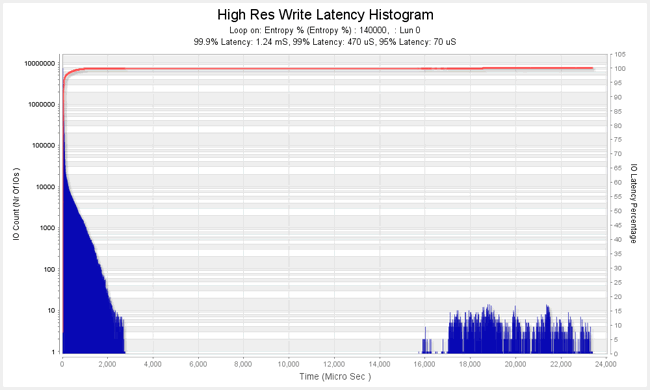
You can see that 95% of the Latency Values are <= 70
microseconds. This is an excellent result.
Now let's head to the next page, to look at the results
for the Myce/Oakgate Reads and Writes Tests.....
The tests are designed to show the Random and Sequential,
Read and Write, performance metrics for different combinations of Queue Depth
and IO size.
As the Intel P3700 is clearly an awesome performer we have
run these tests up to a queue depth of 128 (rather than the normal of 32).


")


