 |
Review: Kingston |
|
|
Kingston is a manufacturer that doesn’t
need any introductions. I am sure that almost everyone at one point has had
something that was manufactured by Kingston, a USB drive, a flash card for your
digital camera, or some RAM for your PC. In the last few years Kingston has entered
the SSD market and their latest product is the HyperX 3K series. The Kingston
HyperX 3K SSD is based on the SandForce SF-2281 and has MLC NAND (3k P/E
Cycles). The 3K NAND that the HyperX 3K is using can handle 3000 programmable
erase cycles, and the DuraClassTM
technology will maximize the life of the NAND.
Kingston was kind enough to send me their
latest SSD for review. The HyperX 3K is Kingston’s latest SSD and it’s driven
by the SandForce Controller, alongside Intel’s latest 3K NAND. The HyperX 3K
series can be found in 90GB/120GB/240GB and 480GB capacities, depending on your
needs, and it offers sequential read and write speeds up to +500MB/Sec. In this
review I will be taking a closer look at the Kingston HyperX 3K 240GB SSD.
Kingston has four product lines when it
comes to SSDs and you can find out more about them here.
Kingston company information
In 1987, Kingston® entered the market with a single product.
Founders John Tu and David Sun addressed a severe shortage of surface-mount
memory chips with a memory module that would serve to redefine industry
standards for years to come. You can read the full
history of Kingston by clicking here.
The Kingston HyperX 240GB SSD
Time to take a closer look at the package
and what comes shipped with.
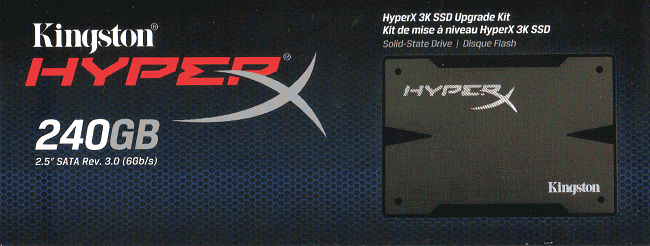
Packaging
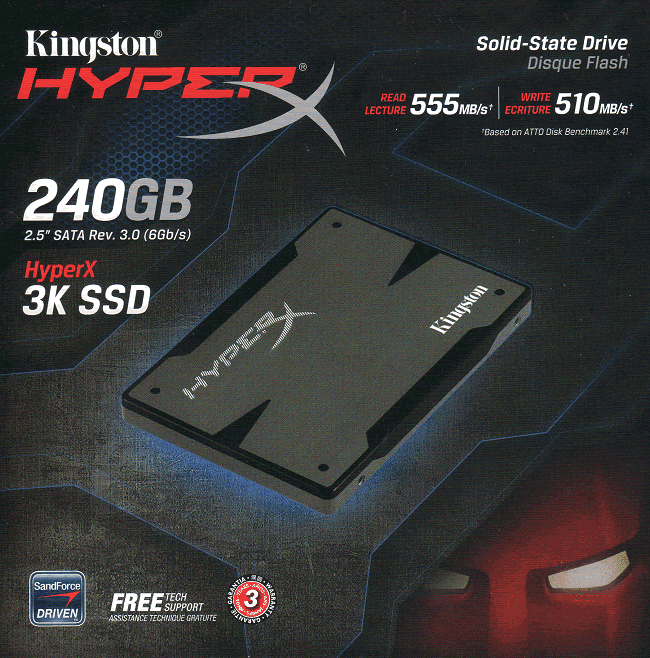
Box front

Box rear
Box
top
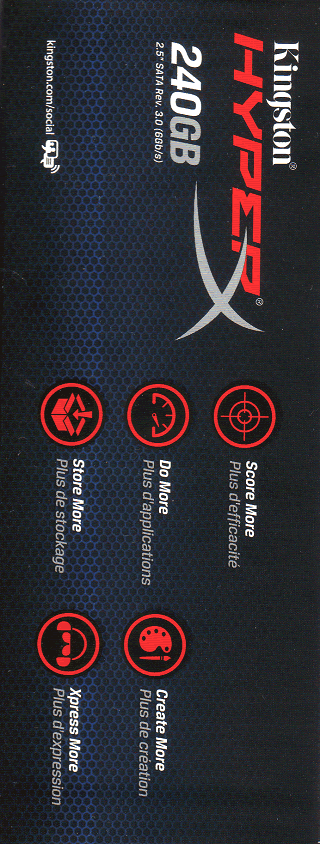

Box
left and right
Inside the box
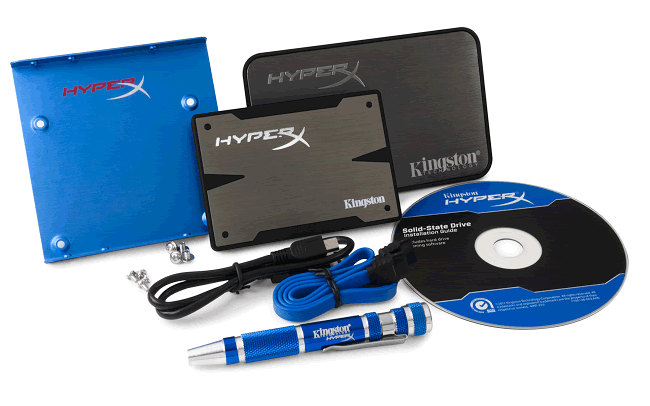
The package contained the HyperX 3K SSD, two
packs of fixing screws, a 3.5 inch to 2.5 inch converter bracket, a bootable CD-ROM
containing the Acronis True Image software and an instruction manual. You will
also find an SATA cable and a USB cable for the included external enclosure,
and a screw driver.
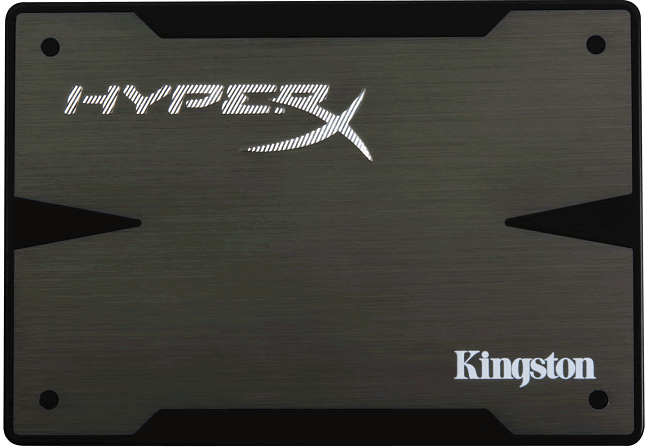
The Kingston HyperX 3k SSD
Not much to say about the looks of the
HyperX 3K SSD, the picture shows everything. The drive is built with an aluminium
case, and it’s by far the best looking SSD that you can buy.
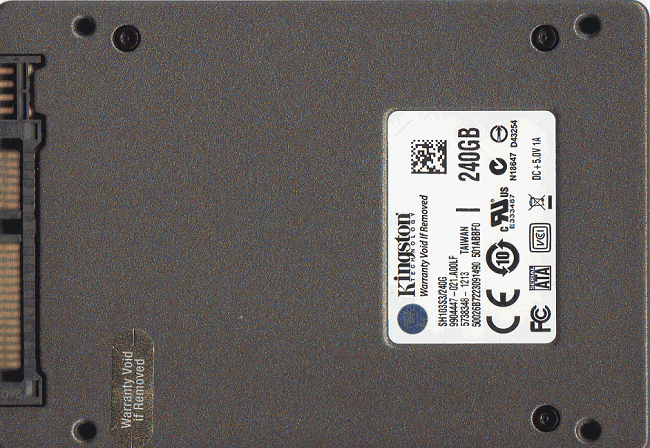
Drive underside
The underside of the drive has the SATA
power and data connectors, a sticker that has all the info that is needed such
as the serial number and model of the drive, and finally the four mounting
holes to mount the drive on the 3.5” bracket.
Specifications
The following specifications can be found at
Kingston's website.
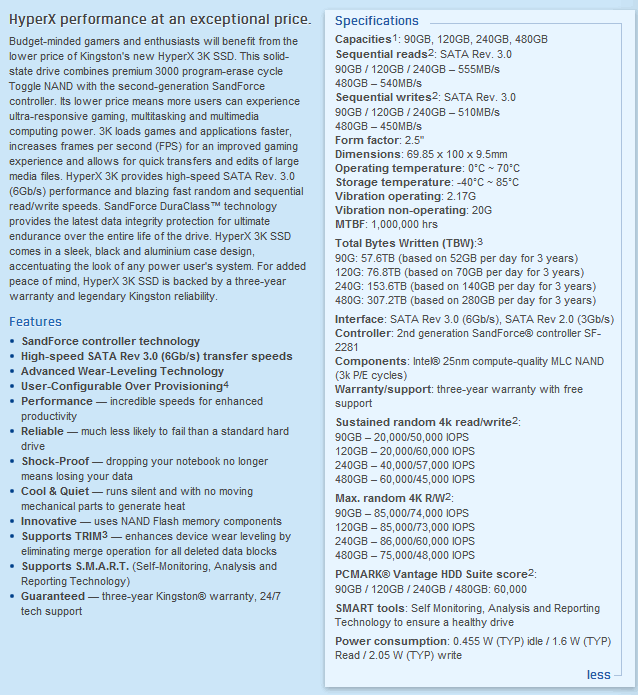
From the above picture we can take a more
detailed view of the Kingston HyperX 3K SSD. The HyperX 3K 240GB SSD has a read
speed up to 555mb/sec and a write speed up to 510mb/sec. The drive has a three
year warranty, and 24/7 free tech support from Kingston.
CrystalDIskInfo
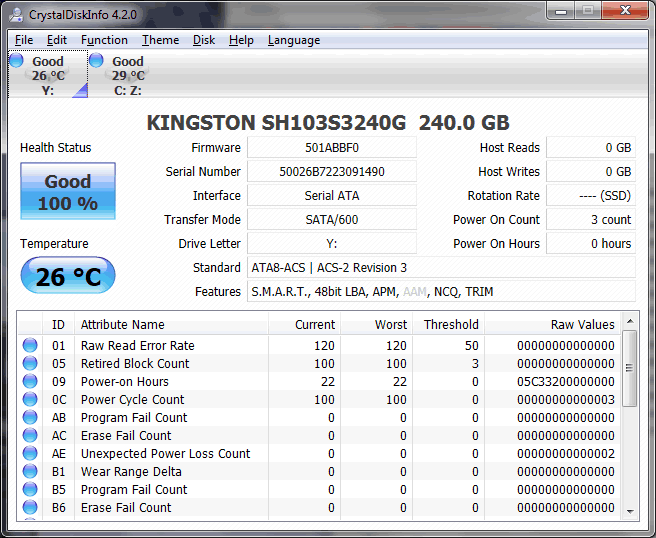
Above
we can see some more info about the Kingston HyperX 3K SSD.
Let’s head to the next page where we
take a look at our testing methods and the review PC.
Test machine
For this review I will be using a computer
with the following configuration:
Hardware:
- Motherboard: AsRock Z68 Extreme 4 (Intel Z68
chipset) - Processor: Intel 2nd generation
Core i5 2500K - RAM: 8GB Kingston Hyper X DDR3 1600MHz (dual channel)
- GFX: Onboard Intel HD 3000
- Sound: Onboard Realtek ALC889 HD audio
controller - Hard disk OS: Western Digital Black 1TB
- PSU: Corsair CX430 430W
- Display: Futsiju Siemens 22”
- Operating System: Windows 7 Ultimate 64bit with
Service Pack 1
The Kingston HyperX 3K SSD was connected to
the Intel native SATA 6Gbps (port 0) on the Z68 motherboard of our review PC
and all tests on the drive were carried out with the drive connected to this port.
AHCI mode was also selected for all drives
in the UEFI of our test PC, and all tests were carried out in this mode.

The SATA 6Gbps drivers used on our review
PC were the Intel Rapid Storage Technology (RST) Version 10.6.0.1002.
Test applications
To test the performance of the Kingston
HyperX 3K 240GB SSD, I will be using the following test applications in this
review.
- HD Tune
Pro - ATTO
- Iometer
- AS SSD
Benchmark - CrystalDiskMark
- Anvil’s
Storage Utilities
Test procedures
I will start off our testing procedures
explanation by stating that I did not run many synthetic benchmarks on the Kingston
HyperX 3K SSD. You may ask why I have run so few synthetic benchmarks?
SSD technology has moved so fast in the
last couple of years, that basic synthetic benchmarks alone are now of very
limited use, as they don't really tell us much about performance and how the
drive will behave in the real world. I have therefore decided to show some
basic benchmarks for the Kingston HyperX 3K SSD, and will complement this with
advanced benchmarks using IOMeter and AS SSD benchmark. I will also show how
the Kingstone HyperX 3K SSD performs in the real world.
The reality of SSD performance
While I can easily show you which SSD is
technically the faster, when you use one of these modern SSDs as an operating
system drive it becomes very difficult to tell them apart as far as performance
is concerned.
A typical use of a small capacity SSD at
the moment is to have your operating system and applications installed onto the
SSD. The performance difference compared to a traditional HDD is enormous,
however when you start to compare SSD to SSD the difference becomes almost
impossible to detect.
Let’s look at why this is the case.
Drive A can boot to the desktop in 8.11
seconds, and drive B can boot to the desktop in 8.12 seconds, the difference in
time is milliseconds, and can one really tell the difference?
The fact is, all modern SSDs are only
ticking over when they are only running the OS and launching applications, it’s
only when you get to some of the larger capacity SSDs, with enough free space
to be able to hold the actual data that you’re going to be working with, be
that video, audio or pictures, for example, that you actually get a tangible
difference in performance. This is where the SSDs with the better sequential
performance start to pull well ahead of the SSDs which have lower sequential
read/write performance.
Small file random IOPS vs sequential performance
IOPS
This is a fairly complex subject, but I
will do my best to explain things in a manner that is easy to understand.
The term IOPS is the amount of input or
output transactions that can take place in a one second interval, so for
example, if an SSD is quoted as being able to cope with 20,000 4K random write
IOPS, then the SSD should be able to cope with 20,000 input transactions in a
period of one second. If the same SSD is said to be able to produce 20,000 4K
random read IOPS, then the same SSD should be able to produce 20,000 4K random
read output transactions in a one second interval.
Ok, now we have some figures to work with,
the next question is how many IOPS are actually required?
This will depend on your usage pattern. If
you are a typical desktop user who browses the internet, does some word
processing or perhaps some audio or video editing, and perhaps plays a few
games, then in actual fact, you don’t need to have massive 4K random read/write
performance. The actual amount of 4K random performance that is required for a
fast and smooth running system for a desktop user with a usage pattern similar
to the above will be well under 1,000 4K IOPS.
On the other hand, if the SSD is being used
for running a large and complex database server, then 4K random performance is
the absolute measurement of how fast that server will run, as this type of
application does most of its input and output transactions in the 4K domain.
So why would I need an SSD with 80,000 4K
IOPS for a desktop?
In fact you don’t need this type of
performance for a desktop, but an SSD which is capable of coping with 80,000 4K
IOPS will be faster than an SSD which can only cope with 20,000 4K IOPS.
OK, I just said if under 1,000 4K IOPS are
actually required for typical desktop usage, why is an SSD with 80,000 4K IOPS
faster than an SSD with only 20,000 4K IOPS, confused?
You may ask, if I only require 1,000 4K
IOPS surely the rest is wasted?
While you may never need 80,000 4K IOPS,
IOPS is all about latency. The reason that an SSD can cope with as much as 80,000
4K IOPS is because latency in this domain is very low. With 4K files, even if
you require to process 500 of them at the same time, you are not talking about
a huge amount of data, it has far more to do with how long it takes the SSD to
process a single file, and the amount of time required to process a single 4K
is all about how long it takes for the SSD to access or store that data before
it can move on to the next transaction.
In other words an SSD with 80,000 4K IOPS
performance will handle those 500 files faster than the SSD with 20,000 IOPS.
So how will a desktop user even notice this
faster speed if so little 4K random IOPS and data are actually used?
Multitasking is a good example. The more
tasks you run at the same time, you more you will notice the speed difference.
Sequential performance
I have always maintained that sequential
performance was every bit as important as small random file performance for a
desktop SSD. Some highly regarded people on other sites found this statement
quite funny a couple of years ago when I made it, but my, how times have
changed in the world of SSD reviewing.
To me this was always so obvious for a
desktop user. For example, let’s say you want to launch an application or game.
Both have some fairly large files to load, and also a great many small files,
but the point is, even the smaller files are sequential in nature. Now let’s
say you’re into audio or video editing. Video files tend to be huge, and the
files are written or read sequentially. Isn’t this how many users are using
their PCs these days?
Summary
So how does this shape up in the real
world? Which is better, massive 4K IOPS or massive sequential performance?
In an ideal world you want both, as an SSD
with massive random 4K IOPS and sequential performance will always be faster
than an SSD that has high sequential performance and moderate 4K random IOPS
performance, and the same applies to an SSD that has massive 4K random
performance and moderate sequential performance. The SSD which has high
performance in both patterns will always be the faster SSD.
However, you can still have an SSD that is
very fast for desktop use that has moderate random 4K performance and massive
sequential performance, the same can be said about a drive having massive
random 4K performance and moderate sequential performance, as it is about
getting the balance right if you have to compromise on one or the other.
Test drives
- 120GB OCZ Vertex SSD (firmware 1.5)
SSD - 500GB Samsung SpinPoint F3 (HD502HJ) HDD
- Seagate Momentus XT 500GB (Hybrid
drive) - OCZ Agility 120GB (firmware 1.5) SSD
- Intel X25-M 80GB (series G1) SSD
- OCZ Vertex 2 100GB SSD
- Plextor PX-256M2S SSD
- Crucial RealSSD C300 128GB SSD
- OCZ Vertex 3 240GB SSD
- Intel 510 series 120GB SSD
- Crucial M4 256GB SSD
- OCZ Octane 512GB SSD
- Intel 520 series 240GB SSD
Drive preparation for running the tests
All the SSDs used in this article were in a
clean and fresh state when the testing period started. From then on, each drive
had to rely on its own NAND cleaning effectiveness for the remainder of the
tests.
- Both our spinning HDD drives were
defragged before the start of each test.
- All SSD and HDD used in this article had
their partitions aligned to the Windows 7 x64 defaults.
Where I use graphs in this article to
display results, I will use the following colours to make it easier, for our
readers to see which drive we are reviewing.
![]() Kingston
Kingston
HyperX 3K 240GB SSD
![]() Comparison
Comparison
SSD
![]() Comparison
Comparison
HDD
Now let's head to the next page, where I
look at some basic benchmarks...
Reading Benchmarks
HD Tune

HD Tune – Sequential reading test
I present the graph below for comparison
with other recently tested drives.

The performance of the Kingston HyperX 3K
is very impressive. It averages a read speed of 491.5 MB/Sec and it’s among the
fastest drives that MyCE has tested.
ATTO disk benchmark
ATTO has become a standard tool for
measuring the data throughput of HDD and SSD. It measures the performance of
reading and writing, using different file sizes and block sizes.

As we can see ATTO verifies the numbers
that Kingston reports for the HyperX 3k SSD, the top read speed was close to
550MB/Sec, but the write performance on sequential write was even more
impressive and the HyperX 3k SSD managed to get close to 520MB/Sec. Overall
the result is outstanding.
CrystalDiskMark 3.0
Crystal Disk Mark is quite a handy
benchmarking application, as it focuses on the file sizes that can cause a
problem on a system drive.

By default the CrystalDiskMark uses random
data, and you can therefore get a more realistic view on how the drive
performs. We can see that the Kingston HyperX 3K SSD shows excellent performance
for both read and write speeds.
AS SSD Benchmark
AS SSD benchmark is a benchmarking tool
specifically designed to test SSDs. The application tests sequential reading
and writing performance, 4K random reading and writing performance.
AS SSD benchmark also tests 4K threaded
performance. This is very exciting, as this test is the first available test
that I am aware of, that simulates how a PC operating system actually works. A
modern PC and OS, such as Windows Vista/7 does not just run a single thread at
a time, it runs many threads. The AS SSD benchmark "4K 64Thrd" tests
run 64 threads simultaneously throughout the test. If this result is good, then
you can be pretty sure the drive will perform extremely well as a system drive.
After the tests complete, AS SSD benchmark
derives a total score for the drive being tested. This is based on all aspects
of the test results, and gives an indication of how the drive is performing
overall.
Now let’s look at the result for the Kingston
HyperX 3K SSD in the form of a screenshot. All our other comparison drives’
results are presented in the form of a graph.


As we can see the Kingston HyperX 3K is
very close to the rest of the SandForce drives that MyCE has tested.
Summary:
The Kingston HyperX 3K SSD has very solid
performance in all our tests.
Let's head to the next page for our
IOMeter test results.....
I/O Performance
There is little point of having an SSD
drive that has blazing sustained reading and writing speeds, if the drive can't
handle reading and writing of small random files. If you intend to use your new
SSD drive to store and run your operating system, then the drive must be able
to cope with the many small random files that Windows will write to the drive
continually. So I feel it is very important to test how many of these random
files that a drive can handle in one second. I believe that anything over 1,000
I/O’s per second would be enough for most users running a consumer grade
mainstream PC, and should provide a smooth running system. But obviously, the
more I/O's that a drive can handle, the faster the drive will feel and leave
more headroom for those huge multitasking sessions that users sometimes engage
in.
The things that I will look at are the
total I/O per second and total MB/s.
Partition alignment and sector boundaries
Windows 7 and Vista will automatically
align a partition to 4k boundaries during partition creation, Windows XP won’t.
It is imperative that an SSD’s partition is aligned. Windows XP is also
restricted to sector boundaries, while Windows 7 will use 4k boundaries if it
can. The Intel 510 is 4k boundary aware, and will use these boundaries if
possible. Of course it will also remap LBAs for compatibility with the sector
boundaries so that the drive can be used with Windows XP.
IOMeter allows us to set the sector
boundaries for conducting the tests, and I have therefore set the sector
boundaries at 4K, which means the IOMeter tests are valid for Windows 7 and
Windows Vista users. XP users will not be able to obtain such results.
I will provide a screenshot of the tests on
the review drive for those of you who like to see the actual test result. All
the comparison drive results are represented in the form of graphs.
If any of you would like to see a
screenshot from any IOMeter test on a particular drive, please feel free to
request one, and I’ll post the screenshot in the forum thread.
All the IOMeter tests create a 10GB data
set on the target drive, and each test is run for a duration of 3 minutes.
IOMeter 4K random write test with repeating data.
The first test involves creating continual
4KB random files on the target drive with IOMeter. I use a 4KB file size, as it
is believed that Windows will create and modify many of this size of file constantly
in the background during a typical Windows session. It is said that most 4K
random writes take place at a queue depth of only one, and I have been requested
to include this test in my reviews.
Queue depth 1

Kingston HyperX 3K 240GB SSD – 4K random write (QD1)

The Kingston HyperX 3K SSD shows impressive
performance, topping out at 72.37 MB/Sec.
Our next test involves creating continual
4KB random files on the target drive with IOMeter. I use a 4KB file size, as it
is believed that Windows will create and modify many of this size of file
constantly in the background during a typical Windows session. I will use queue
depths of 4 and 32 for these tests.
Queue depth 4

Kingston HyperX 3K 240GB SSD (Queue depth 4)

The Kingston HyperX 3K SSD continues to
show high performance.
Queue depth 32

Kingston HyperX 3K 240GB SSD (Queue depth 32)

Again we can see the Kingston HyperX 3K SSD
refuses to leave the top of our chart, overall an excellent performance.
IOMeter 4K random read test.
If there are many 4k files created, then
that must also mean that many 4k files need to be read. This test measures 4k
reading performance.
It is said that most 4K random reads take
place at a queue depth of only one, and readers have requested that I include
this test in my reviews.
Queue depth 1

Kingston HyperX 3K 240GB SSD (Queue depth 1)

Again the Kingston HyperX 3K shows
impressive reading performance with maximum speed of 34.58 MB/Sec.
Queue depth 4

Kingston HyperX 3K 240GB SSD (Queue depth 4)

Another impressive result from the Kingston
HyperX 3K SSD.
Queue depth 32

Kingston HyperX 3K 240GB SSD (Queue depth 32)

The Kingston HyperX 3K SSD gives us an
impressive result of 201.86 MB/s.
IOMeter 512KB write test with repeating data.
Sequential writing performance is also very
important; in this test sequential writing performance is measured.

Kingston HyperX 3K 240GB SSD 512K Sequential write with repeating data

The Kingston HyperX 3K SSD finishes again
on top of our chart with an impressive 523.53MB/s.
IOMeter 512KB write test with fully random data.
This test is exactly the same as the test
above except that the test data is fully random in nature. This test was
requested as SandForce based SSDs gain a lot of performance by being able to
compress data on the fly. While the above test shows the SandForce based SSDs
in a best case scenario, the following test will show the SandForce based SSDs
in a more realistic light. In the real world, the data is neither 100%
incompressible nor 100% compressible, it is somewhere in between. So please
keep this in mind.

Kingston HyperX 3K 240GB SSD – 512K sequential write with fully random data

As we can see the Kingston HyperX 3K SSD gives
an excellent result with small uncompressed files.
IOMeter 512KB read test.
This test measures 512k sequential reading
performance.

Kingston HyperX 3K 240GB SSD – 512K sequential reading test

Another excellent result for the Kingston
HyperX 3K SSD.
IOMeter Workstation simulation (outstanding I/Os = 64).
When running applications you will find
that there is a mixture of small random files and larger sequential files,
being created and read. Not only that, it isn’t just one file at a time. In
this test I measure a simulated workstation pattern, with a queue depth of 64
(threaded).

Kingston HyperX 3K 240GB SSD – Workstation simulation

Once again the Kingston HyperX 3K SSD stays
close to the top.
Summary
Overall, the Kingston HyperX 3K SSD gave some
impressive results. In most of our tests the drive was either close to the top
or it was on the top. An outstanding performance from the HyperX 3K SSD.
Now let’s head to the next page where we
will look at how the Kingstone HyperX 3k SSD performs using a brand new
benchmarking application....
Anvil’s Storage Utilities
As well as performing SSD endurance tests.
Anvil’s Storage Utilities has a very nice SSD benchmarking application. The SSD
benchmark tests many different aspects of SSD performance, including 4K random
at different queue depths, and also sequential performance, but more importantly
than this, all using real test data.
Another very nice feature of Anvil’s SSD
benchmark is the fact that you can change the compression levels of the test
data. The compression levels of the data sets used for the tests can be varied
from 0% compression right up to 100% compressed data, and there are even a few
data profiles already included, such as database (8%) compression, and also an
application profile (46%) compression, which is designed to simulate real
application data being read and written to the SSD.
Anvil’s Storage Utilities is still in beta
at the moment, but the application is currently solid enough to use in this
article, and I have already verified the results obtained using an SATA analyser.
I will include a screenshot of the review
drive, and all comparison results will be presented in the form of graphs. If
you would like to see screenshots of the test results obtained on the other
SSDs in this article, you can do so by following the link here.
I will also be testing three different
compression profiles, which are as follows.
- 0 fill (100% compressible data)
- Application simulation profile (46%
compressed) - 100% (non compressible data)
So let’s begin the tests.
0 fill

Kingston HyperX 3K 240GB SSD (0 fill)

Total score

Writing score

Reading score
The overall performance with 100%
compressible data was excellent.
Application profile

Kingston HyperX 3K 240GB SSD (application profile)

Total score

Writing score

Reading score
The Kingston HyperX 3K SSD again delivers
an excellent result.
100% incompressible

Kingston HyperX 3K 240GB SSD (100% incompressible)

Total score

Writing score

Read score
The Kingston HyperX 3K SSD was again able
to show some very impressive results with uncompressible data.
Summary
The Kingston HyperX 3K SSD shows excellent
performance and in all three tests the drive is able to stay very close to the
top. This shows how well the firmware and hardware is designed.
Now let's head to the next page for some
real world tests....
It has become clear that simply conducting
endless benchmarks on SSD drives is pointless. Real users may run a few
benchmarks when they first fit their SSD drive, but most users just want a
drive that performs well in the real world. They want their drive to work
"out of the box" and work fast and smoothly.
Most of the latest SSD drives can deliver
very fast sustained reading and writing speeds, but these alone tell you very
little about how the drive will perform in the real world.
If you intend to use your SSD as your
primary system drive, with an operating system and applications installed and
running from the drive, real world performance becomes much more important than
just fast sequential read and write speeds.
Real
world copy tests
I will now conduct a few real world copy
tests. These tests simulate what real people do with their drives. I will be
conducting writing tests, using a large single file and a multiple file copy of
various file sizes. Then I will round off the tests by copying a folder of MP3
audio files, and also a folder of JPG pictures.
I should point out that this is not a scientific
way of measuring performance. These timings were taken with a stop watch; I
have however ensured that the reading drive is well able to supply a data
stream to our writing drive, which is high enough not to be slowing down the
performance of the writing drive.
I will once again be comparing the obtained
results with our comparison drives, and will present the results in the form of
graphs.
Copy Tests
These tests are to simulate a single drive
in a PC or laptop. In other words, I will copy a series of files from the
Crucial M4 256GB SSD to the tested drive.
Copy tests – 259 MP3 song files (1.36GB total)

The Kingston HyperX 3K SSD performed
excellently.
Copy tests – 3,377 JPEG picture files (2.56GB total)

In this test the Kingston HyperX 3K is slightly
slower, however the overall result is very good.
Windows start-up and closedown
For these tests, I simply used a stop watch
and tested the amount of time taken for a full installation of Windows 7 to
boot to the desktop, and then timed how long it took for Windows 7 to close
down by the normal start menu method. From now I will also be adding the time
what Windows logs on the even viewer for start-up and shutdown.
The timing was started once the BIOS had
initialised and reached the “loading OS message”.

Windows 7 boot time

Windows 7 closedown
The differences in start-up and shutdown
times are very small, and you probably notice any difference in real life. The
Kingston HyperX 3K SSD is the fastest SSD I have tested so far.
Since this is the first time that I ran this
test, I will simply post the screenshots that were taken directly from the
event viewer.

The
first boot

First
shutdown
The next two screen shots were taken after I'd
installed almost all the software that I use every day. Below are the results.

Used
state boot time

Used
state shutdown time
As it was expected, start-up and shutdown
times increase as you install more software on your SSD, however because of the
extremely low access times you can’t feel or measure the difference with a stop
watch.
Installing applications
Installing applications is possibly
something you don't do that often. But should you replace your system disk,
then you will most likely have to re-install your applications. Most of the SSD
drives I have tested up until now are quite slow at installing applications,
most likely because their I/O performance was quite limited.
For these tests, we picked some popular
applications and copied the entire contents of the CD or DVD media to an Crucial
M4 256GB SSD. We did this to make sure that the reading speed of our CD/DVD
reader would not hamper the performance of the target drive.
We then installed these applications onto
our comparison HDD drives, which were all running mirror image installations of
our Windows 7 Home Premium 64-bit installation, and timed the amount of time
taken to install the application with a stopwatch on each of the drives.
MS Office 2007 Professional (full install)
Now let’s see
how the Kingston HyperX 3k SSD performs with the installation of MS Office 2007
Enterprise Edition.
The procedure
followed was very simple, I copied all the files from the CD to the Crucial M4
SSD and the Crucial M4 was used as a source drive for the installation of MS
Office 2007.

An
excellent result.
Speed degradation after heavy testing
On this page I will test how the SSD
performs after heavy testing and usage.
I now have a new policy as to how I go
about testing an SSD. In the past I would deliberately try and get an SSD into
a “used state”, by filling the drive several times before starting the tests.
This seemed to work quite well up until the SandForce based SSDs appeared, but
because of the way the SandForce controller works, it was near impossible to
tell if deliberately trying to get a SandForce based SSD into a “used state”
had actually worked or not.
A new strategy was required. So now I begin
the tests with the SSD in a clean state and allow it to look after itself
during the testing period. I start off the tests by running AS SSD benchmark.
This gives me the “as new” reading and writing performance of the SSD.
Once all the tests have been completed, the
drive is then tested as a system drive, and just used normally for many days
which will also includes idle time (which is something I have always done with
a review sample). At the end of the period, the drive is filled to capacity and
then all files are deleted from the drive and then a “quick format” is
performed.
The last test is a rerun of AS SSD
benchmark, and the result from the final test is compared with the first run
when the SSD was in an “as new” state.

Used state
After a week of use we can see that Kingston
HyperX 3K is able to hold its performance close to the state that it was when I
first tested the drive, an impressive result.
This concludes our review. To read the final
thoughts and conclusion, click the link below....
Final thoughts and the conclusion
To sum up, this is
what I would say:
After a few days of extensive use I can say
that the Kingston HyperX 3K drive shows outstanding performance, not only in benchmarks
but also in real use. You have to try very hard to slow down the performance of
the drive, even if the drive is filled up to 90% of its capacity it will still
perform extremely well.
Performance is everything with an SSD, and
as I have shown in this review the HyperX 3K has a lot of it. However there is
another reason why this drive would have been on the top of my list if I was
out to get a new SSD. That reason is the outstanding package that Kingston has
put together. It has everything you need, from the more standard stuff, such as
a 3.5” bracket and cloning software, to more important things such as an
external USB 2.5” case.
If I had to say something negative... well
that would be, “I am sorry that we don’t have a sexy looks award”.
Conclusion:
Let us summarise the most important
positive and negative points below:
Positive:
- An outstanding package.
- Excellent operation as a system drive.
- Excellent sequential read/write speeds and
access times. - Very good 4K random I/O performance at
low queue depths. - SATA 6Gbps support.
- External case to ease the cloning process.
- TRIM support under Windows 7.
- Fast operating system start-up and
shutdown times. - 3 years warranty with 24/7 tech support.
- Price for what the drive offers.
Negative:
- None.
The parting sentence is:
“The Kingston HyperX 3K SSD not only has
excellent performance and outstanding looks but also provides an exceptional package,
3 year warranty, 3.5” bracket, and an external USB case”.
I therefore give the excellent and safe buy
awards to the Kingston HyperX 3K SSD.


You may comment on this review below.
Thanks to:
|
|
EFD |
|
|
Alex Schepeljanski for |
|
|


")


