 |
Review: Toshiba PX02SMF020 6GB/s 200GB Enterprise |
Welcome to Myce’s review of the Toshiba PX02SMF020 (6G) SAS Enterprise
SSD.
As the inventor of flash storage Toshiba’s SSD pedigree is
second to none.
The first and important thing to note is that the PX02SM
series of SSDs is also available with a 12 Gb/s SAS interface but it is the
model with a 6 Gb/s interface that is the subject of this review. We will
therefore not achieve the peak performance marks as specified by Toshiba below.
We hope to have opportunity to review a 12 Gb/s model later in the year.
Regular readers may remember that I outlined the key
features of an SAS interface (in comparison to an SATA interface) as part of
Myce’s review of the Sandisk/Smart Optimus – please see here.
The PX02SMF020 has a dual SAS port but does not have a ‘wide’ port like the
Smart Optimus does; it therefore has all the failover advantages afforded by
two access paths but does not have the ability to aggregate bandwidth across 2
ports for improved performance.
The PX02SM series uses Toshiba’s own 24nm eMLC NAND, with
56GB set aside for use by the controller. The drive proves to be a great
performer.
Now that Myce has gained some good experience of reviewing
Enterprise SSDs we will soon be publishing the first edition of the Myce –
Enterprise SSD Performance index (the ESP index, for short), where we will be
taking some of the key performance metrics from our regular enterprise testing
and comparing results for the enterprise drives we have thus far reviewed. So,
look out for the Myce ESP index arriving in the near future.
Market Positioning and Specification
Market Positioning
This is how Toshiba positioned the PX02 series, at the time
of its launch in August 2012 –
Toshiba’s Storage Products Business Unit, today announced
it is expanding its enterprise SSD family with the PX-Series, featuring three
models targeted for various enterprise applications: boot, read-intensive,
entry level servers; entry-to-mid-range applications servers; and
high-performance enterprise application servers. The PX-Series reflects
Toshiba’s continued storage innovation and coincides with the company’s
celebration of its 25th anniversary as the inventor of NAND flash
technology. Each model is optimised for its target segment with NAND flash
processes, capacity and interface support.
High-Performance:
Targeted at applications requiring the highest levels of SSD performance, the
PX02SM series is Toshiba’s first SSD to utilise 24nm eMLC (enterprise
multi-level cell) NAND technology, with capacities of 200/400/800GB and 1.6 TB,
and is Toshiba’s first offering with a dual-port 12 Gb/s SAS interface with a
form factor equivalent to industry-standard 2.5in HDDs.
Value
Line: Optimised for entry-to-mid-level server and storage
applications requiring balance, reliability, capacity and endurance, the PX02AM
series also features 24nm eMLC NANDflash in capacities of 100/200/400 GB, all
with a 6Gbs/s SATA interface. Featuring a slim 7mm 2.5in industry-standard
form-factor, all capacities offer power-loss protection.
Read-Intensive/Boot
Server: Targeted at entry-level server applications, the PX03AN
series is Toshiba’s first eSSD family using 19nm cMLC (consumer multi-level
cell) NAND flash in capacities of 55/120/240/480 GB. Utilising the 7mm 2.5in
form factor, the PX03AN series drives also offer power-loss protection.
These three new products further
underscore the breadth of Toshiba’s storage products, both SSDs and HDDs for
mobile and enterprise markets, giving customers a ‘one-stop shop’ capability
for their storage design needs.
And here’s the established
marketing approach –
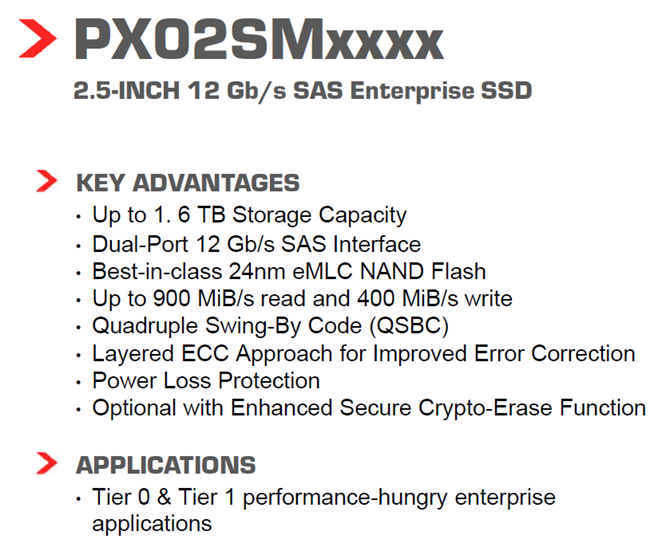
This mentions the intriguingly named ‘Quadruple Swing-By
Code’ (QSBC). I understand that QSBC is a strong and highly efficient Error
Correction Code (ECC) protecting against any read errors in the device.
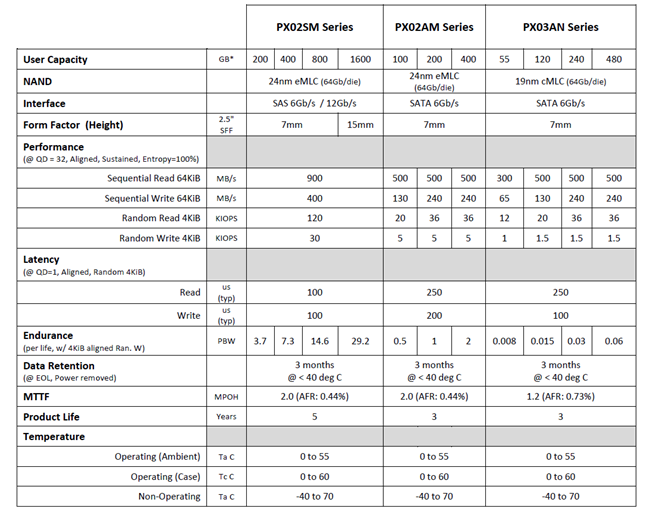
Specification
Here is Toshiba’s specification for the PX02SM, PX02AM, and
PX03AN series –
Toshiba has very recently announced the PX02SSX (12Gb/s)
series of drives which offers improved IOPS performance and improved endurance
– please click here.
We hope to test an example later in the year.
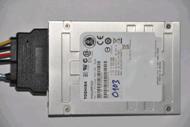
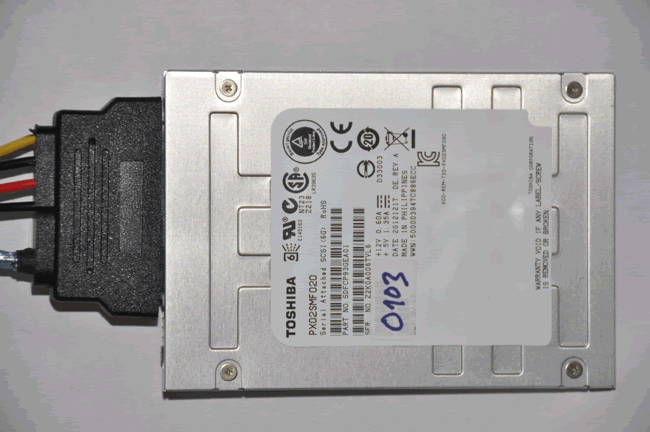
Product Image
Here is a picture of the Toshiba PX02SMF020 6G that I tested
–
Now let's head to the next page, to look at Myce’s
Enterprise Testing Methodology.....
Please click
here
to view or download a detailed introduction to Myce’s Enterprise Class Solid
State Storage (‘SSS’) Testing Methodology as a PDF.
Put briefly:
All testing is performed on an OakGate Technology test unit
We perform two sets of Performance Tests:
- A full set of the mandatory Storage Network Industry
Association’s (‘SNIA’) tests as specified in their Solid State Storage
Performance Test Specification Enterprise V1.0 – SNIA
SSS PTS Version 1.0. - A set of tests, known as the ‘Myce/OakGate Full
Characterisation Test Set’, that provides readers with a fuller
characterisation of the solution.
We also review other important factors such as Power
Consumption, Data Reliability and Failover features.
A word about SNIA testing – before striking a partnership
with OakGate Technology I spent some time researching how I might implement
SNIA testing using freely available tools such as IOMeter and FIO. I arrived
at the conclusion that whilst it was theoretically possible it was
impractical. The reason for this is as without the automation offered by a
test bench, such as the OakGate Unit, the only way to meet the SSS PTS
requirements is to run the maximum number of test cycles and then to manually
look back at the results to determine when/if steady state has been achieved in
the workload specific test cycle, and then harvest the data from the qualifying
Measurement Window. This means that the test runs would always take a maximum
elapsed time, and there would be a great deal of human effort required to
review, gather, and report upon the data. I empathise with, acknowledge, and
respect the efforts of other reviewers who endeavour to meet the SNIA’s
principles in their testing - I am privileged and thankful to be able to use a
superb test bench which automates the whole process and allows me to meet the
SNIA’s specification in full.
Before we move on, let’s remind ourselves of some basics –
When reviewing the performance of an SSS solution there are
three basic metrics that we look at:
1. IOPS – the number of
Input/Output Operations per Second
2. Bandwidth – the number of
bytes transferred per second (usually measured in Megabytes per second, ‘MB/s’)
3. Latency – the amount of time
each IO request will take to complete (usually, in the context of SSS
solutions, measured in Microseconds, which are millionths of a second).
It is true to say that IOPS and Bandwidth had all been
growing rapidly before the advent of SSS solutions, but Latency can only be significantly
decreased by eliminating mechanical devices, and thus Latency is the single
most important aspect that SSS solutions deliver to enhance performance.
Latency in a technical environment is synonymous with delay.
In the context of an SSS solution it is the amount of time between an IO
request being made, and when the request is serviced.
Bandwidth, also commonly referred to as ‘Throughput’, is the
amount of data that can be transferred from a storage device to a host, in a
given amount of time. In the context of SSS solutions it is typically measured
in Megabytes per second (MB/s).
A great enterprise SSS solution
offers an effective balance of all three metrics. High IOPS and Bandwidth is
simply not enough if Latency (the delay in an IO operation) is too high. As we
will see in the test results presented below, as Latency increases IOPS will
inevitably decrease.
Queue Depth is the average amount
of IO requests outstanding. If you are running an application and the Average
Queue Depth is one or higher and CPU utilisation is low, then the application’s
performance is most probably suffering from a ‘Storage Bottleneck’.
Another important factor to
remember is that SSS performance is influenced by previous workloads, not just
the current workload, and especially by what has previously been written to the
drive. As specified in the SNIA SSS PTS the goal of all good Enterprise level
testing is to provide consistent circumstances, so that results can be compared
fairly across different SSS solutions – it is for this reason that all of our
tests start with a purge of the drive, so that it starts in a ‘Fresh Out of the
Box’ (FOB) state. Most tests then have a pre-conditioning phase where the
drive is put into a ‘Steady State’ before the test phase begins. Put briefly, a
‘Steady State’ is achieved when the performance of the drive no longer varies
over time and settles into a consistent level of performance for the workload
in hand. You can find a detailed explanation of ‘Steady State’ and how it is
determined in the SNIA tests in our Enterprise Testing Methodology paper, which
can be viewed or downloaded as a PDF by clicking here.
For interest, here are some
generally accepted assumptions that differentiate the use and therefore the
approach to testing Enterprise/Server and Consumer/Client SSS solutions:
Enterprise/Server SSS
assumptions:
- The drive is always full
- The drive is being accessed 100% of the time (i.e. the
drive gets no idle time) - Failure is catastrophic for many users
- The Enterprise market chooses SSS solutions based on their
performance in steady state, and that steady state, full, and worst case
are not the same thing
Consumer/Client SSS assumptions:
- The drive typically has less than 50% of its user space
occupied - The drive is accessed around 8 hours per day, 5 days per
week, and typically data is written far less frequently - Failure is catastrophic for a single user
- The consumer/client market generally chooses SSS solutions
based on their performance in the FOB state
Esther
Spanjer, Director, SSD Technical Marketing at Smart Storage Systems, said, 'I
am happy to commend Myce for their high level of professionalism and
cooperation during the review process', Ms. Spanjer added, 'I wish them every
success in their partnership with OakGate Technology and their initiative to
provide authoritative performance reviews for the Enterprise Solid State
Storage market'
Now let's head to the next page, to look at the results
of our SNIA IOPS (Input/Output Operations per Second) Test.....
Here is the specification for this test -

IOPS performance will typically
vary greatly depending on the nature of the IO traffic, including the mixture
of Read and Write operations, and the mixture of Block Sizes (the size of the
IO operation’s data packet, also referred to as IO Size). This test is designed
to benchmark the IOPS performance profile for random IO operations for 56
different combinations of Read/Write mix % and Block Sizes when in a Steady
State, which are of interest to most users.
All of the SNIA’s test
specifications define a ‘required’ set of parameters that must be run for the
test and then allow the operator to elect to run additional tests with
different parameters of their choice. It is the mandatory test with the
required parameters that we run. Note that all of the mandatory tests must be
conducted with fully random data
As previously mentioned, a key
principle of SNIA testing is to provide a consistent basis for comparing
different solutions from different manufacturers - myce.com/blog will be in a strong
position to publish objective performance comparisons as we gain more
experience in the review of Enterprise level SSS solutions.
Here is the report of the results -

The second table confirms the Range in the Measurement
Window (the maximum variation of a 4K Round value from the Average of the 4K Round
values) and the slope of the best linear fit through the 4K values (to see the Testing
Methodology paper for a detailed specification of the criteria for determining
the achievement of Steady State, click here)

You can see here that Steady State Convergence was
determined at the end of Round 5. The Steady State Convergence Plot provides a
visual confirmation of Steady State Convergence.

This graph shows the average results gathered in the
Measurement Window. You can see an expected drop in IOPS performance as IO size
increases and/or the percentage of Writes increases.


This is an alternative method for presenting the results
from the Measurement Window; one which personally I prefer. Users can simply
refer to the grid to obtain the R/W mix and Block Size value of interest.
For example, Online Transaction Processing applications typically run at a Block
Size of 8K and a Read/Write Mix of 65/35, and users can quickly understand how
the device might perform under Steady State for these access characteristics.
You can see that the 4K 100% Read IOPS result is 114,135 and
that the 4K 100% Write IOPS result is 29,938. These are excellent results for
the 6Gb/s version of the drive with the Read IOPS almost hitting Toshiba’s 12 Gb/s
specification of 125,000 IOPS and the Write IOPS exceeding Toshiba’s 12 Gb/s
specification of 25,000.
Now let's head to the next page, where to look at the
results of the SNIA Write Saturation Test.....
Here is the specification for this test -

The objective of this test is
to observe the time evolution of the drive’s performance, as a function of
time, from a ‘factory fresh’, ‘fresh out of the box’ (‘FOB’) state. When a
drive is in a FOB state (e.g. after it has been purged by, for example by a
SATA Secure Erase or SCSI Format), we can expect an initial period of time when
writes can easily be accommodated by clean/empty blocks, but once all of the clean
blocks have been written to once and the drive’s controller must first clean
blocks (with erase write operations) before it can write new data, then we can
expect a slow down. The slow-down is usually quite dramatic and is commonly
referred to as the ‘write cliff’.
The Write Saturation Test is
easy to run as it requires no steady state determination – it can be easily run
in freely available software, such as IOMeter.
Here is the report of the
results -


You can see here a significant drop in Write IOPS
performance as the Toshiba PX02SMF020 reaches a Steady State. The marked fall,
at around Round 18 occurs when all of the available NAND has been written to
once and the drive must clean blocks on the fly, in preparation for accommodating
further writes – this is commonly referred to as the ‘Write Cliff’.
This is a picture of typical behaviour.
Note that the test was halted, as specified in the SNIA SSS
PTS, when 4 x the User Capacity had been written to the drive. You can see that
the PX02SMF020 is settling into a steady state at around the 28,000 IOPS level.

You can also see that the latency graph line is a mirror
image of the IOPS graph line.

This is a graph showing the Maximum Write Latency values
that occurred in each Round.
Now let's head to the next page, to look at the SNIA
Throughput Test.....
Please note that we have moved up to Version 1.1 of the SNIA
Throughput Test specification. The v1.0 Throughput Test is missing a pre-fill
stage between the purge and the tests loop, that sit within the overall loop on
Block Size.
Here is the specification for the Version 1.1 test -

The test is designed to measure the sequential Read and
Write IO performance for two Block Sizes, when under Steady State conditions.
One can easily compare the results produced by this test with box-top numbers,
which are usually stated as “Up to xxx MB/S”.
Here is the report of the results -


You can see here that Steady State was achieved for both Write
IO sizes by the end of Round 5.

You can see here that Steady State for both Read IO sizes
was achieved by the end of Round 6.

You can see here the average of the values recorded in the
Measurement Window. The Read speeds are outstanding for a 6 Gb/s interface and
the Write speeds fall just short of Toshiba’s specification for the 12 Gb/s
interface of 400 MB/s. It seems that the only significant advantage for the 12
Gb/s interface is in the achievement of greater sequential reads speeds (of 900
MB/s, as specified by Toshiba).
Now let's head to the next page, to look at the results
of the SNIA Latency Test.....
Here is the specification for this test -

The Latency Test measures average and maximum response times
using random IOs at specified Block Sizes and Read/Write mixes, taken under
steady state conditions. The test runs at a Queue Depth of 1 (1 outstanding
IO), thus the results give the baseline response time for a single IO request.
The test also reports maximum latency values, which can be
helpful to see if there might be processes within the drive that may cause max
Latency values to become larger.
Here is the report of the results -


These are the Average and Maximum Latency Values observed in
the Measurement Window (measured in Milliseconds).

You can see here that Steady State Convergence was achieved
at the end of Round 7.

Here is a graph of the Maximum Latency results.

Here you can see a graph of the Average Latency results.

Here is a 3D graph showing, at a glance, the Maximum Latency
values for each combination of Read/Write Mix and IO Size.

Here is a 3D graph showing, at a glance, the Average Latency
values for each combination of Read/Write Mix and IO Size. These are excellent
Latency results.
Now let's head to the next page, to look at the results
for the Myce/OakGate Read and Write Latency Tests......
Here are the specifications for the tests -


These tests steadily increase the random 4K IO demand in
terms of IOPS, and report the drives response in terms of Average IOPS, Average
Latency and Maximum Latency. It is designed to show a drive’s maximum IOPS
capability and report the all important Latency numbers for each level of IOPS
demanded. The Maximum latency numbers give us an insight into the occurrence
of Latency peaks that could cause an unexpected response from time to time.
Here are the results –
Firstly, here is a graph showing the result for the
Pre-Conditioning in Step 2 -

You can see two distinctive steps down towards a steady
state, firstly at around 1,200 seconds and then at around 3,400 seconds.

Here is a zoomed in picture of the second step.
What explains the two steps? Well based on what we saw in
the SNIA Write Saturation Test I assume that the first step down at around
1,200 seconds occurs when all NAND has been written to once (so that blocks
must then be cleaned on the fly to accommodate new writes). I can only guess
that the second step down is caused by the firmware electing to further
throttle write speeds, perhaps to ensure the drive’s life expectancy is preserved.
4K Latency Read Test

You can see that the drive can no longer meet the increase
in IOPS demand at around 80,000 IOPS, which, in the context of this test, is
falling short of the 114,135 IOPS that we saw for 4K Random Writes in the SNIA
IOPS test. This is curious and I have not seen such a difference between these
tests before.

You can see a gradual increase in read latency up to the
maximum IOPS mark. The Read Latency results are very good.

Here we can see that the Max Read Latencies have a number of
peaks.
Let’s have a look at the distribution of the Latency results
at the 75,000 IOPS mark –

As this is the first time in this review, that we are
looking at a High Resolution Latency Histogram, here’s an explanation – The X
axis to the left is the count of the IOs in the observation period (in a Round)
that had a Latency of the value along the Y axis (please note that the X axis
is logarithmic to allow the low order counts of the huge number of IOs that
have been measured to be visible); the Y axis is the Latency value measured in
Microseconds; The X axis to the right is the % of the Total IOs observed that
have a Latency <= to a given Latency value; the rate of getting to 100% is
highlighted by the red graph line.
You can see that 99.9% of the Latency values are <= 490
Microseconds.
4K Latency Write Test

You can see here that the Toshiba PX02SMF020 starts failing
to meet the increase in IOPS demand at around 22,500 (although it continues to
increase its response to the increase in demand up to 40,000 IOPS – albeit that
its response to a demand of greater than 39,000 IOPS is around 27,500 IOPS).

Here we can see that Average Write Latency stays below 300
Microseconds until a demand of 20,000 IOPS.

Here are the Maximum Write Latency plots.
Now let’s have a look at the distribution of the Latency
Values at the 30,000 IOPS Mark –

You can see that 99.9% of the Latency Values are <= 8.71
Milliseconds (ms).
Now let's have a look at the distribution of the latency
values in a test designed to show the Toshiba PX02SMF020’s Quality of Service
(QoS) for 4K Writes and Reads when in a Steady State. The specification for the
test is 1) Purge the Drive 2) Precondition the drive by performing 4K random
writes for 3 hours (100% random data) 3) Perform 60 rounds of 4K Random Writes,
with each round consisting of 9 seconds warm up and 51 seconds of performance
measurement 4) Perform 60 rounds of 4K Random Reads, with each round consisting
of 9 seconds warm up and 51 seconds of performance measurement. The test was
performed at a Queue Depth of 1.
Here are the results -

Here are the Average Write Latency plots per Round.

And here are Maximum Write Latency plots per Round

And here is the High Resolution Latency Histogram for Round 43.
You can see that 99.9% of the Latency Values were <= 3,840
Microseconds (3.84ms) and that 99% of the values were <= 130 Microseconds).
If you look carefully you will also see that there are relatively few large
outliers.

Here are the average Read Latency plots per round.

And here are the Maximum Read Latency plots per Round.

And here is the High Resolution latency Histogram for Round 30.
You can see that 99.9% of Latency values were <= 350 Microseconds. You can
also see that there are remarkably few outliers. This is a good result.
Now let's head to the next page, to look at the results
for the Myce/Oakgate Reads and Writes Tests.....
Here is the specification for the tests -

The tests are designed to show the Random and Sequential,
Read and Write, performance metrics for different combinations of Queue Depth
and IO size.
Here are the results -
Random Reads

Here you can see IOPS drop as IO size increases. You can
also see that there is good scalability up to a Queue Depth of 32.

Here you can see a gradual increase in Bandwidth as IO Size
increases, plus again there is good scalability up to a Queue Depth of 32.

You can see here that Read Latency increases as IO Size and
Queue Depth increase.
Random Writes

Here you can see a distinctive and healthy IOPS peak for the
4K IO Size. There is little scalability beyond a Queue Depth of 4.


Sequential Reads

You can see here that Sequential Read IOPS decreases as IO
Size and Queue Depth increases.

You can see here that
Bandwidth does not scale beyond a Queue Depth of 32.

You can see here that Read Latency increases as IO Size and
Queue Depth increase.
Sequential Writes


You can see that there is little or no scaling beyond a
Queue Depth of 8.

Now let's head to the next page, to look at the results
for the Myce/Oakgate 4K Mixed Reads/Writes Tests.....

This test is designed to show the performance metrics for
different combinations of Queue Depth and Read/Write mix (the % of Reads and
the % of Writes making up the IO traffic)
4K Mixed R/W Test

You can see that there is no dramatic decrease in Read IOPS
as a small % of writes enters the mix.


Now let's head to the next page, to look at the results
of the Myce/OakGate Entropy Tests.....

These tests are designed to show performance metrics for
different combinations of Queue Depth and Entropy % (Entropy % is the degree to
which the data that is random and therefore incompressible). Testing with
different Entropy % levels has become important with the advent of controllers,
such as those from LSI Sandforce, that compress data before writing it to NAND.
Controllers that compress data can be expected to perform better with highly
compressible data (i.e. data with low Entropy).
The first test performs 5 minutes of Random 4K writes for
each combination of Queue Depth and Entropy %.
The second test does the same thing for a mixture of Read
and Write traffic (70% Reads, 30% Writes).
4K Entropy Write Test

You can see there is little or no variance in performance to
be found in any of the Entropy tests, as the degree of random data increases
(and this comment applies to all of the test results for the Myce/OakGate
Entropy Tests). We can conclude that the Toshiba PX02SMF020’s controller does
not compress data.


4K Entropy 70%_Reads_30%_Writes Test
As we saw no evidence of compression in the 4K Entropy Write
Test we skip the presentation of the 70/30 entropy results.
Now let's head to the next page, to look at Power
Consumption and Data Reliability.....
Power Consumption
I believe most people know that data centres are already one
of the major consumers of electricity in the industrialised world; indeed it is
estimated that currently 2% of all electricity consumption goes into IT
applications. According to the European Union the energy consumption of data
centres was 46 Terawatt hours in 2006 and is set to rise to 93 TW hrs by 2020. This
is equivalent to one hundred million 100W light bulbs burning 24 hours a day,
365 days a year.
Typically 40% of the power consumed by data centres is for
the IT load and 35% is for cooling the system. Generally speaking, if a drive
consumes more power it will produce more heat – so power consumption is indeed
a double edged sword. It is no surprise then that a significant proportion of
a data centre’s power consumption goes on servers. I understand cloud based
applications, such as Facebook, are the primary cause of the growth in servers
and the demand for storage space.
If you are a Facebook user, like me and the Reynolds sibs, and
you reside in Europe – this is most probably where your data is click here. Some
interesting Facebook statistics – Facebook has more than 1 Billion monthly
active users, it generates 1 Trillion page views per month and more than 219
Billion photos have been uploaded since launch – amazing! Here is an
interesting video showing the remarkable scale of Facebook’s largest North
American data centre click
here.
My thanks to Anna of Intel for pointing me to the following
Info-graphs -


The following graph uses the typical Power Consumption, when
active, as published in the respective manufacturer’s specification (please
note that the value for the Samsung 843 is the average of the typical read
active and write active values, as specified by Samsung). The value for the
Kingston E100 is calculated as the average of 1.2W (TYP) Read and 2.7W (TYP)
Write.

The PX02SMF020’s Power Consumption is specified by Toshiba
to be < 9 Watts (appearing as 8.9 in our chart), which is somewhat higher
than some of its competitors.
Data Reliability
The 'Unrecoverable Bit Error
Rate' (UBER),as defined by JEDEC, the global leader in developing open
standards for the microelectronic industry, is a metric for data corruption
rate equal to the number of data errors per bit read after applying any
specified error correction method. UBER = number of data errors / number of
bits read. JDEC specifies that the maximum error rate allowable for an
Enterprise level SSS solution is one error in every 10^16 bits read.
Toshiba does not specify an UBER for the PX02SM series.
The PX02SMF020 has a 5 year warranty and is warranted for lifetime
writes of 3.7 PB (Petabytes, for a Random workload), which is equivalent to around
10 Drive Writes Per Day over 5 years
The PX02SMF020 includes power failure support.
Now let's head to the next page, to look at the
Conclusions of this review.....
The Toshiba PX02SMF020 6G is a thoroughly competent
enterprise SSD with a well rounded performance profile. Sequential Read speeds
are outstanding. Endurance is excellent.
It is difficult to establish what price a company, buying in
a large volume, would have to pay for any enterprise SSD and one imagines it
would be considerably less than can be found on retail sites. I found the
PX02SMF020 is available for 768 USD on a US web site, which puts it in the
premium price band.
I am pleased to award the Toshiba PX02SMF020 our ‘Excellent’
Rating.


")


