|
|
Review: ADATA Reviewed by: Antonis Provided by: ADATA Model: ADATA Ultimate SU800 256GB SSD Firmware version: P0801A
|
|
|
|

In 2012 I tested the ADATA SP900 SSD and
back then almost every drive had the SandForce controller. Moving on to 2016,
and things have evolved a lot. Not only have we more options on the controller
of the SSD but we also have moved forward with NAND technology, from SLC to
MLC, to TLC, and now to 3D NAND.
ADATA’s Ultimate SU800 SSD uses a Silicon
Motion controller with the latest 3D NAND, and ADATA has sent me the 256GB SSD
to test. So let’s find out what this SSD can do, but before I start this review
you might want to take a look at the ADATA website to find out about their
products and their history, you can do that simply by clicking the link here.
So let's start this review by taking a look
at the packaging and its contents, before moving on to some testing.
ADATA Ultimate SU800 256GB SSD
As always I will start by taking a look at
the package and the contents that are included with the ADATA Ultimate SU800
256GB SSD. We'll start with the package.
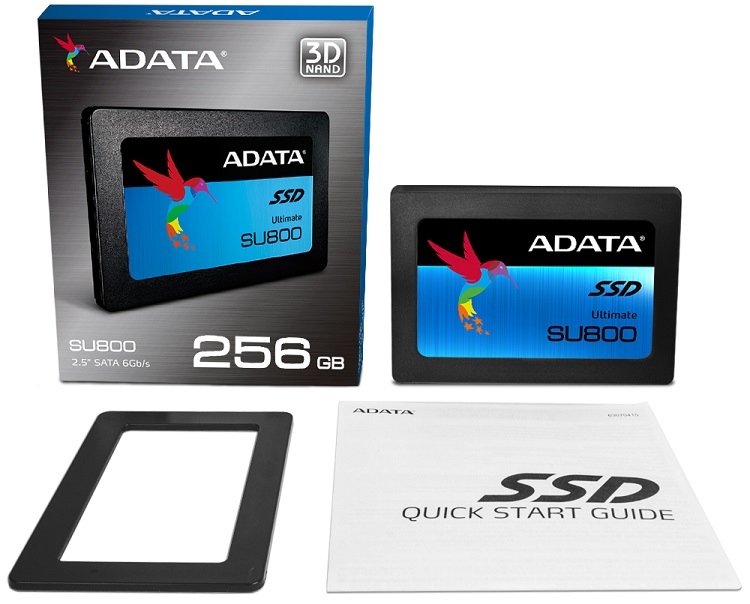
Here is a quick look at the drive, and its
contents.
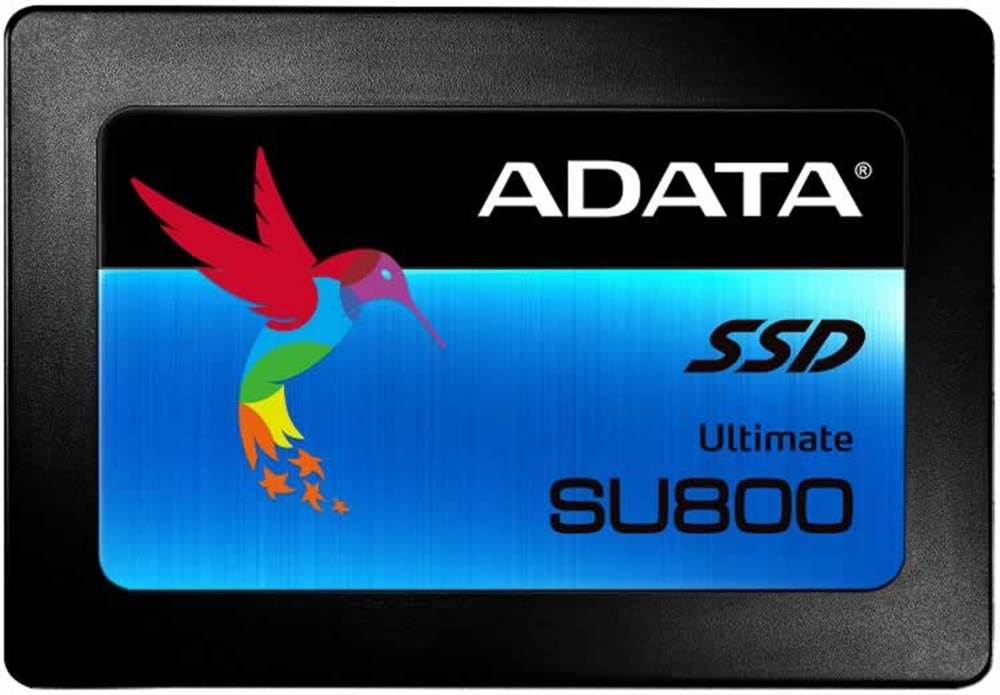
The top side of the ADATA SU800 256GB SSD.
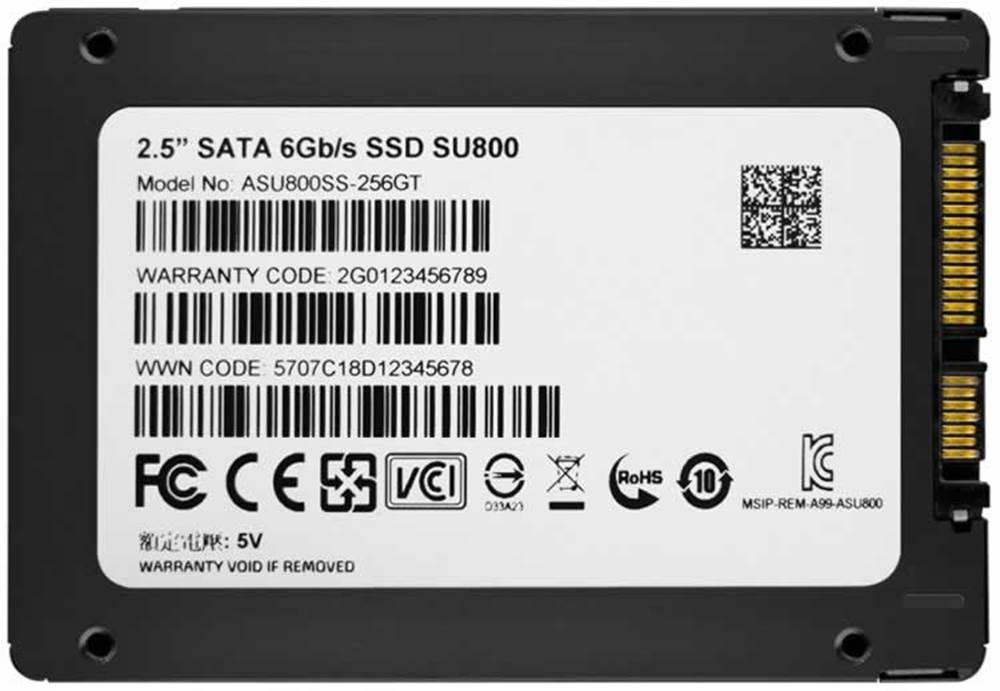
The rear of the ADATA SU800 256GB SSD. At
this point I need to say that the housing of the drive is made out of plastic,
so some cost saving here, but the overall quality is good.
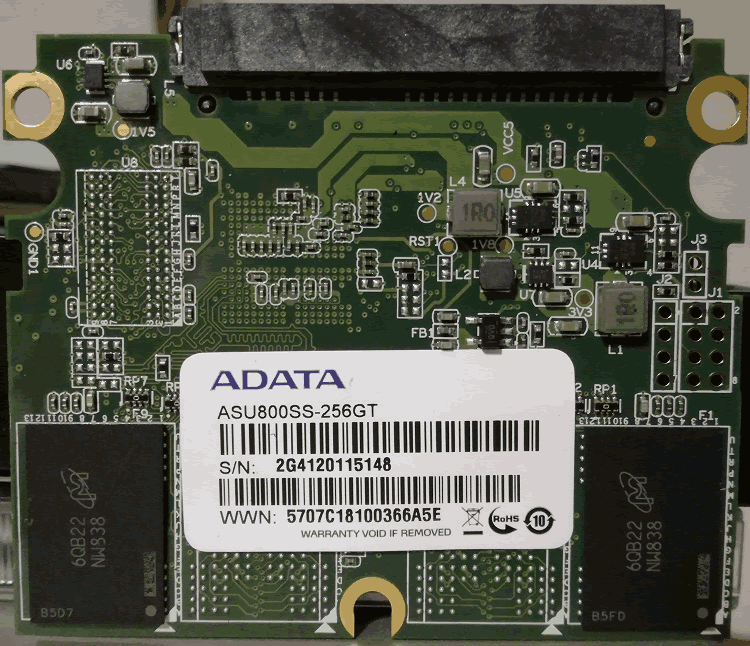
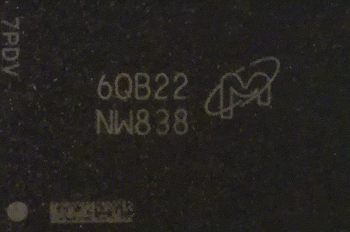
Here is a quick look inside the ADATA SU800
256GB SSD, and on this side we can see the two Micron 3D NAND chips that are
used.
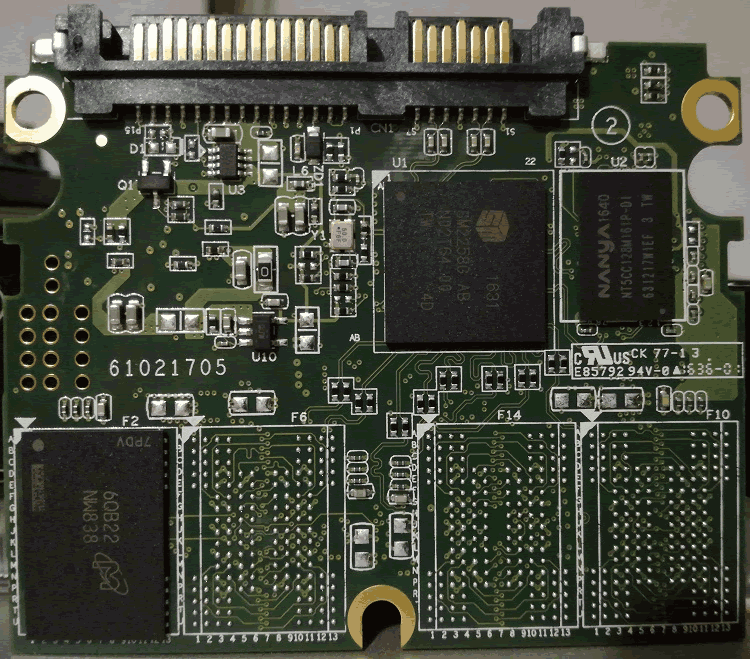
On the other side of the PCB we find
another 3D NAND from Micron, a NANYA memory chip, and the Silicon Motion
controller.
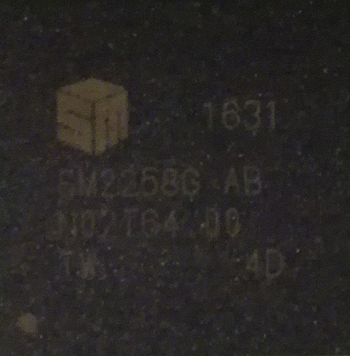
The Silicon Motion SM2258G controller.
The Micron 3D NAND.
Specifications of the ADATA Ultimate SU800 256GB SSD
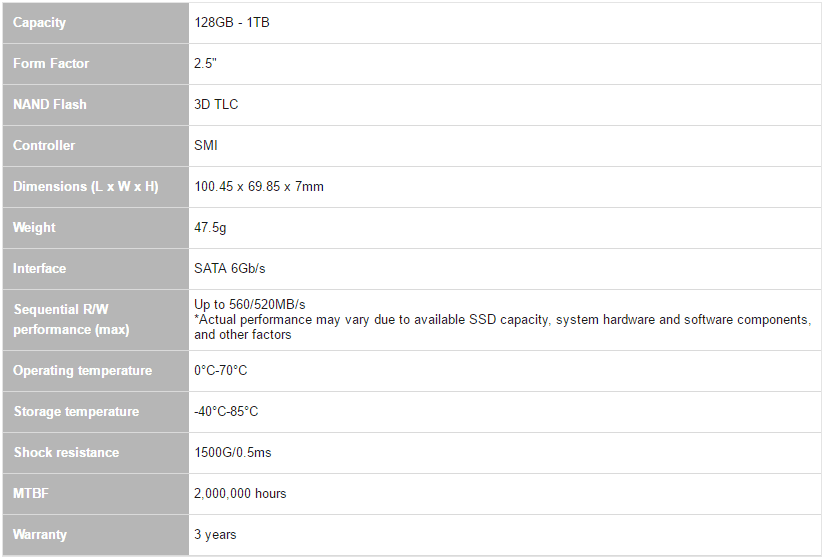
We can see that the ADATA Ultimate SU800
SSD is available in capacities from 128GB up to 1TB, it comes with a three year
warranty and an MTBF of 2,000,000 hours. Also the read speed is up to 560MB/Sec
and the write speed can reach a maximum of 520MB/Sec (these figures will differ
depending on the capacity).
CrystalDiskInfo
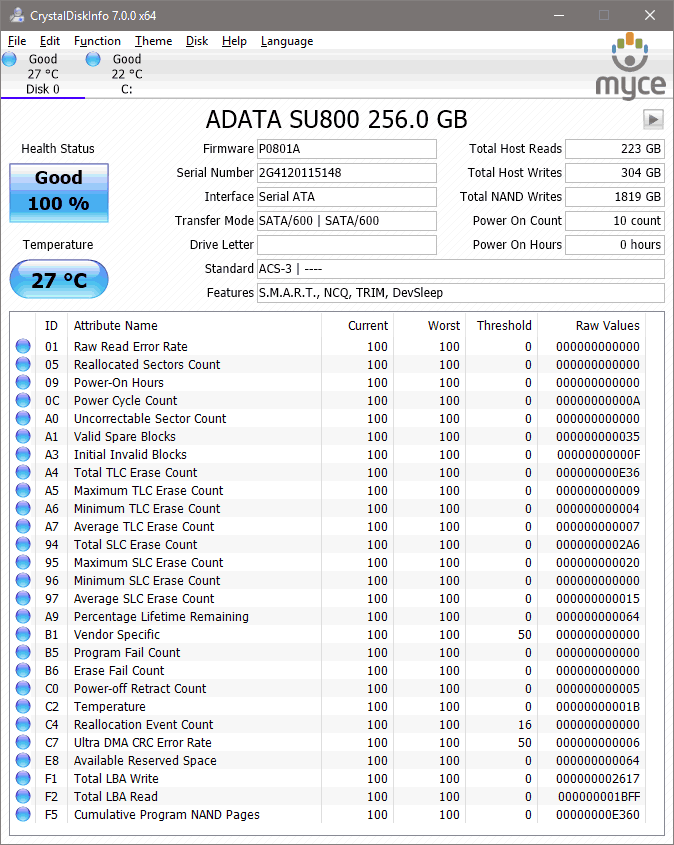
In
the above screenshot we can see all the available info for the ADATA SU800 256GB
SSD.
Let’s head to the next page where we
take a look at our testing methods and the review PC.
Test machine
For this review I will be using a computer
with the following configuration:
Hardware:
- Motherboard: ASUS X99-A (Intel X99 chipset)
- Processor: Intel Core i7 5280K @ 4.4GHz
- RAM: RAM: Crucial Ballistix Elite 4x8GB
- GFX: MSI GTX 960 2GB
- Sound: Onboard Realtek HD audio
controller - OS SSD: HyperX Fury 240GB
- PSU: Seasonic 750W
- Display: Futsiju Siemens 22”
- Operating System: Windows 10
The ADATA SU800 256GB SSD was connected to first
SATA port on the ASUS X99-A motherboard. All power saving features were
disabled during all of my synthetic benchmarks.
The
SATA 6Gbps drivers used on our review PC were Intel Rapid Storage Technology
(RST) Version 14.5.0.1081.
Test applications
To test the performance of the ADATA SU800
256GB SSD, I will be using the following test applications in this review.
- HD Tune
Pro - ATTO
- Iometer
- AS SSD
Benchmark - CrystalDiskMark
- Anvil’s
Storage Utilities - PCMark
Test procedures
I will start off our testing procedures
explanation by stating that I did not run many synthetic benchmarks on the ADATA
SU800 256GB SSD. You may ask why I have run so few synthetic benchmarks.
SSD technology has moved so fast in the
last couple of years, that basic synthetic benchmarks alone are now of very
limited use, as they don't really tell us much about performance and how the
drive will behave in the real world. I have therefore decided to show some
basic benchmarks for the ADATA SU800 256GB SSD, and will complement this with
advanced benchmarks using IOMeter and AS SSD benchmark. I will also show how
the ADATA SU800 256GB SSD performs in the real world.
The reality of SSD performance
While I can easily show you which SSD is
technically the faster, when you use one of these modern SSDs as an operating
system drive it becomes very difficult to tell them apart as far as performance
is concerned.
A typical use of a small capacity SSD at
the moment is to have your operating system and applications installed onto the
SSD. The performance difference compared to a traditional HDD is enormous,
however when you start to compare SSD to SSD the difference becomes almost
impossible to detect.
Let’s look at why this is the case.
Drive A can boot to the desktop in 8.11
seconds, and drive B can boot to the desktop in 8.12 seconds, the difference in
time is milliseconds, and can one really tell the difference?
The fact is, all modern SSDs are only
ticking over when they are only running the OS and launching applications, it’s
only when you get to some of the larger capacity SSDs, with enough free space
to be able to hold the actual data that you’re going to be working with, be
that video, audio or pictures, for example, that you actually get a tangible
difference in performance. This is where the SSDs with the better sequential
performance start to pull well ahead of the SSDs which have lower sequential
read/write performance.
Small file random IOPS vs sequential performance
IOPS
This is a fairly complex subject, but I
will do my best to explain things in a manner that is easy to understand.
The term IOPS is the amount of input or
output transactions that can take place in a one second interval, so for
example, if an SSD is quoted as being able to cope with 20,000 4K random write
IOPS, then the SSD should be able to cope with 20,000 input transactions in a
period of one second. If the same SSD is said to be able to produce 20,000 4K
random read IOPS, then the same SSD should be able to produce 20,000 4K random
read output transactions in a one second interval.
Ok, now we have some figures to work with,
the next question is how many IOPS are actually required?
This will depend on your usage pattern. If
you are a typical desktop user who browses the internet, does some word
processing or perhaps some audio or video editing, and perhaps plays a few
games, then in actual fact, you don’t need to have massive 4K random read/write
performance. The actual amount of 4K random performance that is required for a
fast and smooth running system for a desktop user with a usage pattern similar
to the above will be well under 1,000 4K IOPS.
On the other hand, if the SSD is being used
for running a large and complex database server, then 4K random performance is
the absolute measurement of how fast that server will run, as this type of
application does most of its input and output transactions in the 4K domain.
So why would I need an SSD with 80,000 4K
IOPS for a desktop?
In fact you don’t need this type of
performance for a desktop, but an SSD which is capable of coping with 80,000 4K
IOPS will be faster than an SSD which can only cope with 20,000 4K IOPS.
OK, I just said if under 1,000 4K IOPS are
actually required for typical desktop usage, why is an SSD with 80,000 4K IOPS
faster than an SSD with only 20,000 4K IOPS, confused?
You may ask, if I only require 1,000 4K
IOPS surely the rest is wasted?
While you may never need 80,000 4K IOPS,
IOPS is all about latency. The reason that an SSD can cope with as much as 80,000
4K IOPS is because latency in this domain is very low. With 4K files, even if
you require to process 500 of them at the same time, you are not talking about
a huge amount of data, it has far more to do with how long it takes the SSD to
process a single file, and the amount of time required to process a single 4K
is all about how long it takes for the SSD to access or store that data before
it can move on to the next transaction.
In other words an SSD with 80,000 4K IOPS
performance will handle those 500 files faster than the SSD with 20,000 IOPS.
So how will a desktop user even notice this
faster speed if so little 4K random IOPS and data are actually used?
Multitasking is a good example. The more
tasks you run at the same time, you more you will notice the speed difference.
Sequential performance
I have always maintained that sequential
performance was every bit as important as small random file performance for a
desktop SSD. Some highly regarded people on other sites found this statement
quite funny a couple of years ago when I made it, but my, how times have
changed in the world of SSD reviewing.
To me this was always so obvious for a
desktop user. For example, let’s say you want to launch an application or game.
Both have some fairly large files to load, and also a great many small files,
but the point is, even the smaller files are sequential in nature. Now let’s
say you’re into audio or video editing. Video files tend to be huge, and the
files are written or read sequentially. Isn’t this how many users are using
their PCs these days?
Summary
So how does this shape up in the real
world? Which is better, massive 4K IOPS or massive sequential performance?
In an ideal world you want both, as an SSD
with massive random 4K IOPS and sequential performance will always be faster
than an SSD that has high sequential performance and moderate 4K random IOPS
performance, and the same applies to an SSD that has massive 4K random
performance and moderate sequential performance. The SSD which has high
performance in both patterns will always be the faster SSD.
However, you can still have an SSD that is
very fast for desktop use that has moderate random 4K performance and massive
sequential performance, the same can be said about a drive having massive
random 4K performance and moderate sequential performance, as it is about
getting the balance right if you have to compromise on one or the other.
Drive preparation for running the tests
All the SSDs used in this article were in a
clean and fresh state when the testing period started. From then on, each drive
had to rely on its own NAND cleaning effectiveness for the remainder of the
tests.
- Both our spinning HDD drives were
defragged before the start of each test.
- All SSD and HDD used in this article had
their partitions aligned to the Windows 7 x64 defaults.
Where I use graphs in this article to
display results, I will use the following colours to make it easier, for our
readers to see which drive we are reviewing.
![]() ADATA SU800
ADATA SU800
256GB SSD
![]() Comparison SDD
Comparison SDD
Let's take a look at the ADATA SSD
Toolbox software
ADATA’s SSD Toolbox
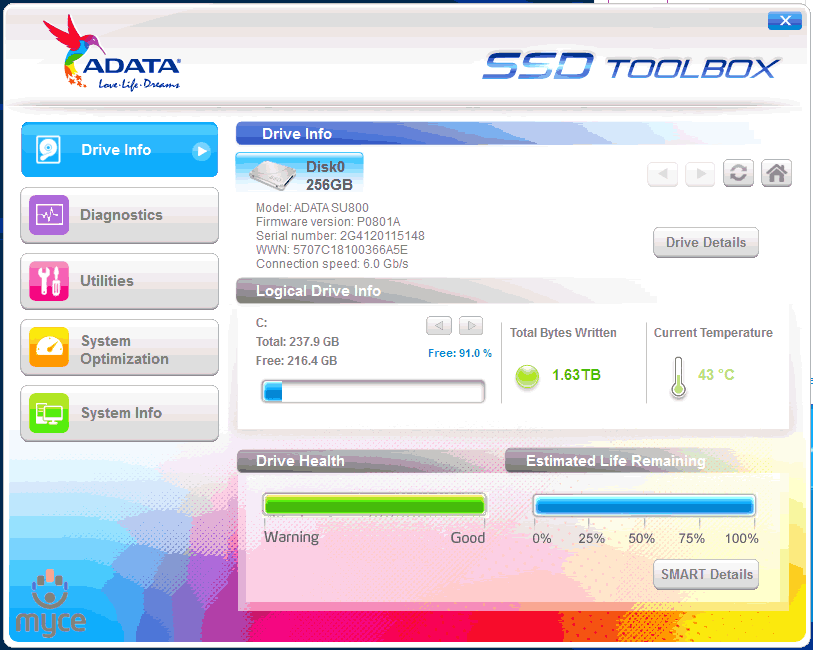
The first screen shows all the information
about the drive that is connected, the drive's health, total bytes that have
been written, temperature, and also the estimated life of the drive.
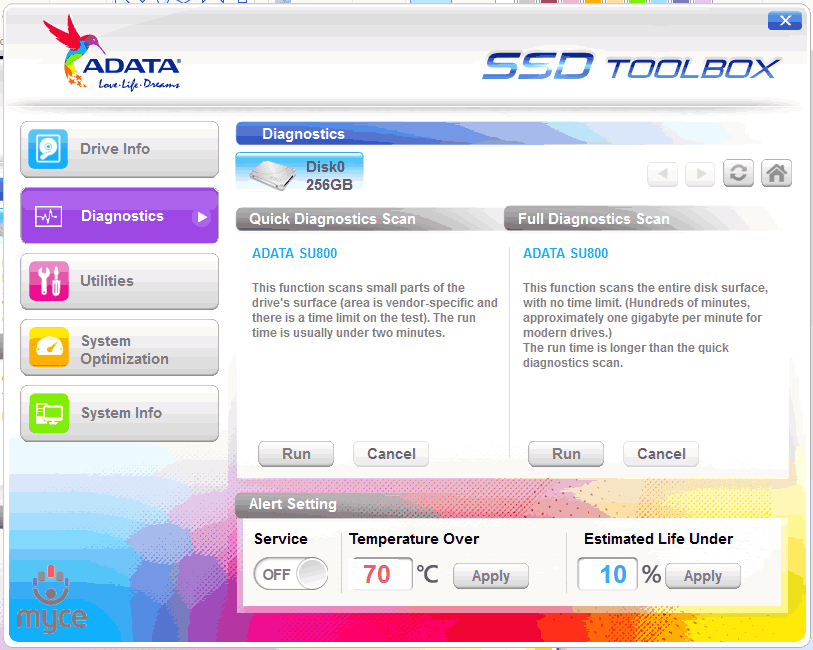
The diagnostics tab allows you to check the
drive with a quick or a full diagnostic test, also you can set an alert if the
drive reaches a certain temperature or the expected life of the drive drops
below a certain point.
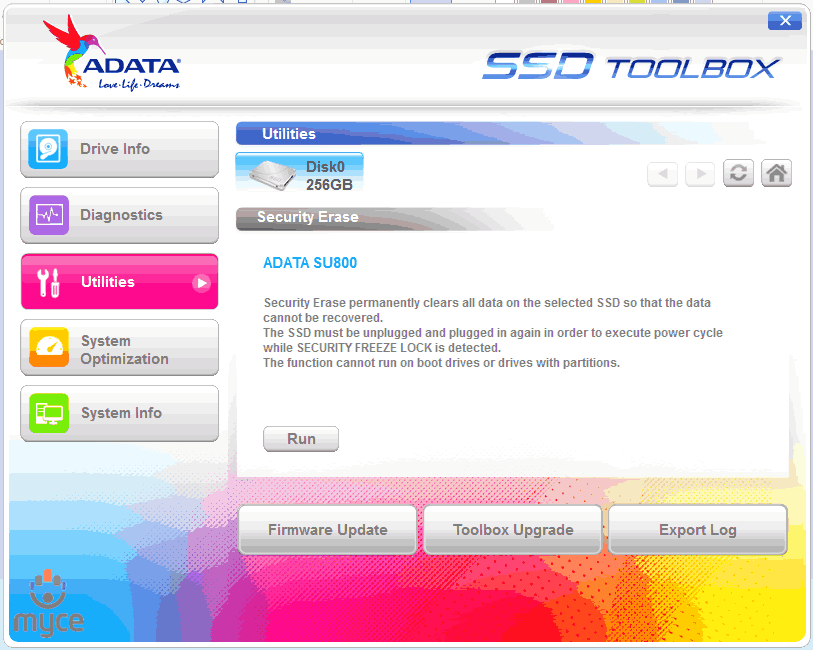
This picture tells you everything that you
need to know about the utilities tab.
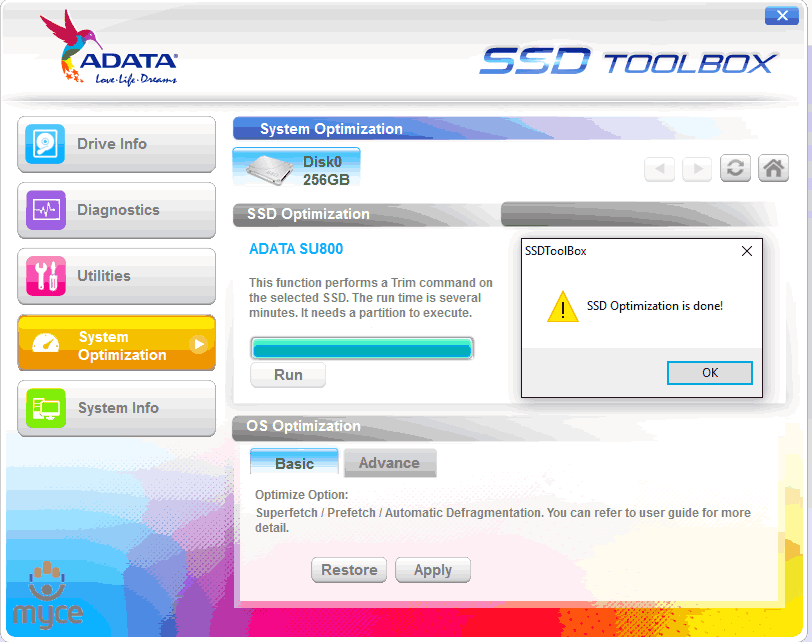
On the system optimization tab you will find
the option to run the TRIM command, also a basic and an advanced option to
optimize the OS, for which you can read the excellent PDF that ADATA has on
their website.
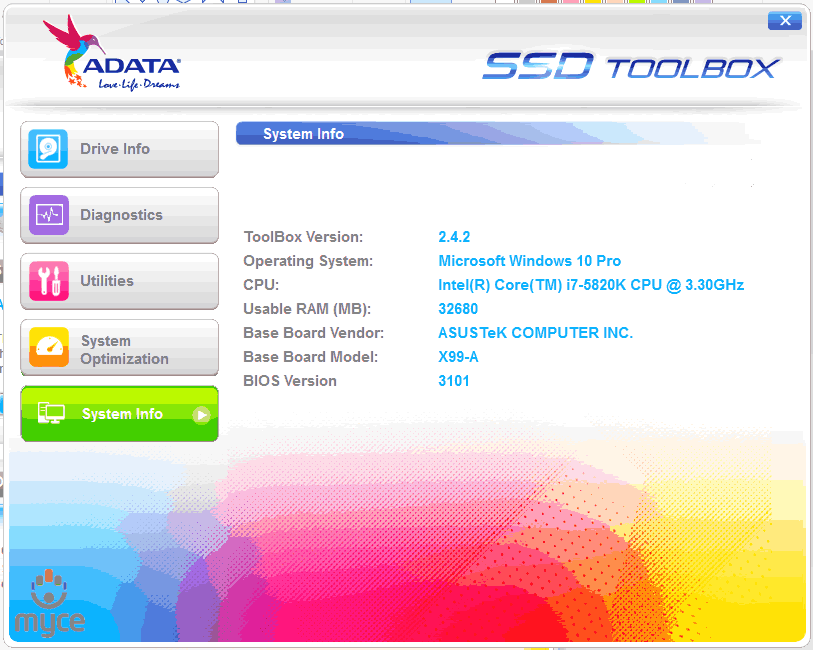
Here we can see some general system information
from the ADATA SSD toolbox, and also the version of the toolbox that is used.
Now let's head to the next page, where I
look at some basic benchmarks...
Reading Benchmarks
HD Tune
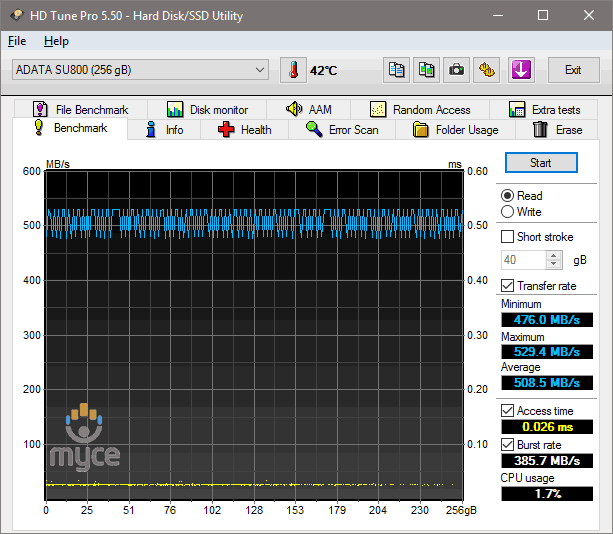
HD
Tune Test – Sequential reading test
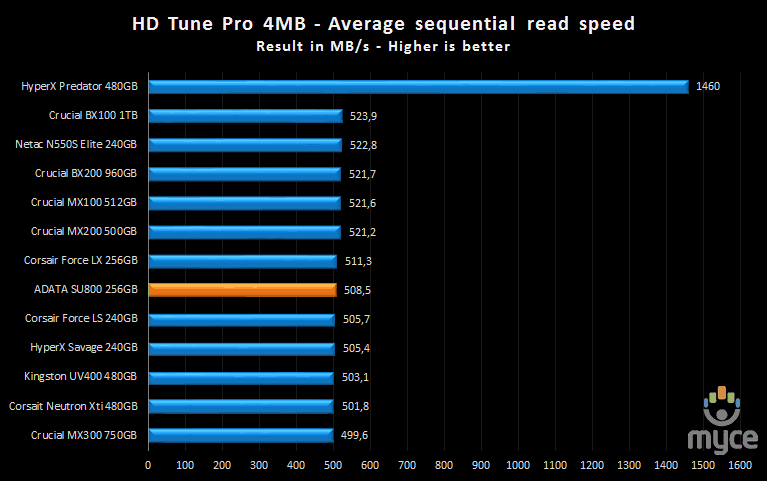
The ADATA SU800 256GB SSD gave a very good
result in this test.
ATTO disk benchmark
ATTO has become a standard tool for
measuring the data throughput of HDDs and SSDs. It measures the reading and
writing performance, using different file sizes and block sizes.
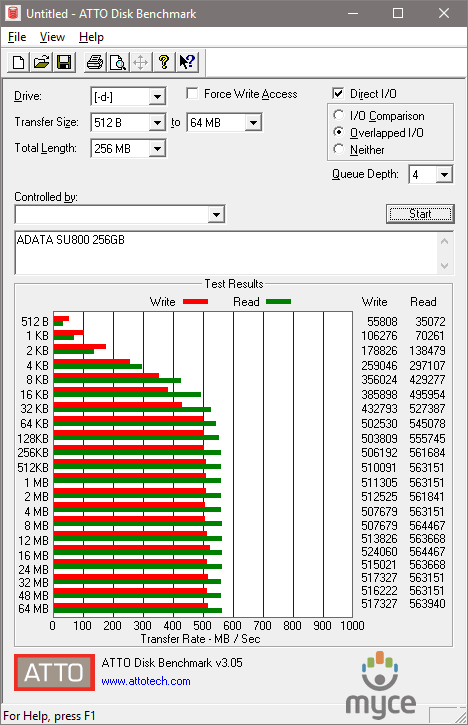
No surprise here, the ADATA SU800 256GB
verified all the numbers that the drive should be capable of achieving.
CrystalDiskMark 3.0
CrystalDiskMark is quite a handy
benchmarking application, as it focuses on the file sizes that can cause problems
for a system drive.
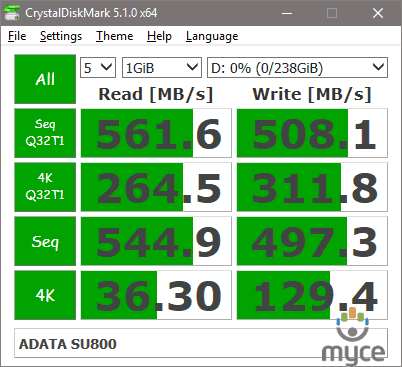
Once again the result is very good for the
ADATA SU800.
The two graphs below will give a more
detailed view of how the ADATA SU800 256GB SSD compares with other SSDs that I
have tested.
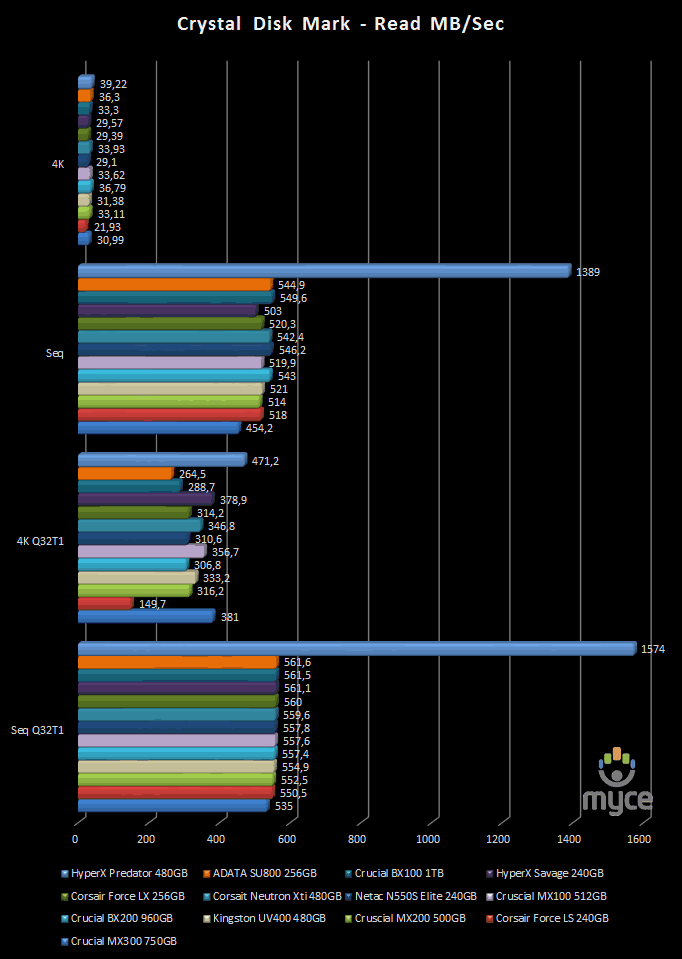
Here I present the graph for the read speed
tests. You can compare the ADATA SU800 performance with other drives I have
tested.
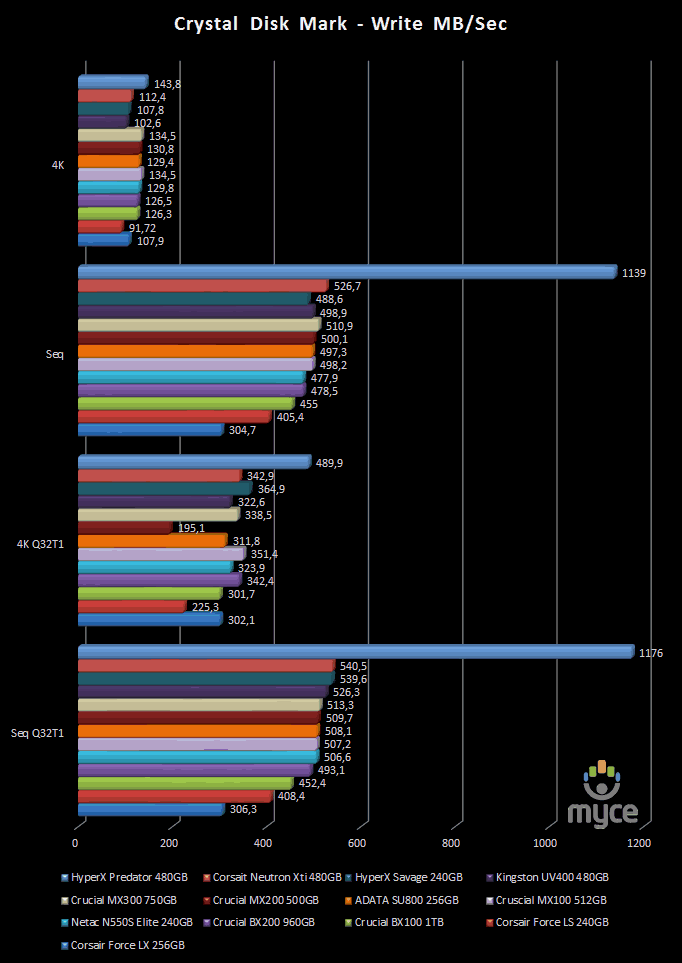
Finally, the results for the ADATA SU800
256GB SSD for write speed, and again you can compare it with other drives.
AS SSD Benchmark
AS SSD benchmark is a benchmarking tool
specifically designed to test SSDs. The application tests sequential reading
and writing performance, 4K random reading and writing performance.
AS SSD benchmark also tests 4K threaded
performance. This is very exciting, as this test is the first available test
that I am aware of, that simulates how a PC operating system actually works. A
modern PC and OS, such as Windows Vista/7 does not just run a single thread at
a time, it runs many threads. The AS SSD benchmark "4K 64Thrd" tests
run 64 threads simultaneously throughout the test. If this result is good, then
you can be pretty sure the drive will perform extremely well as a system drive.
After the tests complete, AS SSD benchmark
derives a total score for the drive being tested. This is based on all aspects
of the test results, and gives an indication of how the drive is performing
overall.
Now let’s look at the results for the ADATA
SU800 256GB SSD in the form of a screenshot. All our other comparison drives’
results are presented in the form of a graph.
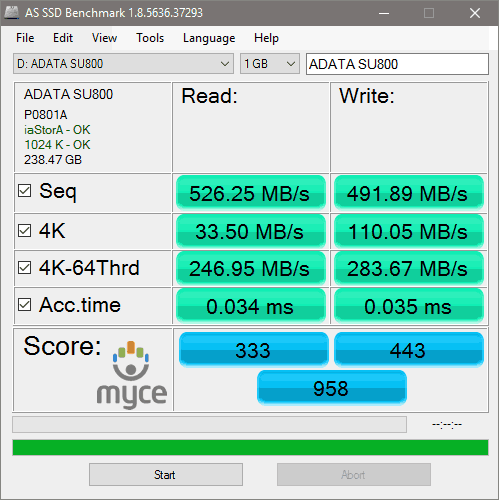
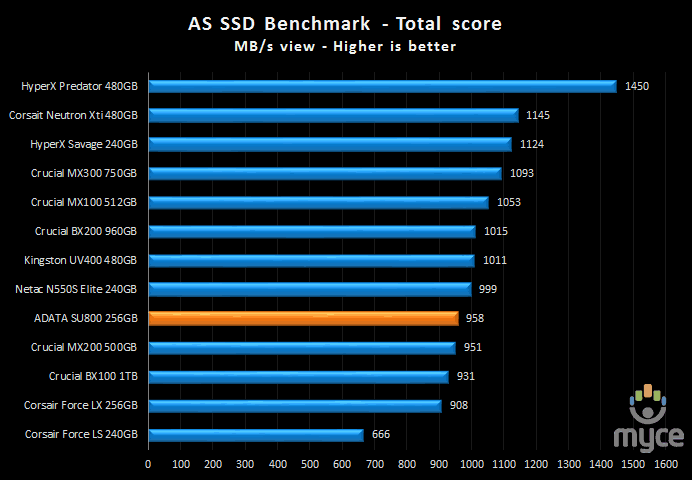
The total score puts the ADATA SU800 below
the middle of the chart, but for a 256GB SSD the result is very good.
Let's head to the next page and run some
tests using PCMark 8.....
PC Mark 8 - HDD Suite
We have built quite a close relationship
with FutureMark software, the authors of the PCMark PC benchmarking software
that we use in our tests. I decided I would use PCMark Vantage as stopgap
measure until the more up-to-date PCMark 8 benchmarking suite became available.
I'm pleased to say that PCMark 8 is now available, and it gives me great
pleasure to introduce you all to the results obtained by this new 'real world'
benchmarking suite.
I will describe the basic way that each
test is carried out, above the graph for each test.
PC Mark 8 HDD suite results
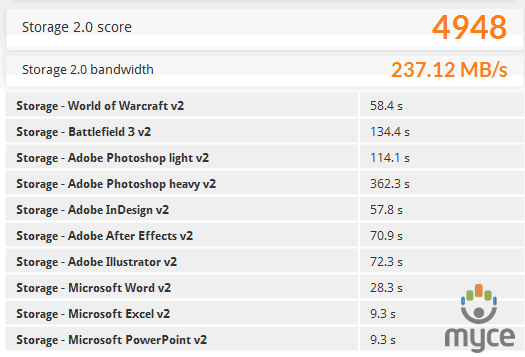
Here
is a screenshot displaying the results for the ADATA SU800 256GB SSD.
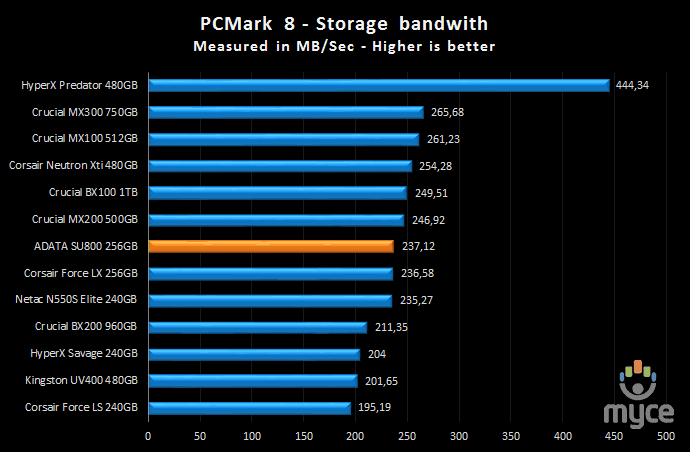
We can see form the above chart that the
performance of the ADATA SU800 is very good, especially for its size.
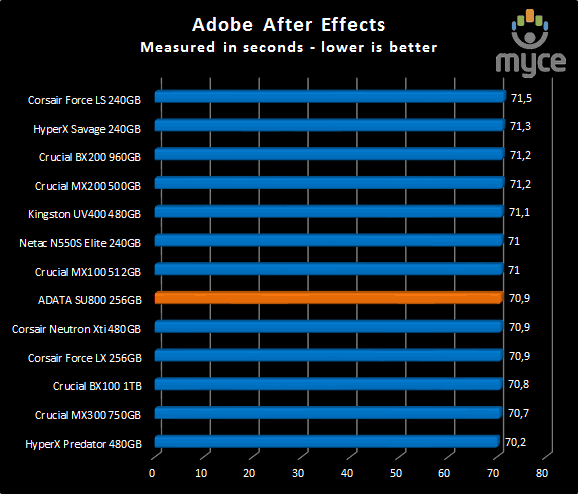
The
result for the After Effects test.
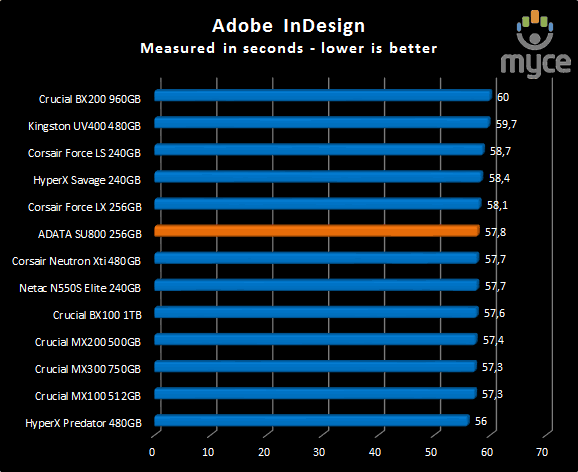
The
result for the InDesign test.
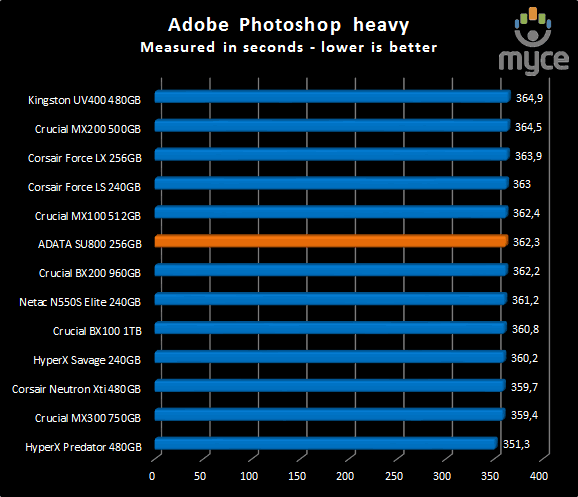
The
result for Photoshop heavy test.
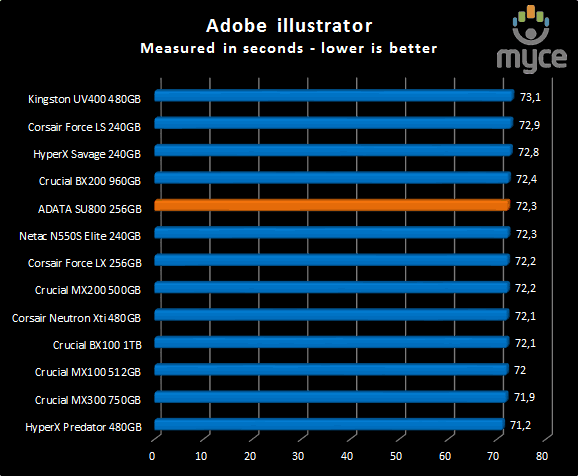
The
result for the Illustrator test.
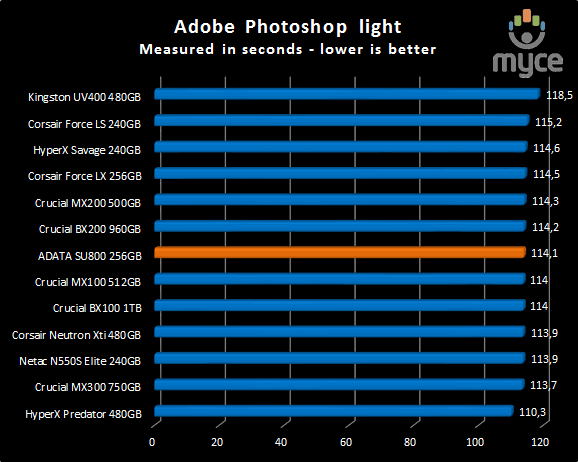
The
result for the Photoshop light test.
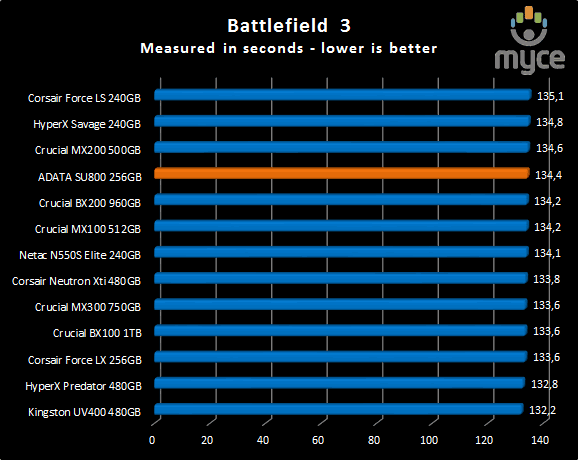
The
result for Battlefield 3.
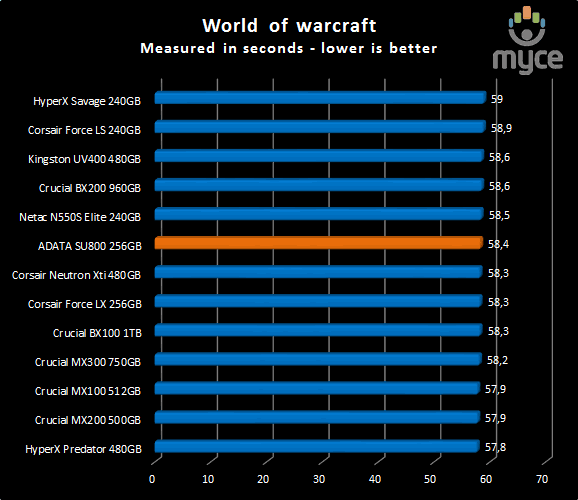
The
result for World of Warcraft.
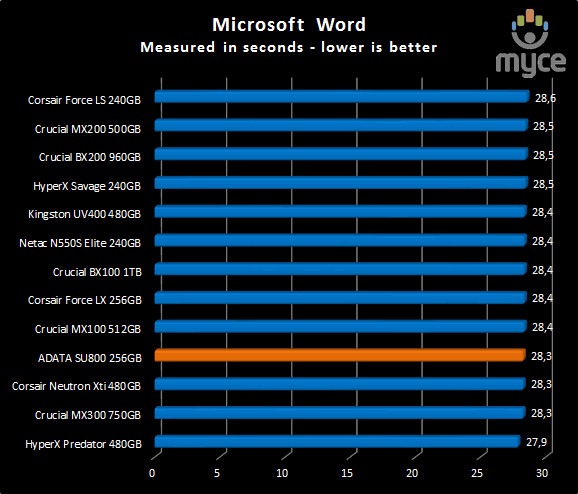
The
result for the Word test.
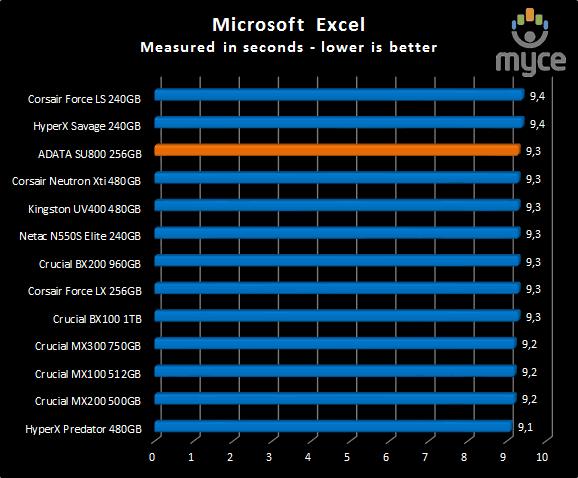
The
result for the Excel test.
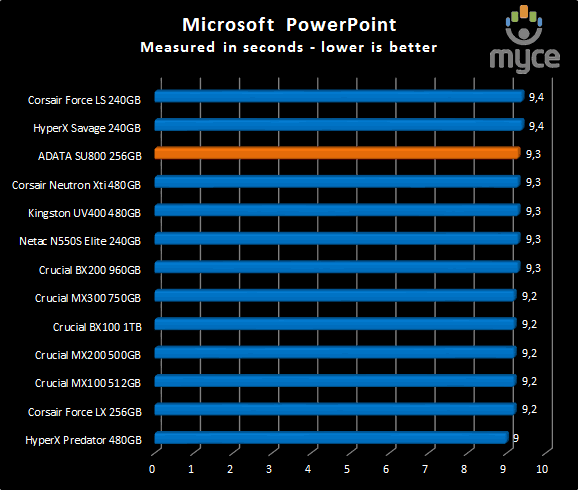
The
result for the PowerPoint test.
Summary:
The ADATA SU800 256GB SSD gave a very good
performance for a 256GB SSD.
Let's head to the next page for our
IOMeter test results.....
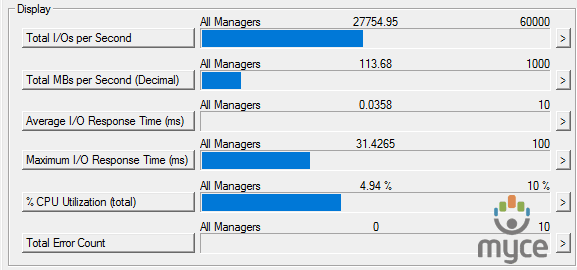
I/O Performance
There is little point of having an SSD
drive that has blazing sustained reading and writing speeds, if the drive can't
handle reading and writing of small random files. If you intend to use your new
SSD drive to store and run your operating system, then the drive must be able
to cope with the many small random files that Windows will write to the drive
continually. So I feel it is very important to test how many of these random
files that a drive can handle in one second. I believe that anything over 1,000
I/O’s per second would be enough for most users running a consumer grade
mainstream PC, and should provide a smooth running system. But obviously, the
more I/O's that a drive can handle, the faster the drive will feel and leave
more headroom for those huge multitasking sessions that users sometimes engage
in.
The things that I will look at are the
total I/O per second and total MB/s.
Partition alignment and sector boundaries
Windows 7 and Vista will automatically
align a partition to 4k boundaries during partition creation, Windows XP won’t.
It is imperative that an SSDs partition is aligned. Windows XP is also
restricted to sector boundaries, while Windows 7 will use 4k boundaries if it
can. The ADATA SU800 256GB SSD is 4k boundary aware, and will use these
boundaries if possible. Of course it will also remap LBAs for compatibility
with the sector boundaries so that the drive can be used with Windows XP.
IOMeter allows us to set the sector
boundaries for conducting the tests, and I have therefore set the sector
boundaries at 4K, which means the IOMeter tests are valid for Windows 7 and
Windows Vista users. XP users will not be able to obtain such results.
I will provide a screenshot of the tests on
the review drive for those of you who like to see the actual test result. All
the comparison drive results are represented in the form of graphs.
If any of you would like to see a
screenshot from any IOMeter test on a particular drive, please feel free to
request one, and I’ll post the screenshot in the forum thread.
All the IOMeter tests create a 10GB data
set on the target drive, and each test is run for a duration of 3 minutes.
IOMeter 4K random write test with repeating data.
The first test involves creating continual
4KB random files on the target drive with IOMeter. I use a 4KB file size, as it
is believed that Windows will create and modify many of this size of file
constantly in the background during a typical Windows session. It is said that
most 4K random writes take place at a queue depth of only one.
Queue depth 1
ADATA SU800 256GB SSD (Queue depth 1)
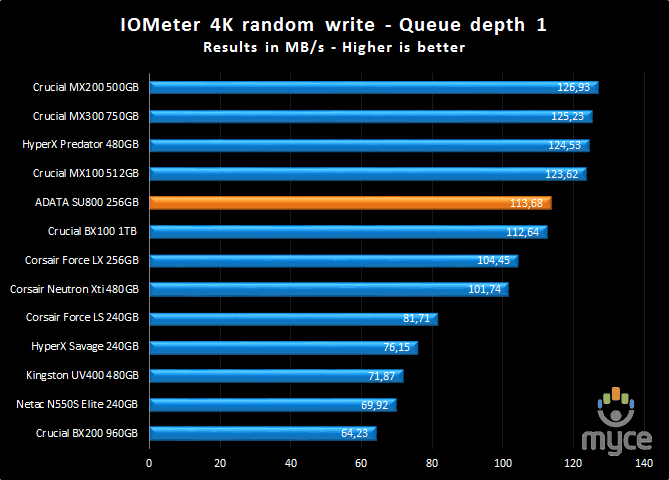
The result is very good.
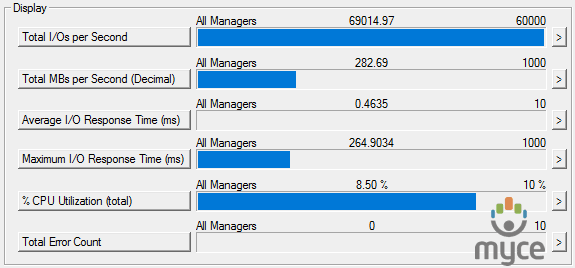
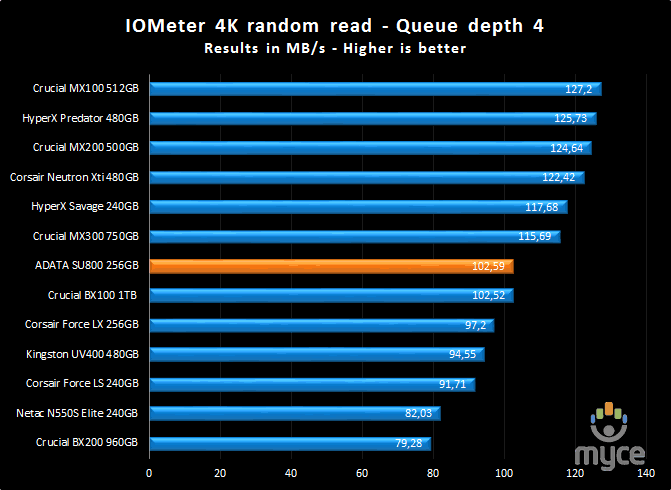
Queue depth 4

ADATA SU800 256GB SSD (Queue depth 4)
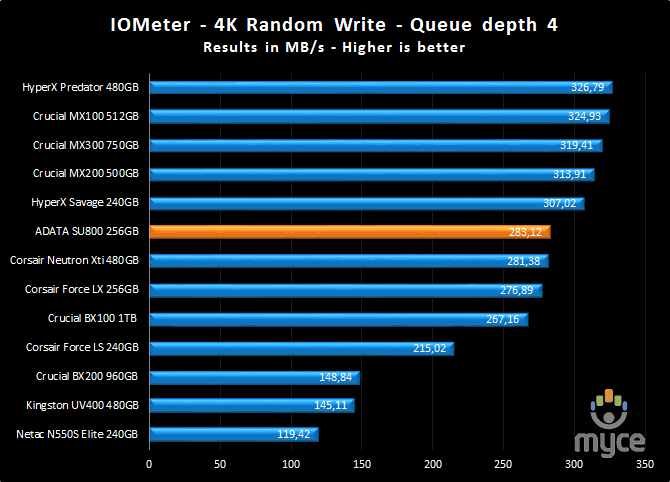
Again the result for the ADATA SU800 is
very good.
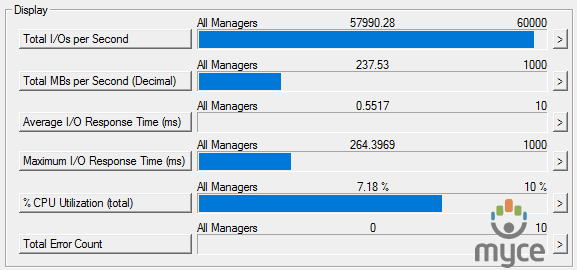
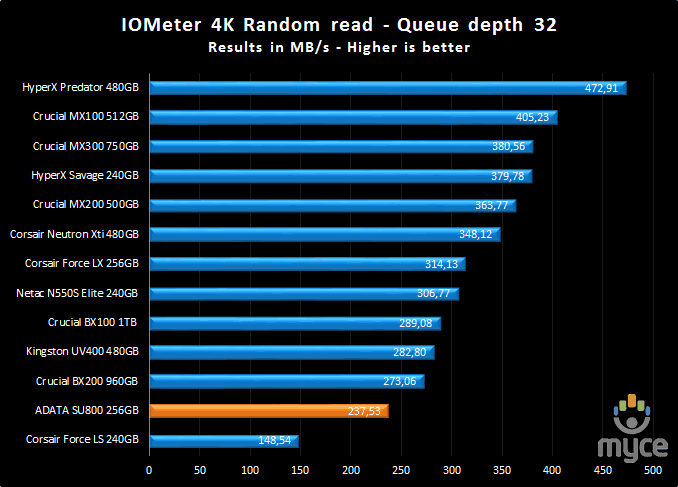
Queue depth 32
ADATA SU800 256GB SSD (Queue depth 32)
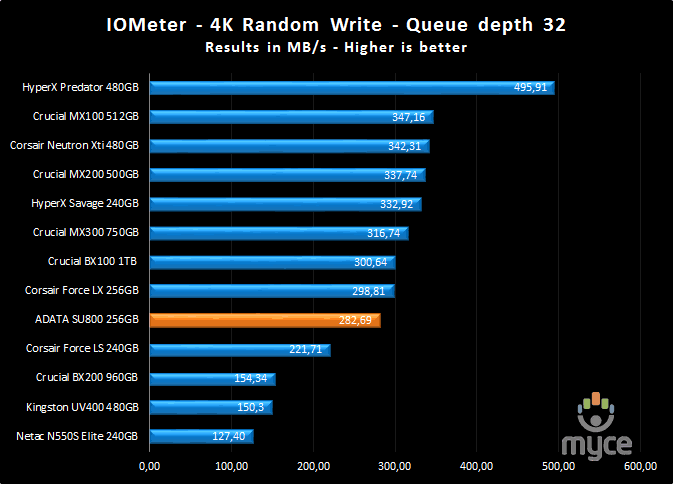
We can clearly see that the drive doesn’t
like high queue depths, but in general most of its use will be for much lower
queue depths from 1 to 4, but still I would like to see a better result .
4K random write queue depth profile
For this
test I used various queue depths from 1 – 32 to give you an idea how this SSD
performs at different queue depths. For a normal desktop user, with lightweight
multitasking, the queue depth will rarely rise above 2. For heavy multitasking,
the queue depth is unlikely to rise above a value of 8.
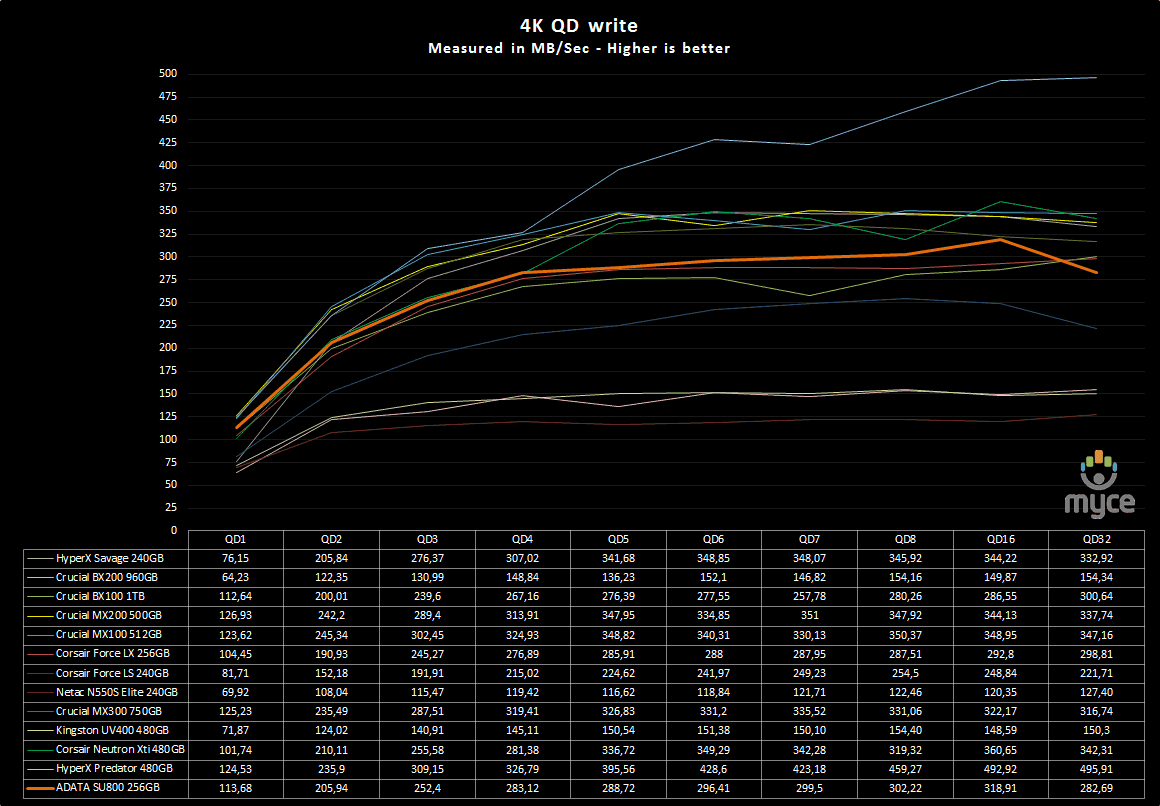
The performance of the ADATA SU800 256GB
SSD is right in the middle of the chart.
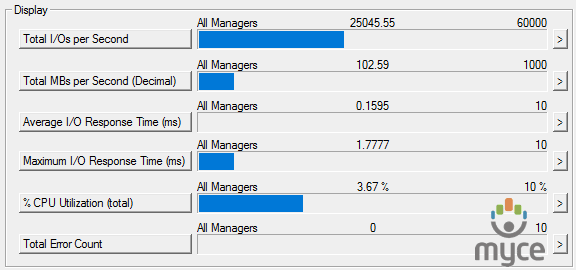
IOMeter 4K random read test.
If there are many 4k files created, then
that must also mean that many 4k files need to be read. This test measures 4k
reading performance.
Queue depth 1
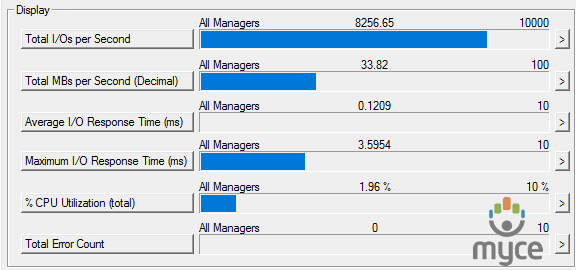
ADATA SU800 256GB SSD (Queue depth 1)
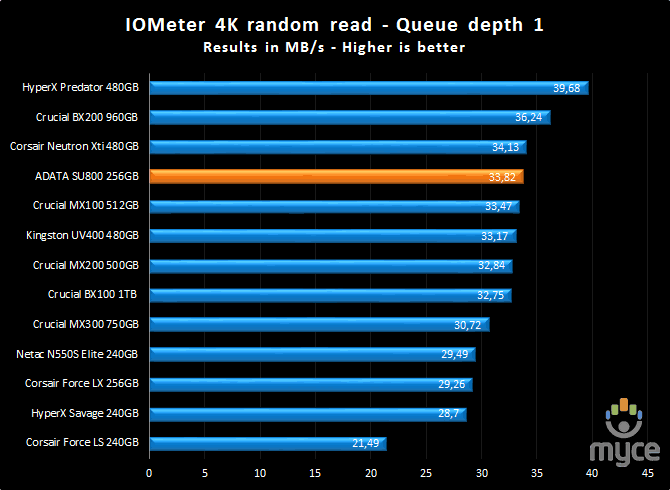
Another very good result to start this part
of the test.
Queue depth 4
ADATA SU800 256GB SSD (Queue depth 4)
The ADATA SU800 gives a good result but a
slightly higher number would be welcomed.
Queue depth 32
ADATA SU800 256GB SSD (Queue depth 32)
Again we can clearly see that the ADATA
SU800 256GB SSD does not like high queue depths. The result is not good.
4K random read queue depth profile.
This test
shows how the review drive scales with increasing queue depths.
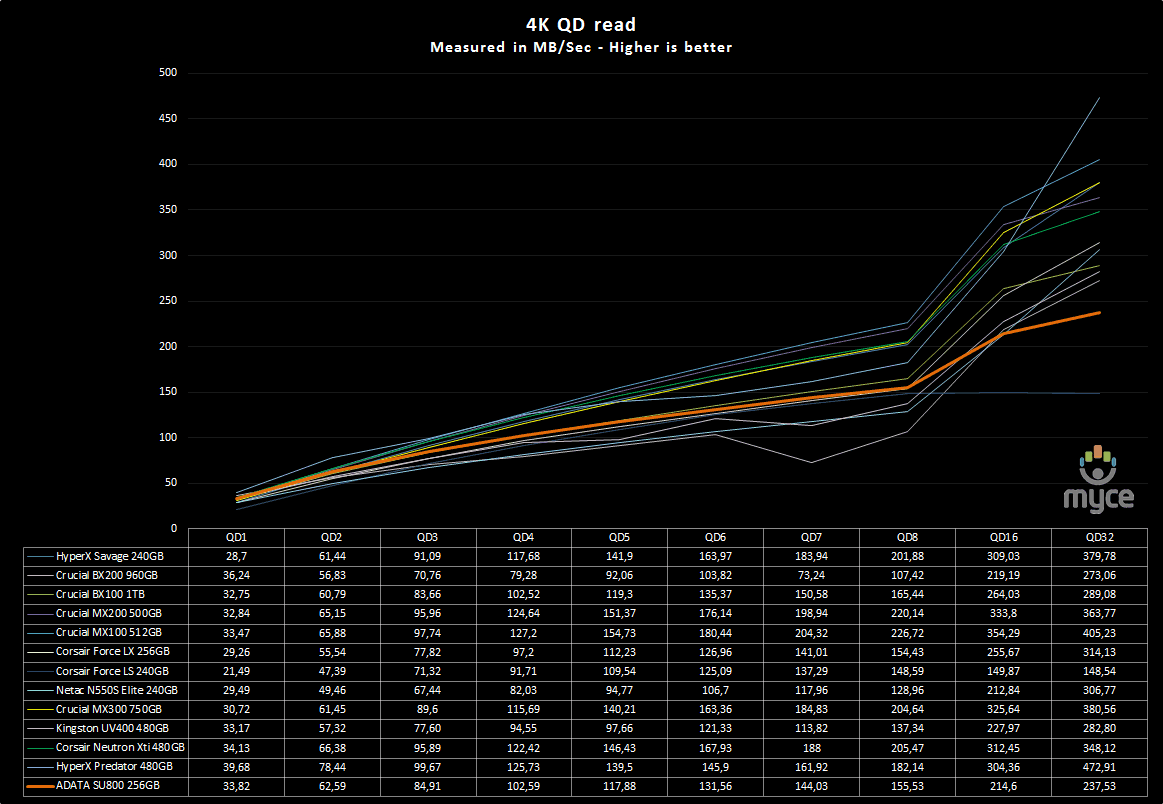
The ADATA SU800 256GB SSD again is the
middle of the chart, and we can see that the drive doesn’t like the high queue
depths.
IOMeter 512KB write test with repeating data.
Sequential writing performance is also very
important, and in this test I will be measuring the sequential writing
performance of the drive.
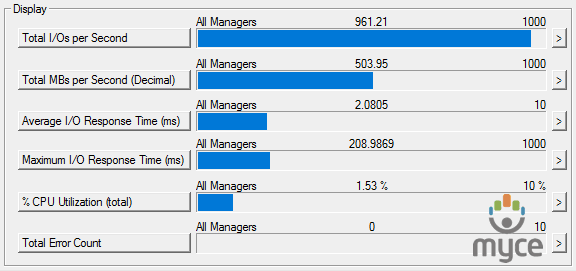
ADATA SU800 256GB SSD - 512K Sequential write with repeating data
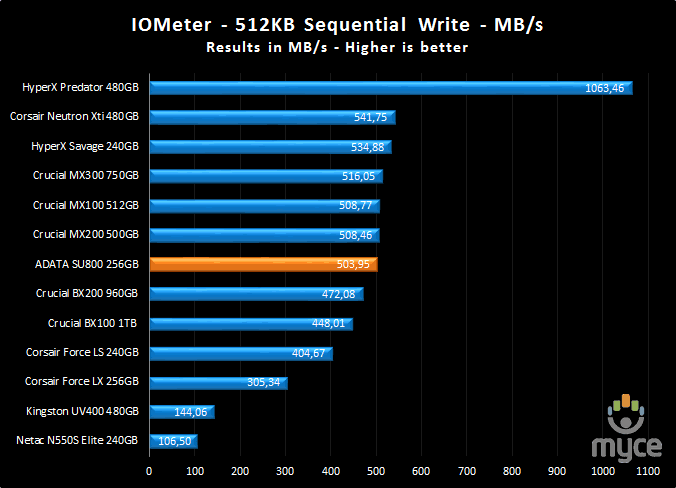
The result is very good for a 256GB SSD.
IOMeter 512KB read test.
This test measures 512k sequential reading
performance.
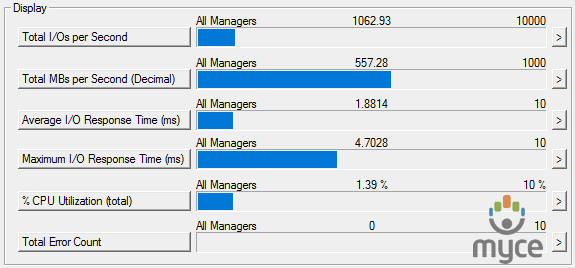
ADATA SU800 256GB SSD – 512K sequential reading test
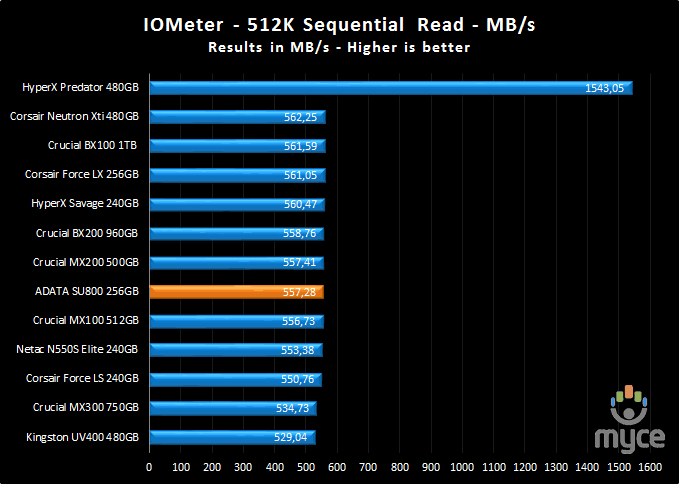
Sequential read data is the part of these
tests where the drive shines. 557.28MB/Sec is an excellent result.
IOMeter Workstation simulation (outstanding I/Os = 64).
When running applications you will find
that there is a mixture of small random files and larger sequential files,
being created and read. Not only that, it isn’t just one file at a time. In
this test I measure a simulated workstation pattern, with a queue depth of 64
(threaded).
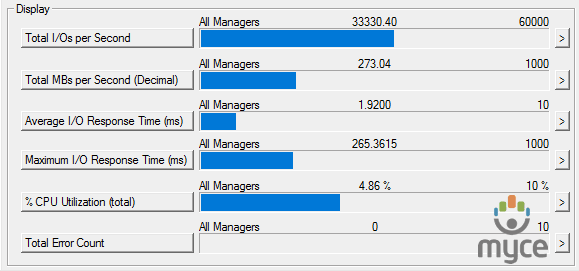
ADATA SU800 256GB SSD – Workstation simulation
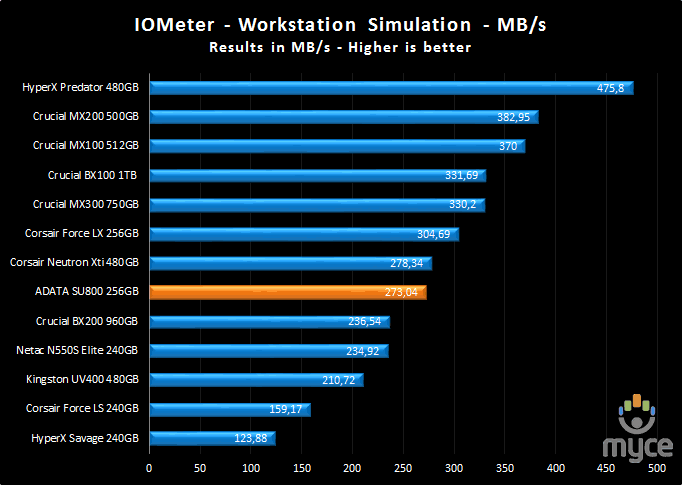
The result is good for the ADATA SU800
256GB SSD.
Summary
The performance of the ADATA SU800 256GB
SSD is good with random data but as queue depths increase the performance stays
the same. The sequential results were both very good.
Now let’s head to the next page where we
will look at how the ADATA SU800 256GB SSD performs using Anvil's Storage
utilities....
Anvil’s Storage Utilities
As well as performing SSD endurance tests.
Anvil’s Storage Utilities has a very nice SSD benchmarking application. The SSD
benchmark tests many different aspects of SSD performance, including 4K random
at different queue depths, and also sequential performance, but more importantly
than this, all using real test data.
Another very nice feature of Anvil’s SSD
benchmark is the fact that you can change the compression levels of the test
data. The compression levels of the data sets used for the tests can be varied
from 0% compression right up to 100% compressed data, and there are even a few
data profiles already included, such as database (8%) compression, and also an
application profile (46%) compression, which is designed to simulate real
application data being read and written to the SSD.
Anvil’s Storage Utilities is still in beta
at the moment, but the application is currently solid enough to use in this
article, and I have already verified the results obtained using an SATA
analyser.
I will include a screenshot of the review
drive, and all comparison results will be presented in the form of graphs. If
you would like to see screenshots of the test results obtained on the other
SSDs in this article, you can do so by following the link here.
I will also be testing three different
compression profiles, which are as follows.
- 0 fill (100% compressible data)
- Application simulation profile (46%
compressed) - 100% (non compressible data)
So let’s begin the tests.
0 fill
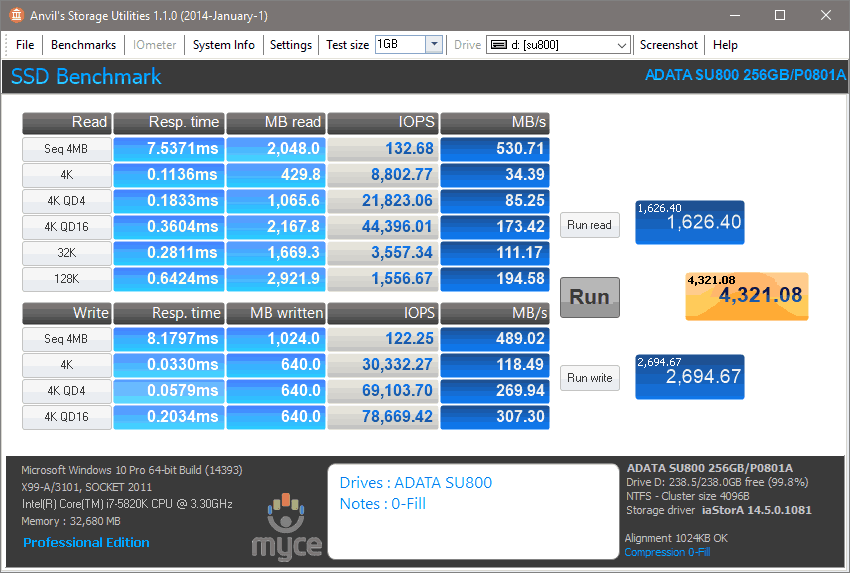
ADATA SU800 256GB SSD (0 fill)
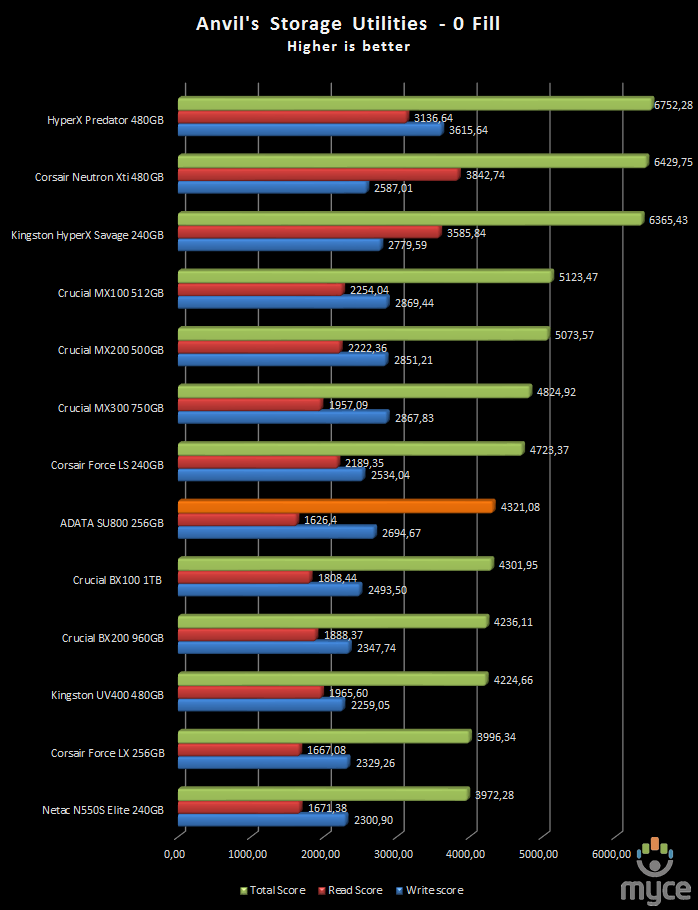
Results
are ranked by highest total score.
A very good result for the ADATA SU800
256GB SSD.
Application profile
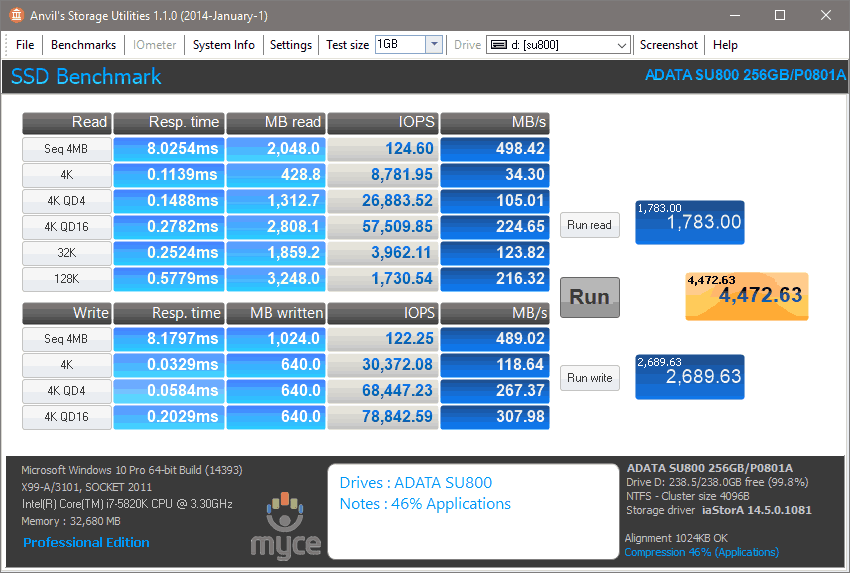
ADATA SU800 256GB SSD (application profile)
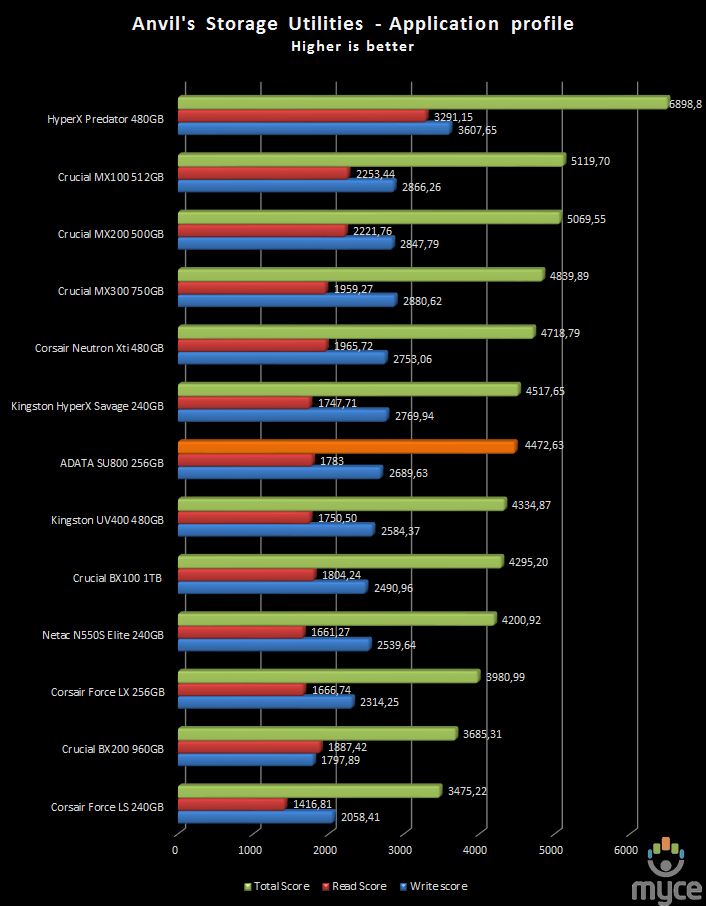
Results are ranked by highest total score.
Again the result is very good, and this
mainly has to do with the impressive write performance of the ADATA SU800.
100% incompressible
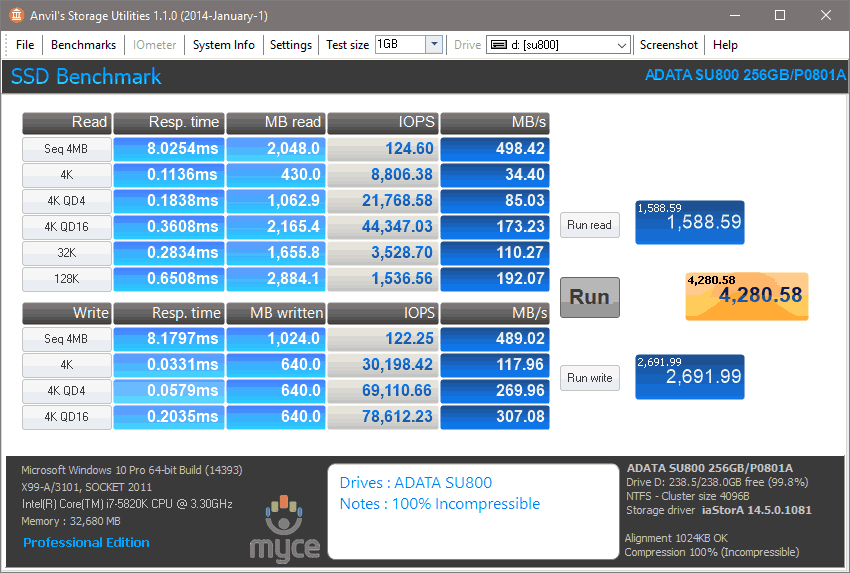
ADATA SU800 256GB SSD (100% incompressible)
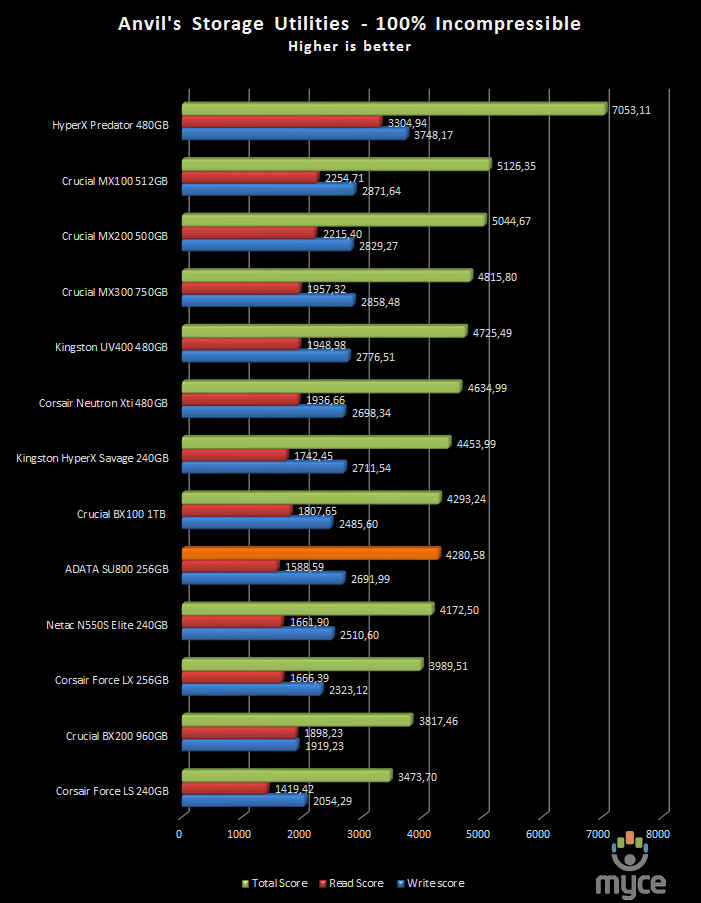
Results are based on the highest total score.
Incompressible data is not the 'favourite
cup of tea' for the ADATA SU800 256GB SSD, but still the result is good.
Summary
The ADATA SU800 256GB SSD manages to deliver
some very good results and all this mainly because of its read performance.
Now let's head to the next page for some
real world tests....
It has become clear that simply conducting
endless benchmarks on SSD drives is pointless. Real users may run a few
benchmarks when they first fit their SSD drive, but most users just want a
drive that performs well in the real world. They want their drive to work
"out of the box" and work fast and smoothly.
Most of the latest SSD drives can deliver
very fast sustained reading and writing speeds, but these alone tell you very
little about how the drive will perform in the real world.
If you intend to use your SSD as your
primary system drive, with an operating system and applications installed and
running from the drive, real world performance becomes much more important than
just fast sequential read and write speeds, in this case I felt that it was
time to move into a different method of testing.
From now on I will only use the log files
from the Event Viewer to measure the start-up and shutdown of the system, and
also use filecopy to measure all my copy tests from a RAM disk to the selected
storage drive that I will be testing. For these tests I will also enable all
power savings features that are available, since I believe that this is the way
that the majority of the users will have them set on their PC.
Real
world copy tests
I will now conduct some real world copy
tests so that you can have a much better view of how the drive will perform. In
these simple tests I try to simulate what a real user does with their drives. I
will be copying some mp3 files, various picture and MKV files, and finishing by
installing MS Office 2007.
As I said earlier from now on all my test
files will be stored in a RAM disk and copied/pasted to the destination drive
using filecopy. The filecopy utility will be used from now on for all my tests,
and I’ll be using it this way to measure the time that it takes to copy the
files.
Before I move on to the test, I want to
give you an idea on how fast your RAM is. Below you can find the results.
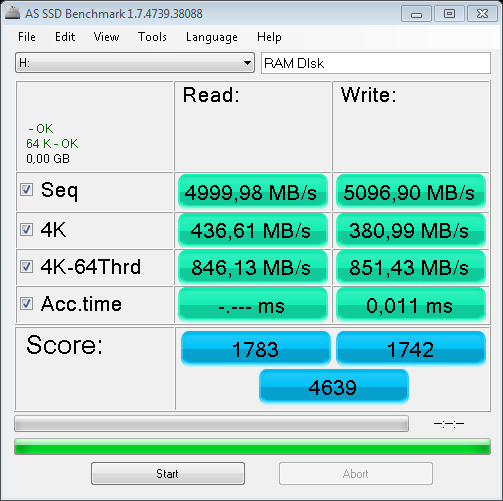
As
we can clearly see speed isn’t going to be an issue in these tests.
Read write tests – 259 MP3 song files (1.36GB total)
I will start this set of tests by copying
259 MP3 files from the RAM disk to the destination SSD and also from the SSD to
the RAM disk.
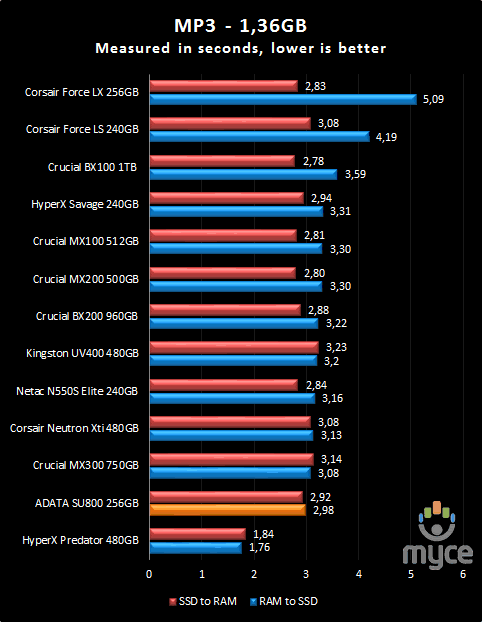
Less than three seconds for both read and
write is an impressive result.
Read write tests – 3,377 JPEG picture files (2.56GB total)
Continuing my set of tests, but this time I
will be copying 2.54GB of pictures that are stored in the RAM disk to the
currently testing SSD and vice versa.
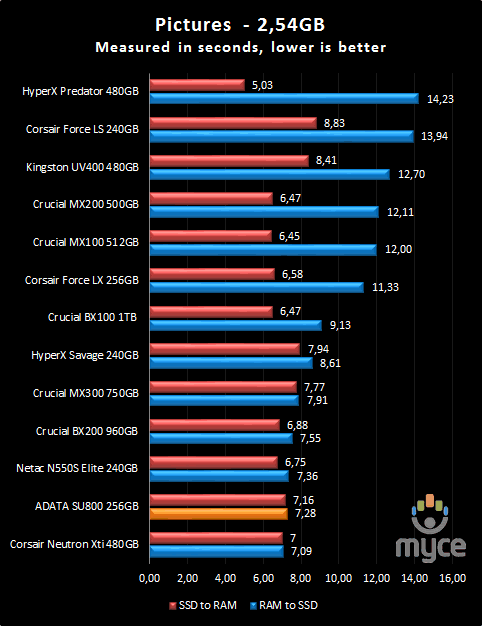
With various small files the ADATA SU800
again gave an impressive result, less than eight seconds for both read and
write tasks.
Read write tests – 1 MKV and 1 SRT file (3.46GB)
Copying a movie is very common task for all
of us, and in this test there are two files that will be copied from the RAM
disk to the SSD and again from the SSD to the RAM disk.
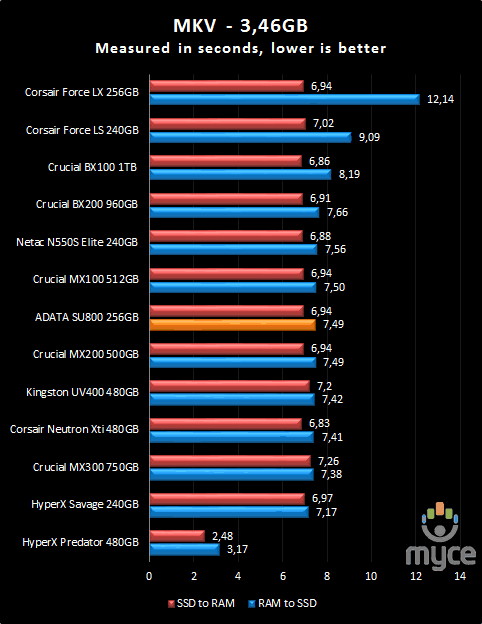
Copying large files should not be an issue
for the ADATA SU800 256GB SSD.
Read write tests – ISO (7927MB)
For this test, I copied ISO of the 'Iron
Man' movie from the RAMDisk to the SSD and vice versa.
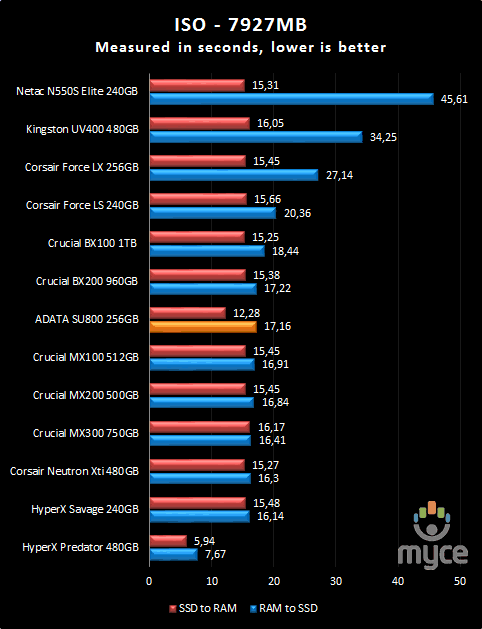
Again the result is very good.
Read write tests – Small files (533MB)
I have decided to adapt the very small
files test that I am using as part of my USB3 flash tests, so this time I will
be also copying all the files from the RAM disk to the SSD, and again from the
SSD to the RAM disk.
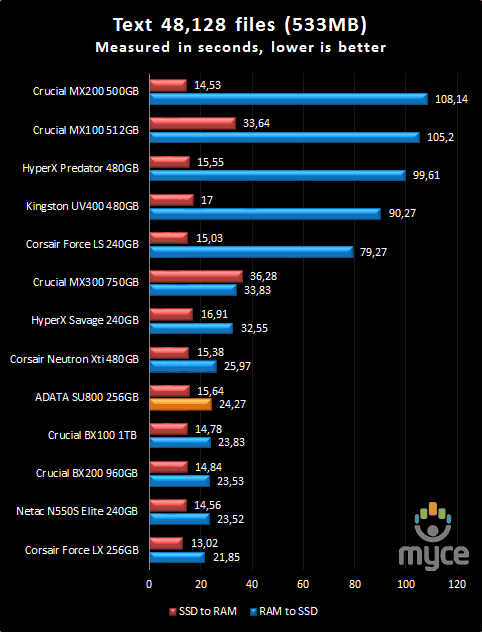
In the event that you need to copy 48,128
files that are a few kilobytes each the ADATA SU800 256GB SSD won't disappoint
you.
Windows start-up based on the Boot Racer 5.00
Start-up time
On the next screen shot you can compare the
current tested SSD and compare it to other drives that I have tested. Below I
present the results.
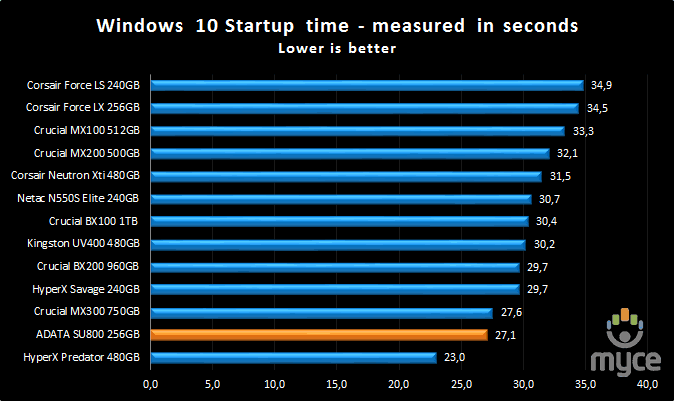
Boot time is also very good for the ADATA
SU800 SSD, and 27.1 seconds is an excellent result. Keep in mind that over time
the boot time will change.
Installing applications
Installing applications is possibly
something you don't do that often. But should you replace your system disk,
then you will most likely have to re-install your applications. Most of the SSD
drives I have tested up until now are quite slow at installing applications,
most likely because their I/O performance was quite limited.
For these tests, we picked some popular applications
and copied the entire contents of the CD or DVD media to the RAM disk. We did
this to make sure that the reading speed of our CD/DVD reader would not hamper
the performance of the target drive.
We then installed these applications onto
our comparison HDD drives, which were all running mirror image installations of
our Windows 7 Home Premium 64-bit installation, and timed the amount of time
taken to install the application with a stopwatch on each of the drives.
MS Office 2007 Enterprise (full install)
Now let’s see
how the ADATA SU800 256GB SSD performs with the installation of MS Office 2007
Enterprise Edition.
The procedure
followed was very simple. I copied all the files from the CD to the RAM disk and
used the virtual drive as a source for the installation files.
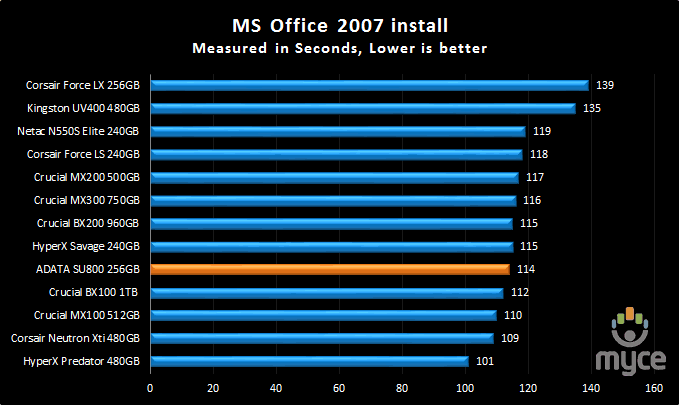
114 seconds is all the time that the ADATA
SU800 needed to install Office 2007.
Speed degradation after heavy testing
On this page I will measure how the SSD
performs after heavy testing and usage.
I will run an AS SSD benchmark test when
the OS is freshly installed so that we can get a good view of how the drive
performs with the OS. After that I will fill the drive up to 50% of its
capacity, use the drive for a few days, and then re-run the AS SSD benchmark.
The same procedure will be followed once again, but this time the drive will be
filled close to 90% or higher of its capacity. To finish this test, I will
simply delete all the extra data and leave the PC idle for a few hours so that
the controller has the time to perform any necessary cleaning, then see how the
drive performs.
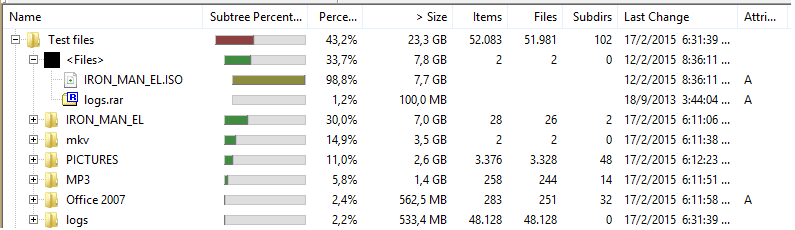
In this picture you can see the test files
that I will be copying to fill the drive with data, as you can see files vary
from 8GB ISOs to very small text files.
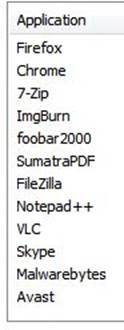
In the picture below you will find all the
applications that were installed for this test using Ninite, and I have also installed Microsoft
Office 2007.
Now let’s start our tests.
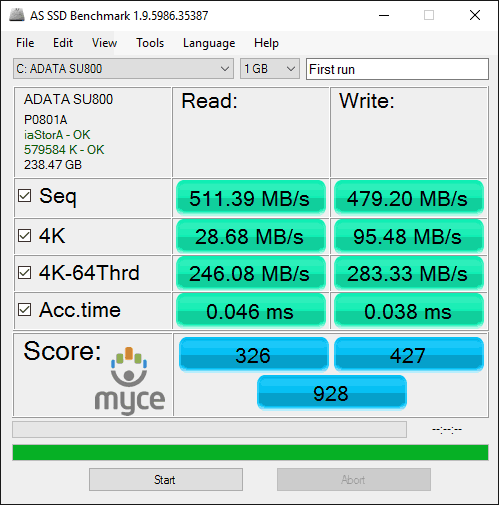
This is the first run of AS SSD, right
after the fresh installation of Windows 10 Professional and with all the
default settings. The result is very good.

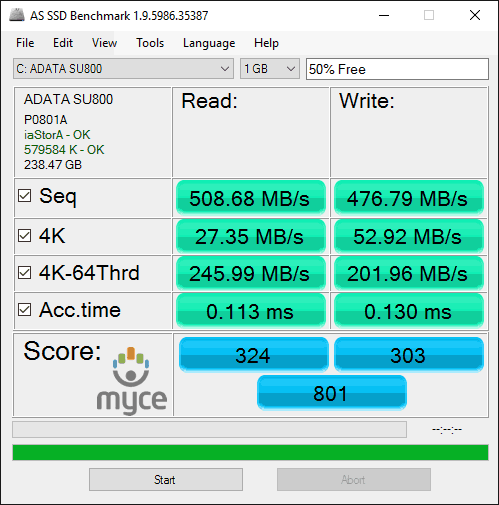
It is crystal clear that the ADATA SU800
SSD does not like to have less than 4GB of free space, as it shown from the
above result. So I would either leave some unallocated space on the drive to be
used as over-provisioning or avoid filling the drive to its maximum capacity.
After deleting a lot of the extra files and
leaving the drive to idle for almost 20 minutes, we can see that the results
are starting to go up, but here there is a lot of room for improvement.

With all the extra files deleted, and
allowing it to run idle for a few minutes the results are slightly higher but
not consistent. Maybe a future firmware update will solve this.
Write Speed test
At this moment I would like to say HD Tune
write speed test was the very first test that I ran on this drive right after I
got it out of the box, and from looking at the result it was obvious that it
wouldn’t be very difficult to push it to its limits.
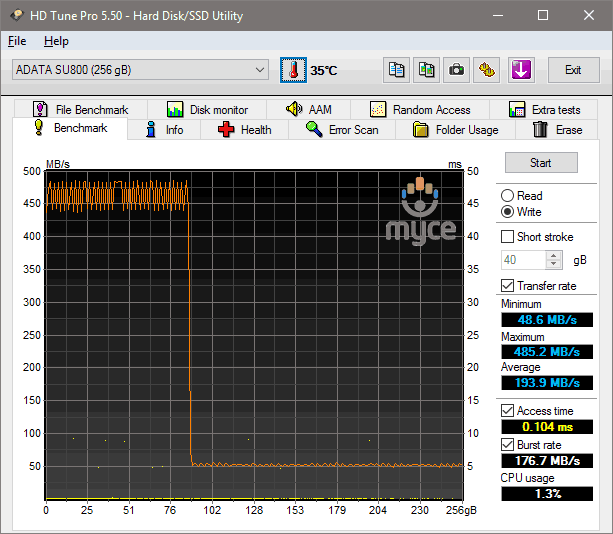
It is clear that the ADAT SU800 256GB SSD
can be a very slow drive once its cache is used, so writing large files for a
long period of time is not recommended.
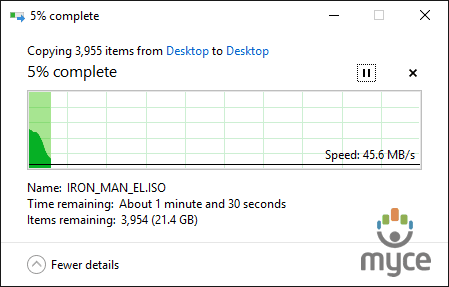
During my real world tests I needed to copy
a lot of files, and noticed that the drive will reach maximum write speeds of
45MB/Sec to 60MB/sec when copying large files. Below is a screen-shot that I
took during the copying of various files from one folder to another, on the
same drive.
This concludes our review. To read the final
thoughts and conclusion, click the link below....
The cons:
I would like to have seen a chassis that wasn't
plastic with an SSD that has the Ultimate name on it, but I can live with that.
The performance of the drive when it comes to write speed can drop to 45MB/Sec
when pushed, and that is very easily achievable so either leave some
unallocated space as over-provisioning or don’t fill the drive to its max.
The pros:
The read performance is a plus, especially with
the lower queue depths that most of us will be using on a daily basis. The
three year warranty is something that is welcomed, together with the ADATA SSD
Toolbox that offers more than just what you need to do, and it also has an
excellent PDF that explains everything in a lot of detail.
Real world performance was also very good, and for the brief time that is used
the ADATA Ultimate SU800 I was very happy to report that it worked well, without
any flaws, and made my daily experience trouble free. The drive is available in
different capacities, from 128GB up to 1TB so you have a wide range to choose
one from that fit your needs. Prices as always will vary but at the time that
this review was published the 256Gb drive could be found on amazon.de
for 81 Euro, on amazon.co.uk
for £63.22, and here in Greece you can find it at a starting price of 83
Euros.
To sum up, this is what I would say:
ADATA’s Ultimate SU800 SSD is good for
those looking for a budget upgrade to cover the basic needs, and in return they'll
gain a lot of speed in application loading. The three-year warranty is also
welcomed.
Therefore, I give the 'Good' award to the ADATA
Ultimate SU800.

Thanks to:
|
|
EFD |
|
|
Alex Schepeljanski for |
|
|
|
|
|
FutureMark |
|
|
Quarch |


You may comment on this review here, you
can also post your benchmarks in our forum.


")


