 |
Review: Adata XPG SX8200 480GB NVMe SSD Reviewed by: J.Reynolds Provided by: Adata Firmware: SVN105 |
Introduction
Welcome to Myce’s review of the Adata XPG SX8200 480GB NVMe
SSD (hereafter referred to as the SX8200).
The SX8200 uses Micron’s second generation 64 layer 3D NAND
and Silicon Motion’s SM2262 Controller and Adata promises an outstanding level
of performance to satisfy the demands of the PC enthusiast.
The use of SLC caching plus a DRAM buffer does bode well so
please read on to see what we make of the SX8200.
In recent months Microsoft and Intel have acted to secure
users against the security vulnerabilities arising from the ‘Meltdown’ and
‘Spectre’ flaws. Whilst this is good news the patches do appear to have an
adverse affect upon storage performance. As part of this review we briefly
assess the impact upon my Windows 10 Desktop PC test system (please see next
page).
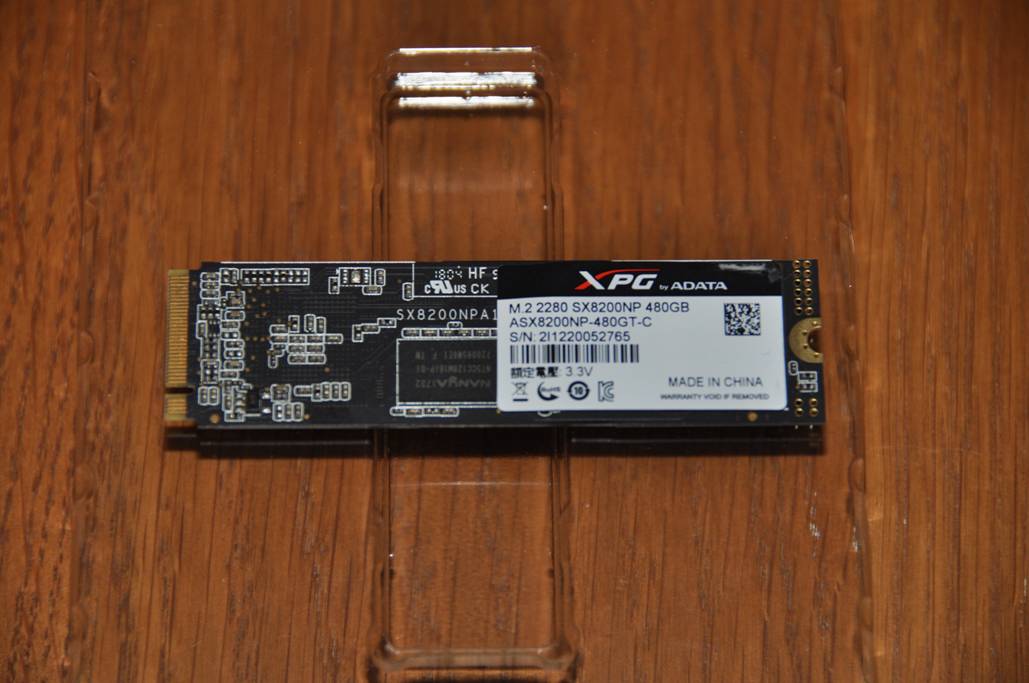
Packaging
To get started let’s have a look at the SX8200’s packaging -
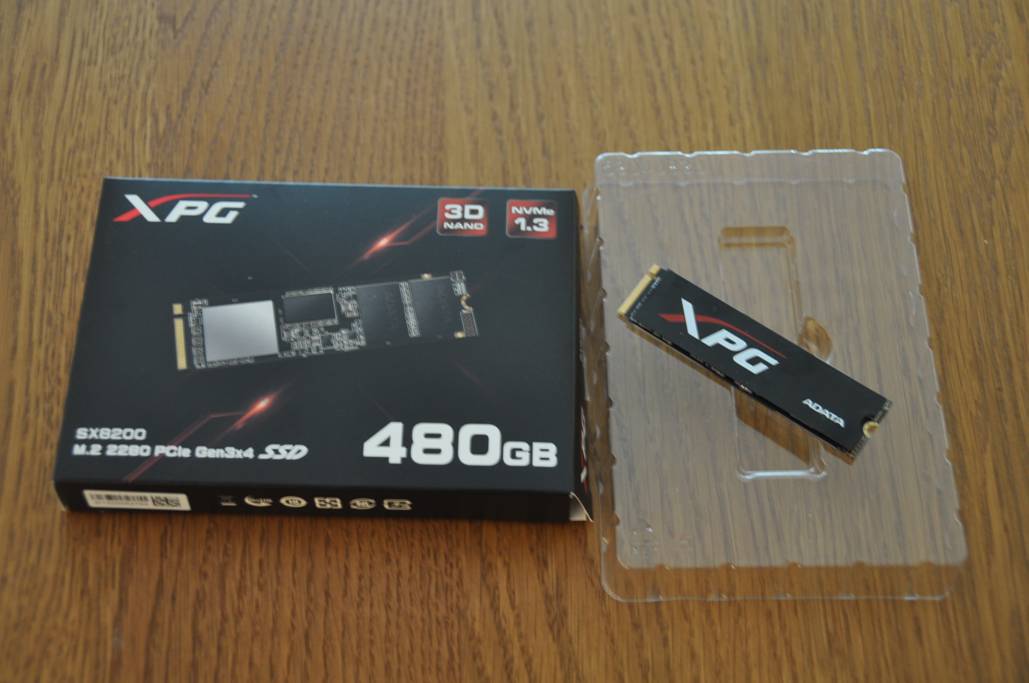
The SX8200 is supplied with a heat spreader. In the picture
on the box cover the heat spreader has not been applied but it has been applied
to the drive sitting on the plastic container. Attaching the heat spreader is
very straight forward. Use of the heat spreader is optional, but I feel you are
well advised to use it in a desktop PC.
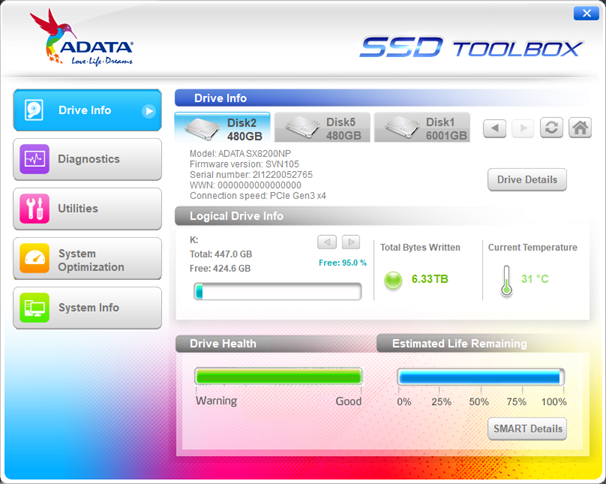
Adata provides a useful SSD utility, which can be downloaded
from Adata’s website; here is a screenshot to show the functionality it
supports –
Adata also provides a license to use Acronis True Image,
which can be used to migrate the contents of an old drive.
Market Positioning and Specification
This is how Adata positions the SX8200 –
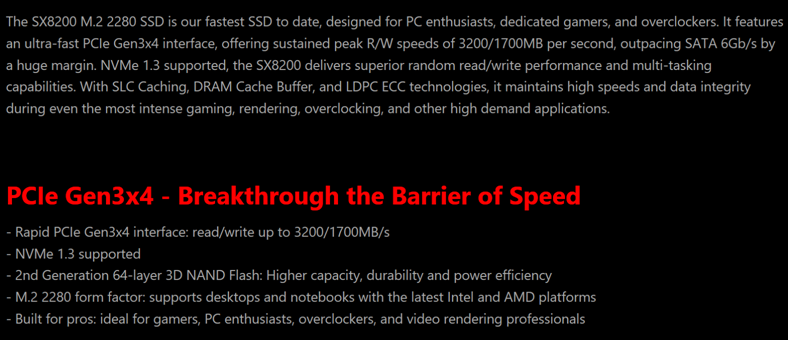
Here is Adata’s specification for the SX8200 –
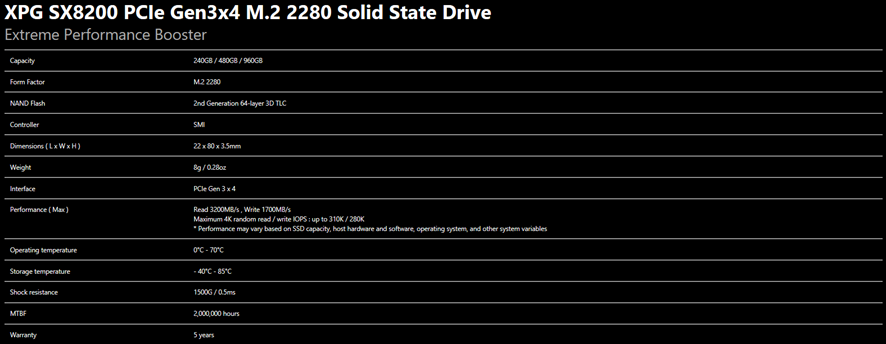
Adata does not specify an endurance level!
Now let's head to the next page, to look at the impact of
Intel’s and Microsoft’s ‘Meltdown’ and ‘Spectre’ fixes.....
NEW PAGE
NEW PAGE NEW PAGE NEW PAGE
‘Meltdown’ and ‘Spectre’ – a Brief Impact Assessment


Here’s a brief introduction into the Meltdown and Spectre
security issues, taken from www.meltdown.com
-
Meltdown and Spectre exploit critical vulnerabilities in
modern processors. These hardware vulnerabilities allow programs to steal data
which is currently processed on the computer. While programs are typically not permitted
to read data from other programs, a malicious program can exploit Meltdown and
Spectre to get hold of secrets stored in the memory of other running programs.
This might include your passwords stored in a password manager or browser, your
personal photos, emails, instant messages and even business-critical documents.
Meltdown and Spectre work on personal computers, mobile
devices, and in the cloud. Depending on the cloud provider's infrastructure, it
might be possible to steal data from other customers.
Meltdown breaks the most fundamental isolation between
user applications and the operating system. This attack allows a program to
access the memory, and thus also the secrets, of other programs and the
operating system.
If your computer has a vulnerable processor and runs an
unpatched operating system, it is not safe to work with sensitive information
without the chance of leaking the information. This applies both to personal
computers as well as cloud infrastructure.
Spectre breaks the isolation between different
applications. It allows an attacker to trick error-free programs, which follow
best practices, into leaking their secrets. In fact, the safety checks of said
best practices actually increase the attack surface and may make applications more
susceptible to Spectre
Spectre is harder to exploit than Meltdown, but it is
also harder to mitigate.
Fortunately for my Z170 based Windows 10 test system Microsoft
and Intel have released patches to counter the threat of Meltdown and Spectre. Applying
the patches involved updating to the latest release of Windows 10 and updating
to the latest BIOS (which also applied changes to the Intel Management Engine
microcode).
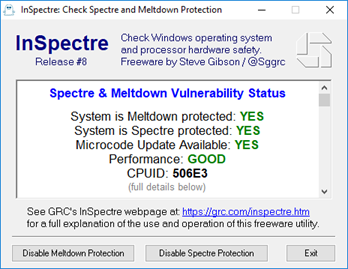
I was recently made aware of the availability of the
InSpectre utility (credit the Facebook SSD NAS and Storage Discussion Group)
that you can run to check if your Windows system is vulnerable to Spectre and Meltdown.
Here is a screen shot of the result from running InSpectre on my patched
Desktop PC test system –
To assess the impact of Meltdown and Spectre patches upon
storage performance in my Windows 10 based test system, let’s have a look at
some Before patching and then After patching tests run on an Intel 750 400GB
NVMe SSD –
Synthetic Tests -
AS SSD
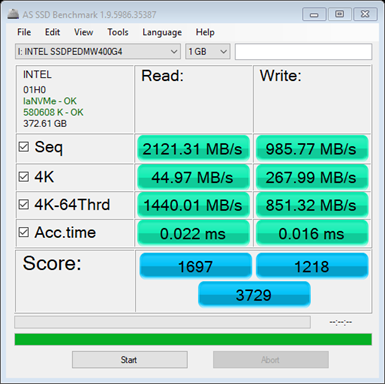

You can see that the Random 4K Queue Depth 1 results,
particularly the Writes, have fallen significantly and the overall score has
dropped by 109 points.
Anvil
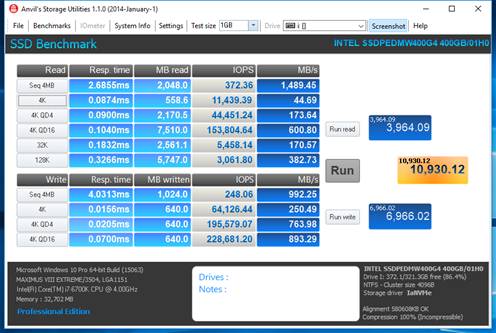
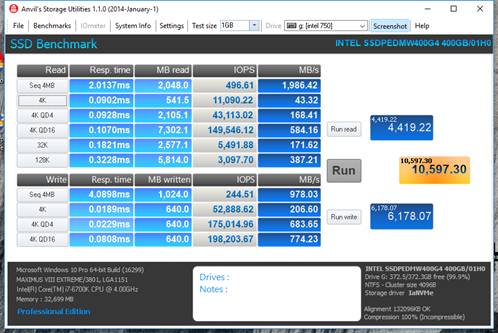
You can see a similar picture with the Anvil benchmark,
particularly a fall in the 4K Writes, and the overall score has fallen by
3332.82 points. Interestingly an increase in Seq 4MB read speed is apparent.
Crystal Disk Mark
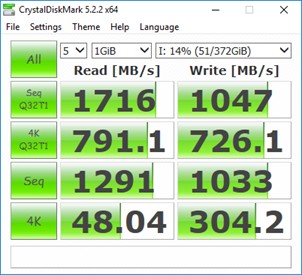
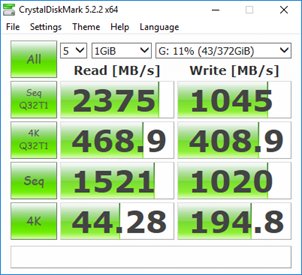
Again, we can see a significant drop in 4K Read and Write
speeds and an increase in sequential read speeds is apparent.
Atto
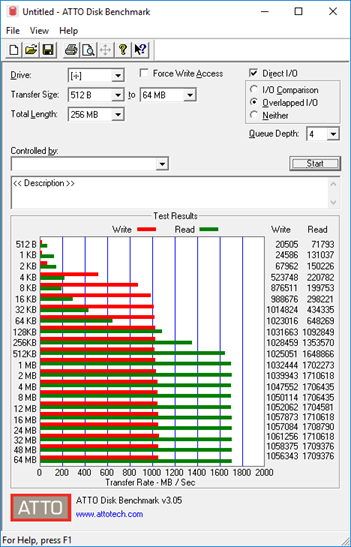
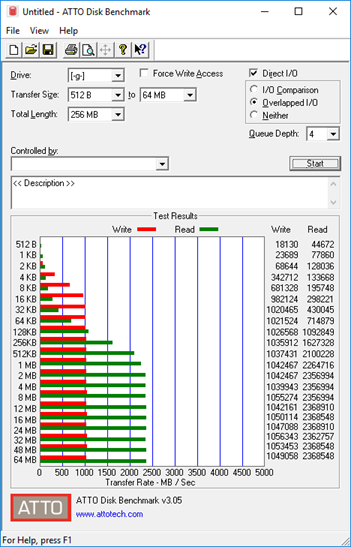
The increase in read speeds for the larger IO sizes is most
apparent here but we do see a drop in write speeds.
Real World Tests
PCMark8 Storage Benchmark
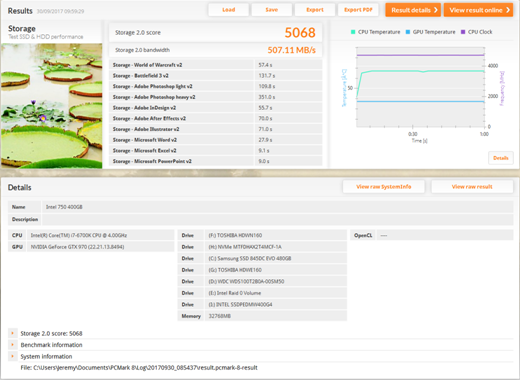
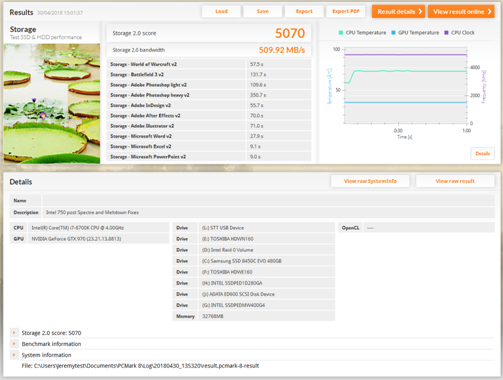
Interestingly, you can see that for the Intel 750 there is
no significant change in the before and after PCMark8 results (indeed the
result has actually improved slightly).
Copy Movie to Intel 750
Copy Movie from Intel 750

Copy Game to Intel 750

Copy Game from Intel 750
Copy JPEGS to Intel 750
Copy JPEGS from Intel 750
You can see there isn’t any significant change in the real
world copy tests, but in most cases performance has got slightly worse.
So, it appears the synthetic benchmarks have been significantly
impacted but the real world tests have not. Rather crudely put, I understand
that the synthetic benchmarks spend a relatively large amount of time hanging
around waiting on the completion of IOs and this area of functionality is affected
by the Meltdown/Spectre patches, and hence why a drop in performance is
apparent.
For storage enthusiasts (like me) this drop in synthetic
benchmark performance is frustrating, however I believe the majority of users
will not feel any adverse impact in their day to day operations.
It appears to me that the impact becomes much more apparent
in ultra high performance drives such as those based on the use of Intel’s
Optane storage technology. For example, my Optane 900P NVMe drive has dropped
from an Anvil overall score of 25,864.78 to 20,566.04. I plan to publish a
review of the Optane 900P 280GB drive in the near future.
I hear there is some hope that Intel and OS providers may
fix the patches’ impact on performance in the future – as a storage performance
enthusiast I hope so.
I realise this is only a brief assessment based on a very
limited sample but I hope it gives readers a feel for the impact.
In this review all of the Windows 10 based performance
results for the SX8200 were taken following the application of the Spectre and
Meltdown patches and in the product comparison charts the Intel 750 scores are
updated to the new post patching values. Please note that no Meltdown and
Spectre fixes have been applied to the OakGate Test Platform.
Now let's head to the next page, to look at my approach
to testing Client SSDs.....
Testing Approach
When reviewing the performance of a Storage solution there
are three basic metrics to look at:
1.
IOPS – the number of Input/Output Operations per Second
2.
Bandwidth – the number of bytes transferred per second (usually measured
in Megabytes per second, ‘MB/s’)
3.
Latency – the amount of time each IO request will take to complete
(usually, in the context of Solid State Storage solutions, measured in
Microseconds, which are millionths of a second).
It is true to say that IOPS and Bandwidth had both been
growing rapidly before the advent of Solid State Storage, but Latency can only
be significantly decreased by eliminating mechanical devices, and thus Latency
is the single most important improvement that Solid State solutions deliver to
enhance performance.
Latency in a technical environment is synonymous with delay.
In the context of a Solid State solution it is the amount of time between an IO
request being made, and when the request is serviced.
Bandwidth, also commonly referred to as ‘Throughput’, is the
amount of data that can be transferred from a storage device to a host, in a
given amount of time. In the context of Solid State solutions it is typically
measured in Megabytes per second (MB/s).
A great Solid State solution offers an effective balance of
all three metrics. High IOPS and Bandwidth is simply not enough if Latency
(the delay in an IO operation) is too high.
Queue Depth is the average amount of IO requests
outstanding. If you are running an application and the Average Queue Depth is
one or higher and CPU utilisation is low, then the application’s performance is
most probably suffering from a ‘Storage Bottleneck’.
It is true to say that a typical PC user will very rarely
cause a modern SSD to see a Queue Depth greater than 1 or 2. So for Client SSDs
we need to primarily focus on performance at low Queue Depths.
Another important aspect to consider with an SSD is the
state of its NAND when an IO task begins. When an SSD is new, or immediately
following a purge (a Secure Erase for an SATA device) being performed, it is in
a Fresh out of Box (‘FOB’) state and in this state all of its Blocks of NAND
are clean and able to immediately accommodate the writing of new data.
Typically SSDs are supplied with a greater capacity of ‘Total NAND’ than their stated
‘User Capacity’ and the difference between them (Total NAND – User Capacity) is
known as an Over Provision (‘OP’) at the firmware level.
If an IO Task that involves writing new data can complete
without the supply of clean blocks being exhausted it will complete more
quickly than if blocks must first be cleaned on the fly before writes can be
accommodated. The number of free blocks available may also impact on performance
(think of it this way - the more free blocks there are the easier it is to find
one to write to). An SSD will continue to write to clean blocks until there
are no more available after which it must then free up blocks by completing an
Erase/Write cycle on the fly before it can write new data. Blocks that have
been written to are flagged as being able to be cleaned when either the logical
address they are associated with in an Operating System is written to again or
when a Trim instruction is sent by the OS to indicate that a range of logical
addresses (which map to physical blocks) no longer contain live data (for
example, in Windows, Trim instructions are sent to an SSD, when a file is
logically deleted, to indicate that all of the physical blocks which contained
the file no longer hold live data).
An SSD’s controller performs a process known as ‘Garbage
Collection’ which gathers together spaces that no longer hold live data so that
it can create clean blocks in preparation for accommodating the writing of new
live data. Blocks are contained within Pages and only complete Pages can be
erased in preparation to accommodate new writes, so one of the responsibilities
for Garbage Collection is to shuffle blocks out of partially filled pages so
that whole pages can then be cleaned. Garbage Collection can be performed as a
regular background task and on the fly. The effectiveness of an SSD’s Garbage
Collection has a significant impact on its long term performance. It is
important to note that a Trim command does not itself clean blocks and it will
always take a bit of time for Garbage Collection to follow up and actually
complete the cleaning process.
An SSD maintains a table, that can be used by an OS, which
holds the mapping of its physical blocks to logical addresses. Effectively,
the OP is increased above that set at the firmware level whilst the drive’s
user capacity is not full of live data. In Windows a user can effectively
choose to underline their commitment to increasing the level of OP by not fully
allocating the drive’s user capacity to partitions.
When a drive is compelled to clean blocks on the fly to
accommodate new data it moves from an FOB state towards what is known as a ‘Steady
State’. A Steady State is achieved when performance is steady and no longer
changes significantly over time. Testing of Enterprise SSDs is always
performed when a drive is in a Steady State. It is fair to say that typically
a Client SSD will spend most of its time in an FOB state (or near to FOB state)
and it's in this state that our testing is performed using the Desktop PC.
Remember though that one can expect to see a performance drop when the drive
holds increasing amounts of live data, as the pool of free blocks (the
effective OP) becomes smaller.
Whilst most Client SSD users need not be overly concerned
about Steady State performance we do push an SSD to its limits as part of our
testing on the OakGate Test Platform.
So what performance characteristics make for an excellent
Client SSD?
Put simply, we look for a solution that provides both
excellent Sequential IO performance and excellent Random IO performance.
Excellent Sequential performance supports the rapid transfer of large amounts
of data from one place to another, such as when copying a movie, loading a game,
or running a backup. Excellent Random IO means that a drive will support the
rapid reading, writing, and updating of relatively small files that are
randomly placed on a drive (such as is required by the Windows Operating System),
the launching of applications, or by a database based application. Sequential
performance is most often measured in terms of MB/s (Megabytes per Second) and
Random IO is most often measured in terms of IOPS (IO Operations per Second).
Modern SSDs deliver low Latency and support tens of thousands of Random IOPS
and whilst very few PC users really need support for such a high level of IOPS
it does mean that every IO will be fast.
Manufacturers most frequently quote the headline maximum
Sequential Read and Write Bandwidth for a drive. They also regularly cite the
maximum IOPS level for 4K Random Reads and Writes. Operating Systems are known
to make extensive use of the 4K IO size and this is why strong 4K Random Read
and Write performance is considered important.
I use two test platforms for testing Client Storage
solutions –
Firstly, a Desktop PC, with the following specification: CPU
– Intel Core I7 6700K, Motherboard – Asus Maximus VIII Extreme (Z170), System
Drive – Intel 750 400GB, GPU – EVGA GeForce GTX970 FTW, RAM – 32GB Corsair
Dominator Platinum, Cooler – Corsair H110i GTX, Windows 10 using Intel RST
15.7.1.1015 and with C States disabled in the BIOS, as this ensures reasonable
consistency from storage benchmarks.
Secondly, an OakGate Storage Test Platform, which is
introduced in an article that you can view by clicking here.
The OakGate Test Platform can be thought as a professional, laboratory
instrument where the test environment is managed strictly and consistently so
that test results from multiple solutions can be compared with great confidence
and precision.
The Desktop PC is used to run a cross section of the most
respected and commonly used storage performance benchmark software, including
AS SSD, Anvil, Crystal Disk Mark, ATTO, and PCMark 8 Storage, together with a
number of real world file copies. Most of these benchmark programs are freely
and easily available for you to run on your own PC. There is a good case for reviewers
to test an SSD as a System Drive, as arguably this is the way in which most
people will use an SSD. However, I choose to test drives as a spare as I
believe this makes it far easier to provide a consistent basis for product
comparisons, which I feel is most important.
The OakGate Test Platform is used to provide an accurate
baseline for a drive’s performance in all of the key aspects of performance,
including Sequential Reads and Writes, Random Reads and Writes, and Random
Mixed Reads and Writes. The OakGate Test Platform is also used to investigate
how a drive behaves when it is pushed to its limits and to measure a drive’s
power consumption characteristics. (All testing on the OakGate Test Platform
is conducted with fully random data and is aligned to 4K boundaries)
In the presentation of test results I include comparisons
with other products I have tested in the same way on the same platforms.
Now let's head to the next page, to look at the results
for the Desktop PC Synthetic Benchmarks.....
Desktop PC – Synthetic Benchmarks
AS SSD
As its name suggests AS SSD was developed specifically to
measure the performance of SSDs. It measures Sequential Read and Write
performance with an IO Size of 16MB and a Queue Depth of 1. It measures Random
4K Read and Write for a Queue Depth of 1 and for 64 Threads. 64 Threads
generates a Queue Depth of 64 (please note that SATA drives support a maximum
Queue Depth of 32, so they are at a disadvantage in this test to NVMe devices,
which support queue depths of 128 or more). The Access Time AS SSD reports is
for 512Byte sequential reads and writes.
The 4K random Reads and Writes performance is particularly
relevant to a drive’s ability to act as a Windows system drive. I use the
default test file size of 1GB.
AS SSD produces a score for Read Performance, Write
Performance and an Overall Score.
The scores are calculated as –
Overall score = (Seq Write x 0.15) + (Seq Read
x 0.1) + (4K Read * 2) + 4K Write + 4K-64Thrd Write + (4K-64Thrd Read * 1.5)
Read score = (Seq Read * 0.1) + 4K Read + 4K-64Thrd
Read
Write score = (Seq Write *0.1) + 4K Write + 4K-64Thrd
Write
For Client SSDs, I feel that there should be an
even greater loading given to the Queue Depth 1 4K Read and 4K Write results
but nevertheless AS SSD is a quick and useful benchmark. I always use a 1GB
test file. We would expect a modern SATA SSD to achieve an overall score
of 1000+.
The latest version of AS SSD can be downloaded here.
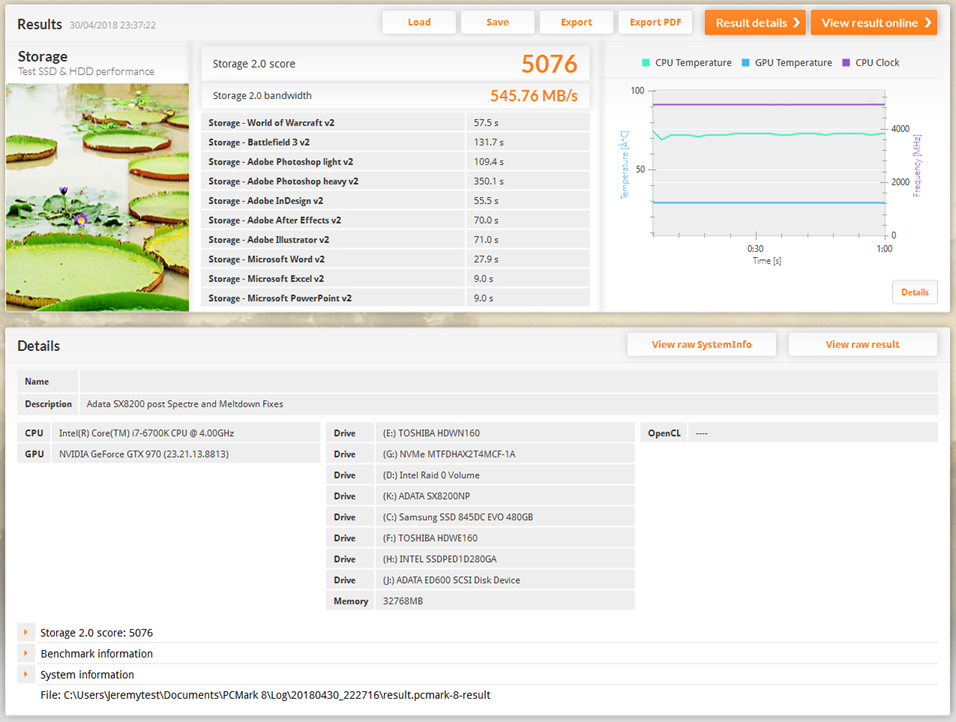
Here is the AS SSD result for the SX8200 -
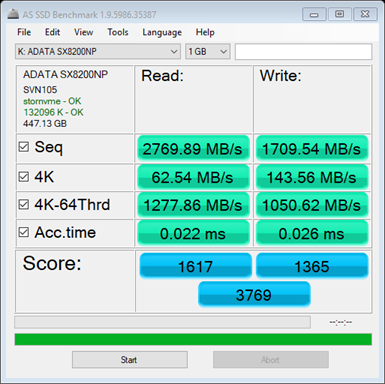
This is an outstanding result.
Here is a comparison of the overall AS SSD score with the
other products I have tested –
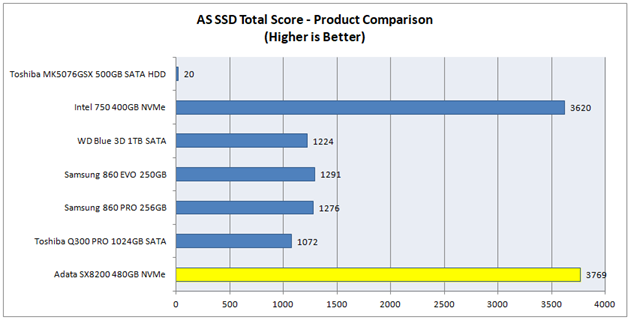
You can see that the SX8200 achieves the highest AS SSD
score in the reviews I have published to date.
Anvil’s Storage Utilities
Anvil’s Storage Utilities tests Sequential Reads and Writes
with an IO Size of 4MB, Random 4K Reads and Writes at Queue Depths of 1, 4 and
16 and Random 32K and 128K Writes.
The scores are calculated as –
Overall Score = Read Score + Write Score
Read Score = (Seq 4MB = MB/s x 1) + (4K = MB/s
x 4.5) + (4K QD4 = MB/s x 2.75) + (4K QD16 = MB/s x 1.75) + (32K = MB/s x 1) +
(128K = MB/s x 1.5)
Write Score = (Seq 4MB = MB/s x 1) + (4K =
MB/s x 4) + (4K QD4 = MB/s x 3) + (4K QD16 = MB/s x 3)
I always use a Test size of 1GB and 100%
Incompressible data.
The latest version of Anvil’s Storage
Utilities can be downloaded here.
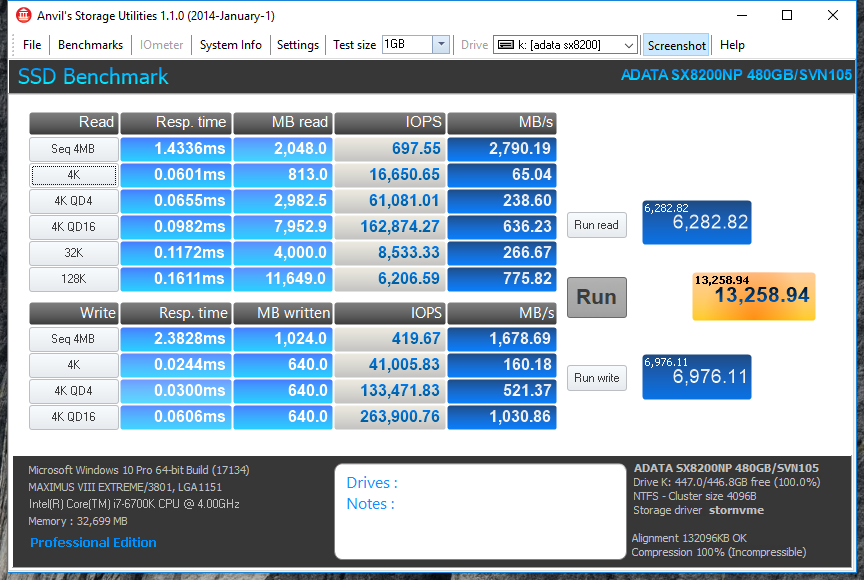
Here is the Anvil result for the SX8200 -
Here is a comparison of the Anvil Total score with the other
products I have tested -
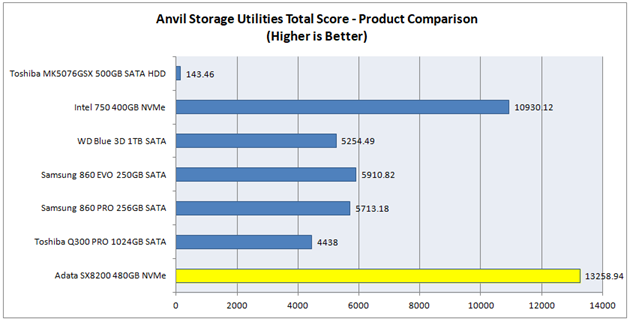
Another outstanding result.
Crystal Disk Mark
Crystal Disk Mark is a widely respected benchmark, which is
often used by manufacturers as a basis for publishing their ‘headline’
sequential read and write speeds. I always run the test with One Thread and a
Queue Depth of 32 (which generates a Queue Depth of 32, being the maximum Queue
Depth supported by SATA drives), a 1GB test file, Random data and 3 or 5
passes. The benchmark performs sequential IO with an IO Size of 512K for the
Seq Q32T1 test, sequential IO with an IO Size of 1MB for the Queue Depth 1 Seq
test and Random IO with an IO Size of 4K for the 4K (Queue Depth 1) and the 4K
Q32T1 test.
Crystal Disk Mark can be downloaded here (I use the
standard edition).
Here is the CDM result for the SX8200 -
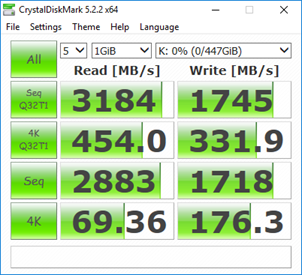
You can see that the headline Sequential Read speed, as
specified by Adata, of 3200MB/s, has very nearly been achieved in this test,
whilst the headline sequential write speed of 1700 MB/s has been exceeded.
ATTO
The ATTO benchmark tests Sequential IO for a large range of
IO Sizes. I always run the test with the default Queue Depth of 4.
ATTO can be downloaded here.
Here is the ATTO result for the SX8200 -
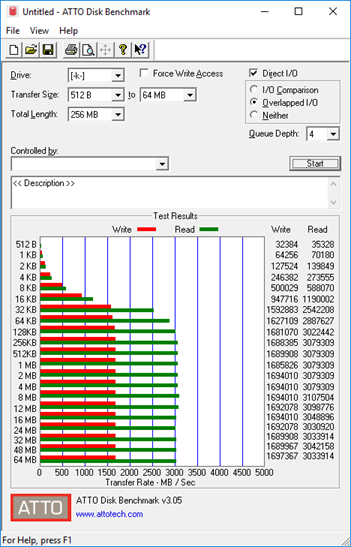
You can see that the maximum Sequential Read and Write
speeds (of 3200 MB/s and 1,700 MB/s respectively), as specified by Adata, have not
quite been achieved.
Now let's head to the next page, to look at the results
for the Desktop PC Real World Benchmarks.....
Desktop PC – Real World Benchmarks
PCMark 8 Storage Benchmark 2.0
This is how Futuremark describes the PCmark 8 Storage
Benchmark –
PCMark 8 Storage benchmark is ideal for testing the
performance of SSDs, HDDs and hybrid drives.
Using traces recorded from Adobe Creative Suite,
Microsoft Office and a selection of popular games, PCMark 8 Storage highlights
real-world performance differences between storage devices. You do not need to
have these applications installed on your system to run the Storage benchmark.
The PCMark 8 Storage benchmark test contains the
following workload traces: Adobe Photoshop light, Adobe Photoshop heavy, Adobe
Illustrator, Adobe InDesign, Adobe After Effects, Microsoft Word, Microsoft
Excel, Microsoft PowerPoint, World of Warcraft and Battlefield 3
You can read a detailed description of each storage test and
how the overall score is calculated in the PCMark 8 Technical Guide by clicking
here.
The results from this benchmark are, I feel, a valuable insight
into how a drive will support real world applications.
I thank Futuremark for providing Myce with a license to use
PCMark 8 Pro.
Here is the result for the SX8200 -
Excellent!
Here is a comparison of the overall score with the other
client products I have tested -
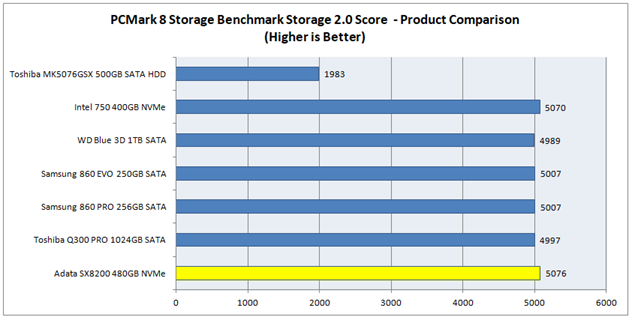
You can see that in this all important Real World benchmark
the SX8200 has achieved the best result amongst all of the drives I have
reviewed to date.
File Copy Benchmarks
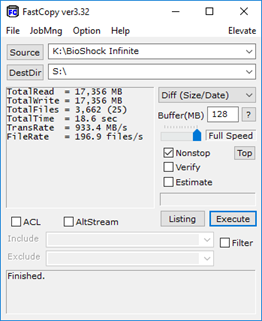
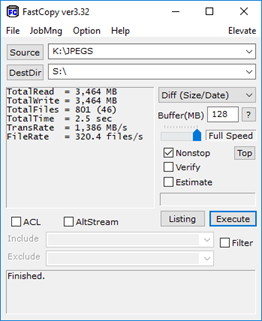
FastCopy is a useful program for recording how long copying
files to and from a drive takes. FastCopy can be downloaded here.
A Ram Disk (a virtual drive held in RAM) is used as the
source drive when a file is ‘copied to’ the test drive and is then used as the
destination when a file is ‘copied from’ the test drive. This ensures that the
test drive is on the critical path for the time taken.
Here are the results -
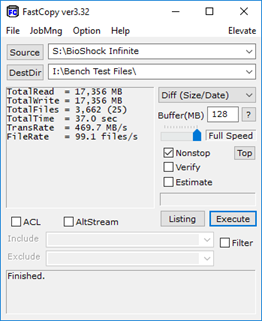
Copy a Blu-ray Movie to the SX8200
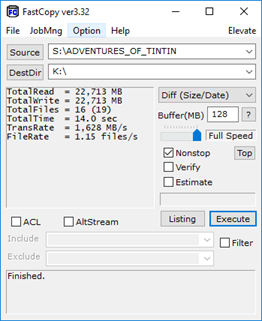
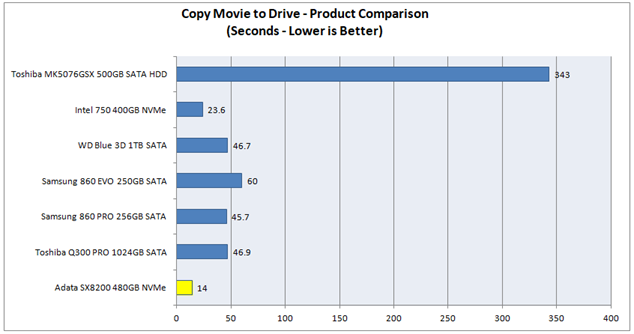
Outstanding!
Copy a Blu-ray Movie from the SX8200

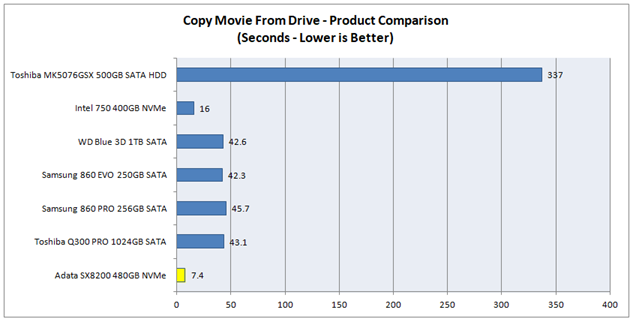
Again, Outstanding!
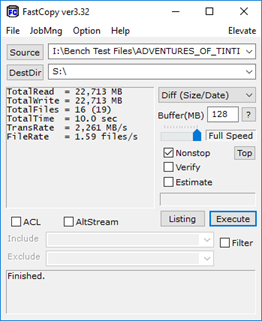
Copy a Game to the SX8200

And again.
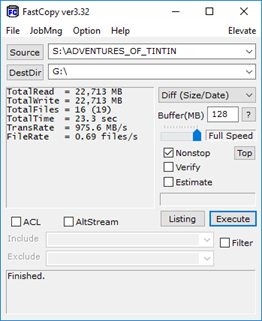
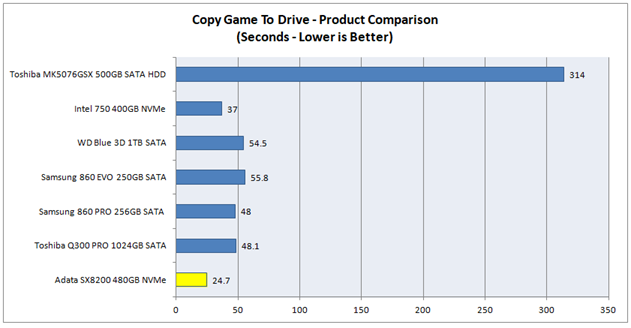
Copy a Game from the SX8200
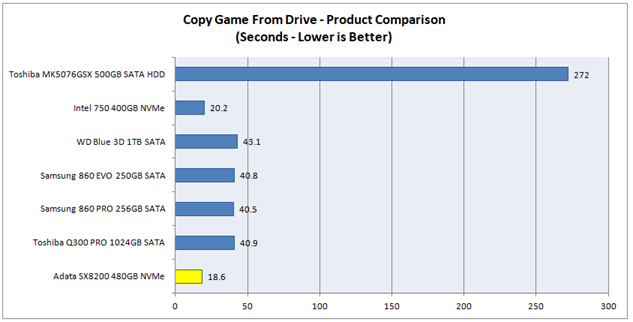
And yet again.
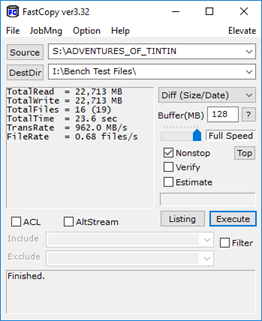
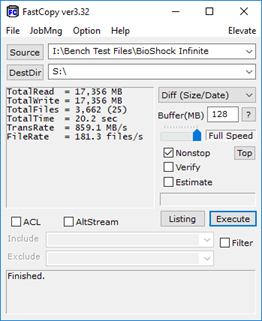
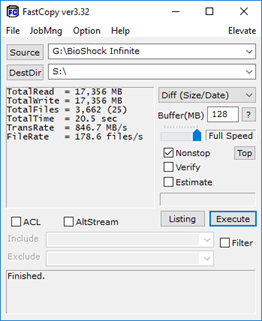
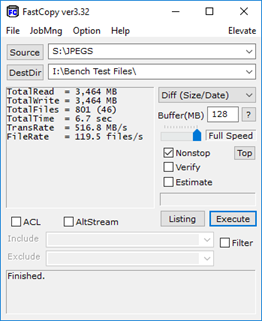
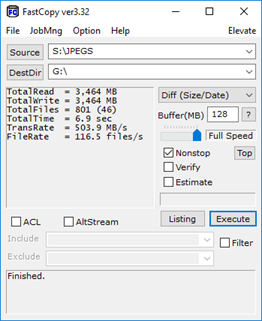
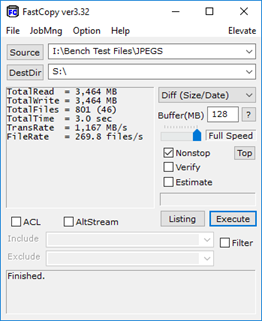
Copy a folder of JPEGs to the SX8200

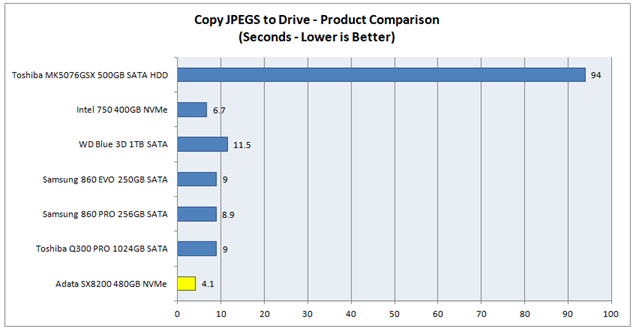
and again...
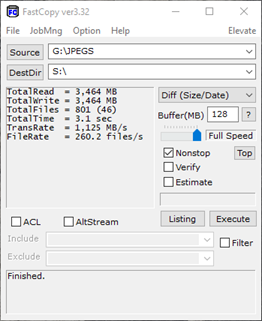
Copy a folder of JPEGs from the SX8200
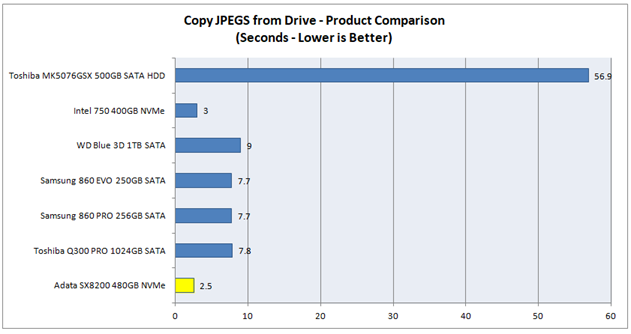
and again!
Now let's head to the next page, to look at the results
for the OakGate FOB Tests.....
OakGate Platform - ‘Fresh out of Box’ Tests
These tests provide a highly consistent basis for comparing
solutions. The sequence of tests begins with a purge of the drive to ensure
that it starts in a FOB state.
The tests cover all of the essential IO performance
characteristics.
Sequential Writes
This test performs 20 seconds of Sequential Write IOs for
each combination of Queue Depths 1, 4, and 32, and IO Sizes of 4K, 128K, and
1024K. IO traffic is limited to an IO Range of 1GB (which is equivalent to a
test file size of 1GB).
Here are the results for the SX8200 –
[masterslider id="79"]
Here is a comparison of the 1024K, Queue Depth 32,
Sequential Write performance with the other products I have tested to date –
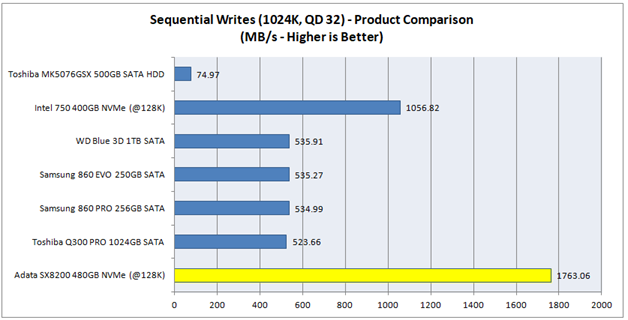
Please note that NVMe drives are tested with an IO Size of
128K.
This is an excellent result which exceeds Adata’s
specification of 1,700 MB/s.
Let’s also have a look at how the Sequential Writes Power
Consumption compares, but to do this fairly we must divide the average MB/s by
the average Milliwatts to get a value for the effective work done. Here is the
result –
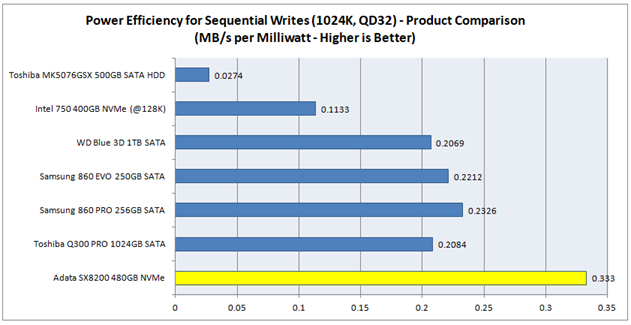
You can see that the SX8200 has an outstanding level of
power efficiency.
Sequential Reads
The test performs 20 seconds of Sequential Read IOs for each
combination of Queue Depths 1, 4, and 32, and IO Sizes of 4K, 128K, and 1024K.
IO traffic is limited to an IO Range of 1GB.
Here are the results for the SX8200 –
[masterslider id="80"]
Here is a comparison of the Sequential Read performance with
the other products I have tested to date –
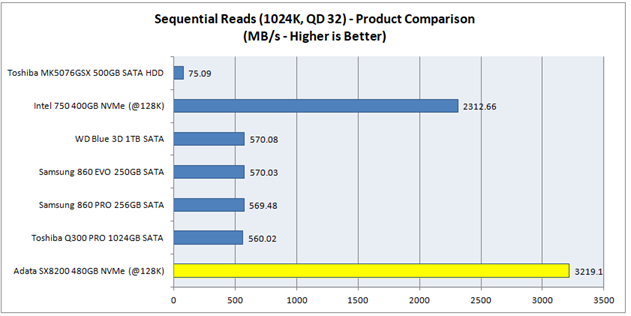
This is an excellent result which exceeds Adata’s
specification of 3,200 MB/s.
Random Writes
The test performs 20 seconds of Random Write IOs for each
combination of Queue Depths 1, 4, 32 and 128 and IO Sizes of 4K, 16K, and 32K.
IO traffic is limited to an IO Range of 1GB.
Here are the results for the SX8200 –
[masterslider id="81"]
Here is a comparison of the 4K, Queue Depth 1, Random Write
performance with the other products I have tested to date –
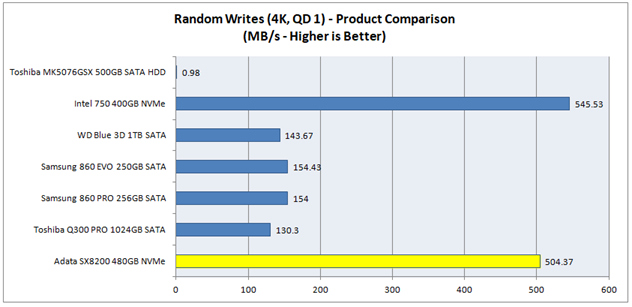
This is an excellent result.
Let’s have a look at the Latency Distribution for the 4K, QD
1 performance –
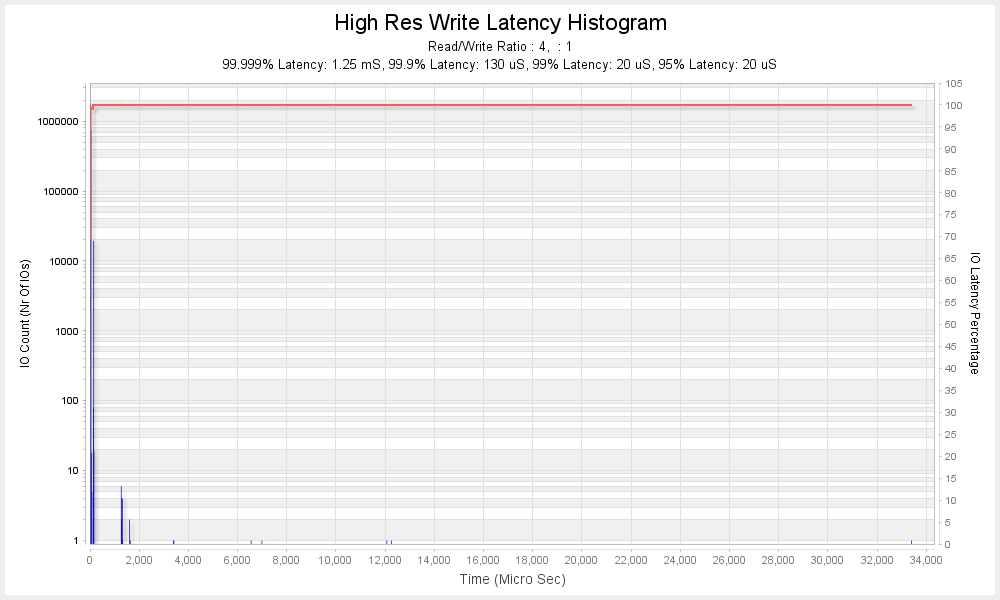
This graph shows the Latency for every IO that was performed
in the 20 seconds of traffic. It shows the Number of IOs (IO Count) that fell
within a particular period of Time (Microseconds). The red line plots the Time
against the percentage of total IOs performed.
You can see that the SX8200 achieves a high level of consistency
and that 99% of all IOs have a Latency of 20 Microseconds or less.
Random Reads
The test performs 20 seconds of Random Read IOs for each
combination of Queue Depths 1, 4, and 32, and IO Sizes of 4K, 16K, and 32K. IO
traffic is limited to an IO Range of 1GB.
Here are the results for the SX8200 –
[masterslider id="82"]
Here is a comparison of the 4K, Queue Depth 1, Random Read
performance with the other products I have tested to date –
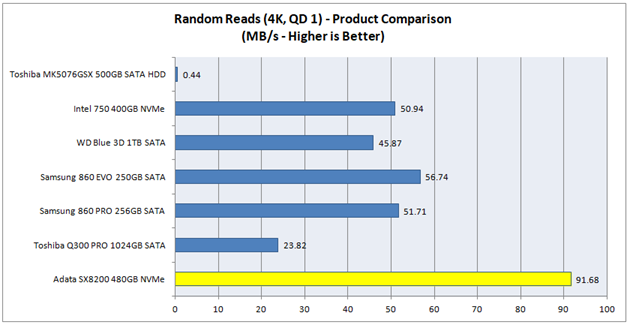
This is an outstanding result.
4K Random Mixed Reads/Writes
The test performs 20 seconds of 4K Random Mixed Reads/Writes
for each combination of Queue Depths 1, 4, and 32, and Read/Write ratios of
0/100, 30/70, 50/50, 70/30, and 100/0. IO traffic is limited to an IO Range of
1GB.
Here are the results for the SX8200 –
>>>>>>>>>>>>>>insert
slider 83
[masterslider id="83"]
Here is a comparison of the 4K Mixed Random 50% Read/50%
Write, Queue Depth 1 performance, with the other products I have tested to date
–
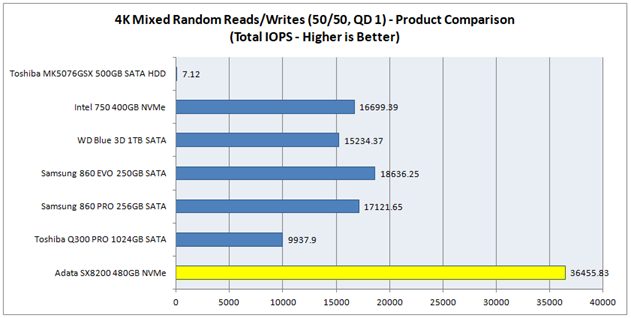
Another outstanding result.
Now let's head to the next page, to look at the results
for the Oakgate Sustained Write and Recovery Tests.....
OakGate Platform - Sustained Writes and Recovery Tests
Sustained Sequential Writes
This test starts with a purge (Secure Erase), so that the
drive is in a FOB state, and then performs 128K Sequential Writes until twice the
drive’s User Capacity has been written to.
Here is a graph showing the resulting Write Bandwidth over
time -
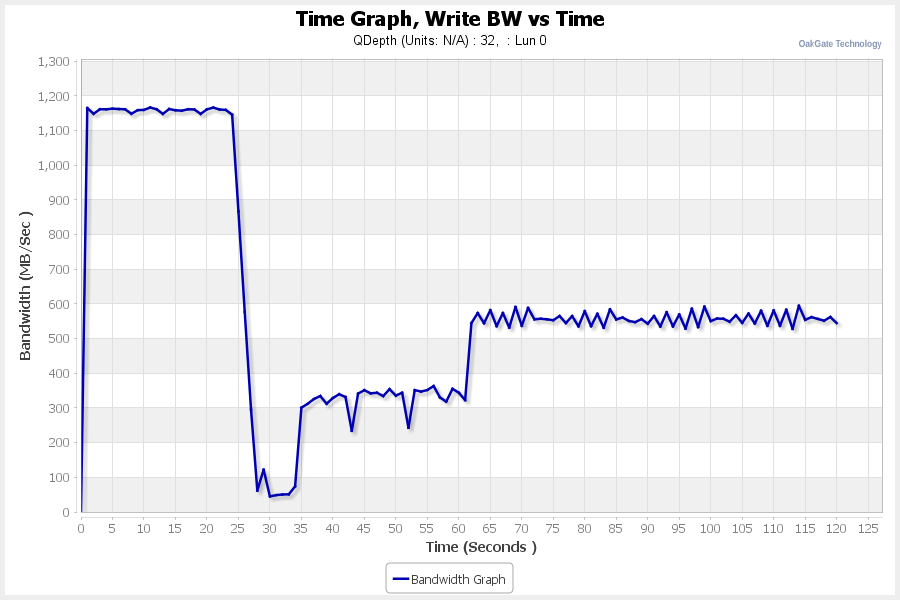
Let’s zoom in on the first 120 seconds -
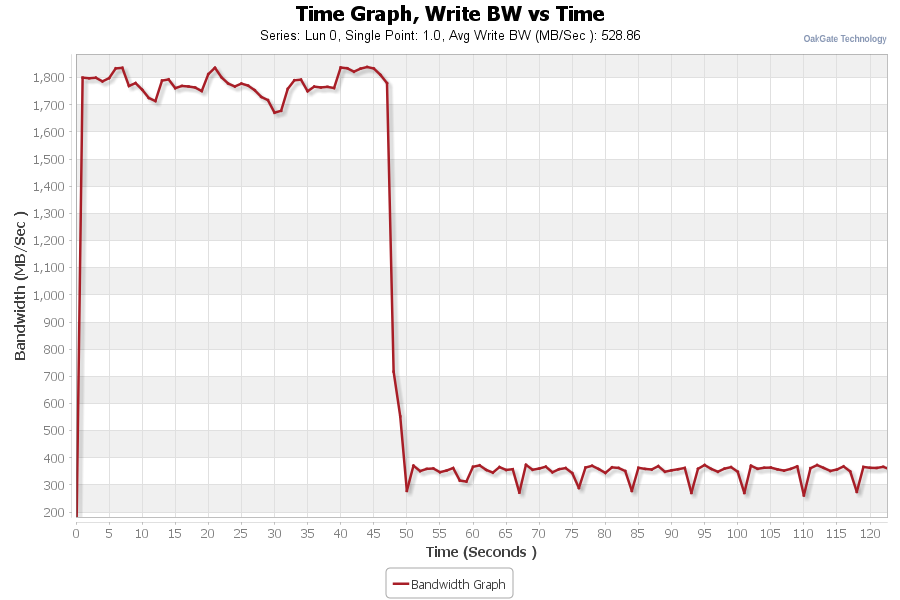
You can see that the SX8200 holds a steady speed above 1,700
MB/s until 47 seconds have passed. This is clear evidence of the SX8200’s Intelligent
SLC Write Cache Technology being in play - as the drive is empty at the start
of the test, the drive is able to write to around a capacity of 80GB before its
SLC Write Cache is exhausted and the write speed crashes.
4K Random Writes, FOB to Degraded (Steady State) to Recovered
This test is designed to fully degrade the drive’s
performance and then see how it recovers following a Trim and a period of Rest.
In this test I start with a purge
of the drive to take it to a FOB state.
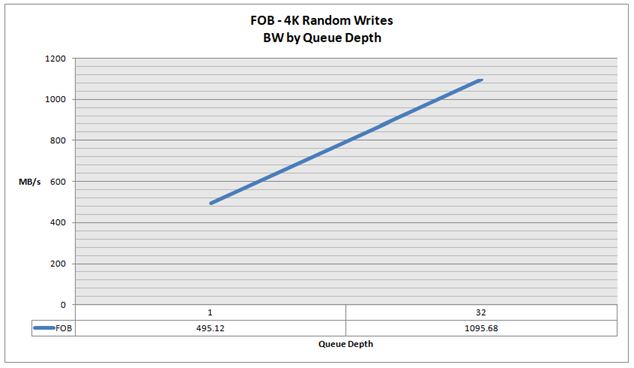
- FOB Performance – 4K Random
Writes Bandwidth
I then test the FOB 4K Random
Write Performance for 20 seconds at Queue Depths of 1 and 32, in an IO Range of
16GB, the result was as follows –
- Sequential Writes to two times User Capacity
I then performed 128K Sequential Writes to the drive for
twice the drive’s user capacity (as in the previous Sequential Writes to Steady
State test).
- 4K Random Writes for 1 Hour
This was immediately followed by performing 4K Random Writes
to the drive for 1 hour. Here is a graph showing the resulting Bandwidth over
Time –
You can see that the Random 4K Write performance eventually
settles into a steady state which fluctuates around an average of approximately
100 MB/s.
- Fully Degraded, 4K Random Write ‘Steady State’
Performance
I then immediately test the 4K Random Write Performance (as
we did in the initial FOB test), and the result was as follows -
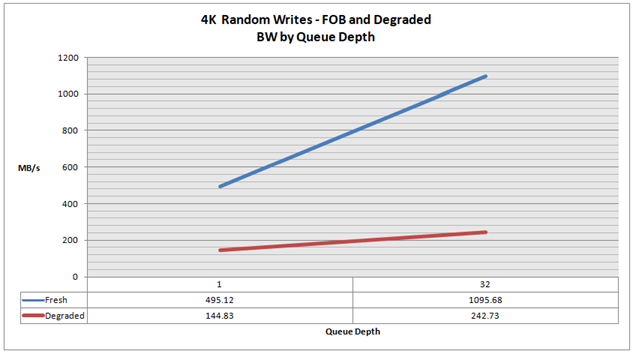
You can see that performance has dropped significantly
compared to the test performed in the FOB step. At this stage it is fair to
say that the drive’s performance is fully degraded and in a Steady State. It’s
as bad as it can get!
- Trim and Rest for 5m
I then liberally sent Sequential Trim commands to the drive
for a minute (to ensure that the drive’s entire range of logical blocks (= User
Capacity) was trimmed).
I then let the drive rest for 5 minutes before retesting 4K
Random Write performance again. The result was –
- ‘Recovered’ 4K Random Write Performance after Trim and
5 minutes rest
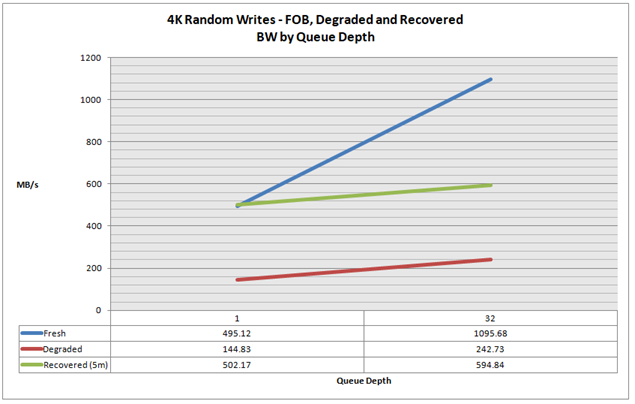
You can see that performance has fully recovered to support
the 20 second burst of 4K Random Writes at a Queue Depth of 1 but then the
SX8200 falls back to a somewhat degraded level of performance for the burst of
writes performed at a Queue Depth of 32. I feel that this level of recovery is
a bit disappointing.
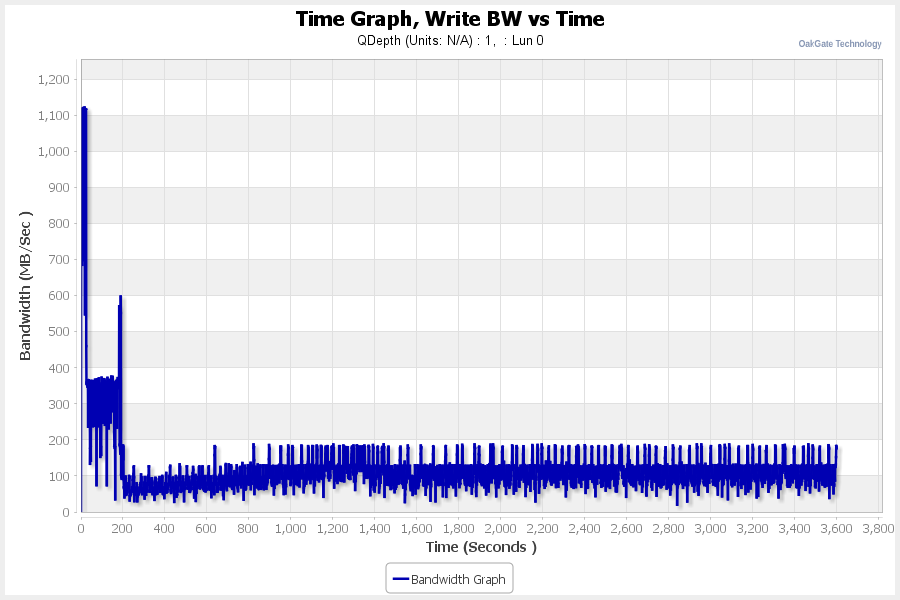
For interest let’s have a closer look at the BW over Time
time graph for the 120 seconds of Random 4K, Queue Depth 32 writes –
You can see that the SX8200 failed to sustain the peak speed
of writes after around 25 seconds.
This can be compared to the 120 seconds of 4K, Queue Depth
32, writes in the FOB test at the start of the test –
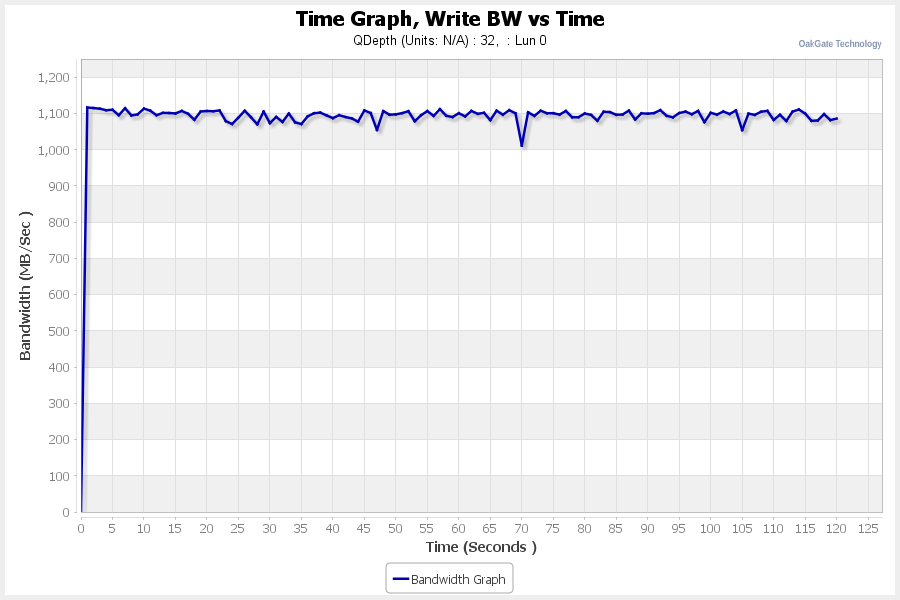
You can see here that the peak speed was maintained through
to the end of the 120 seconds.
Now let's head to the next page, to look at the
Conclusions from this review.....
Conclusions
The Adata XPG SX8200 480GB has set new records in almost
every one of our standard performance tests (only in our post trim recovery
test did it slightly disappoint). It certainly lives up to Adata’s billing as a
high performance drive.
I found the SX8200 480GB listed on Amazon for GBP £129.50.
At this price I expect Adata will win many happy customers.
I am pleased to award the SX8200 our highest rating of
Outstanding and name it as an Editor’s Choice.


")


