|
|
Review: Corsair
|
|
|
|

Corsair is no stranger to Myce's members.
Corsair has a wide product range, including PSUs, RAM, Cases, USB flash drives,
AIO liquid coolers and many other high quality PC components. In this review I
will be looking at their latest SSD, the Force LS.Corsair’s latest SSD is only
available in Europe in three capacities, 60GB, 120GB, and 240GB which I will
be reviewing.
Myce members will probably remember the
review that Wendy did back in 2012 for the Neutron
GTX SSD, again Corsair is looking at things in a different way, instead of using
the SandForce controller they decided to use the Phison controller for the
heart of their Force LS SSD and 19nm NAND from Toshiba to make an SSD that will
come at an affordable price and at the same time try to get the maximum speed
of the drive.
The Corsair Force LS SSD is a 2.5 inch
drive, with a height of 7mm, which makes it compatible with any Ultrabook. The
Force LS is SATA 6 GB/S and backwards compatible, with a three year warranty.
As with most SSDs the numbers are measured with ATTO, and when it comes to ATTO
tests, you should see figures reaching read speeds of 560MB/Sec and write speeds
of up to 535MB/Sec for the 240GB SSD, but later on this review we will have the
opportunity to have a more detailed look at the performance of the Force LS
SSD.
You can visit Corsair's website to have a look
at the facts and figures, and also spend some time looking at their wide range
of high quality PC components, such as PSUs, Cases, RAM, SSD’s and many more
can be found here.
Now let’s start this review.
Corsair Force LS 240GB SSD
Let’s start by taking a closer look at the
package and what it comes shipped with.
Packaging
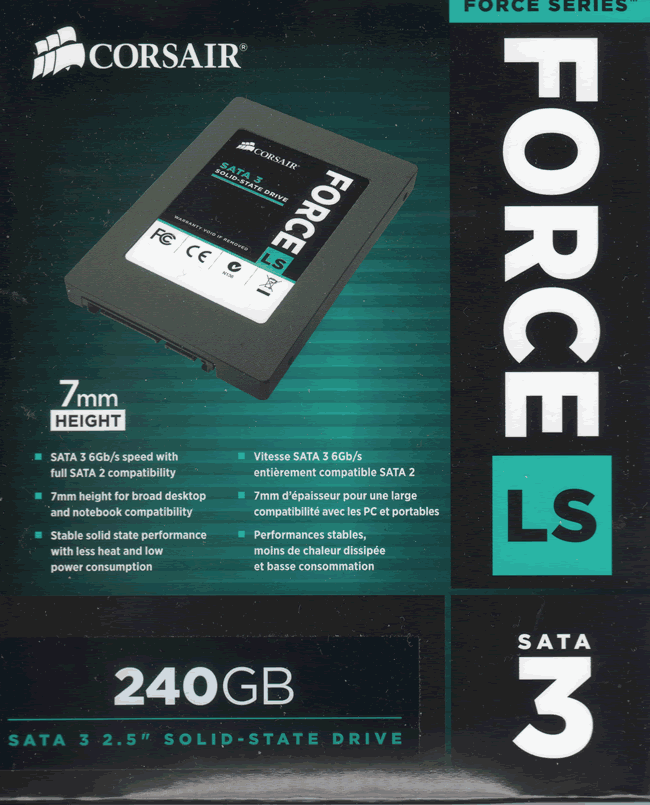
Box front
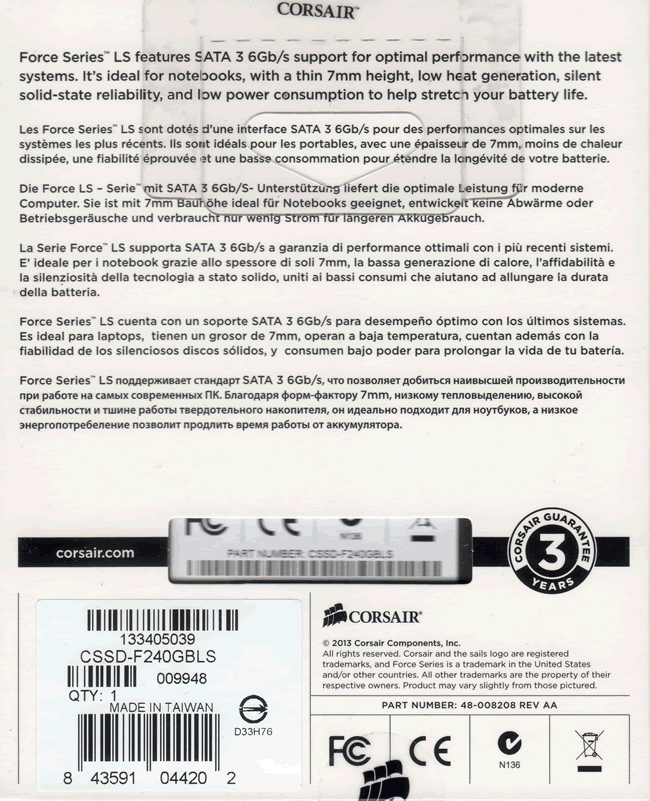
Box rear
As we can see Corsair has done a good job
with their packaging, it’s small in size and also it’s very appealing to the
eye. As you can see on front and the back of the box you will find some very
basic information about the drive, such as its 7mm height, and thesize of the
drive. For more info you can check the Corsair website, by clicking the link here. There isn't
much inside the box, only a warranty card, the drive, and also four screws. One
thing that I would like to see is a 3.5” adapter, this would have added some
extra value to the Force LS SSD.
A closer look at the Corsair Force LS 240GB SSD
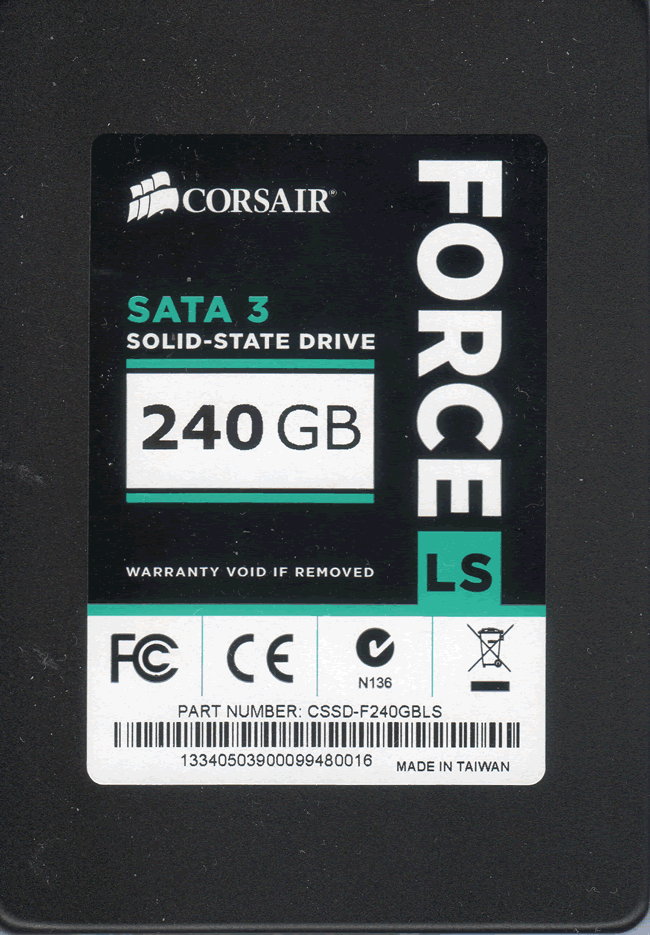
Top side of the Corsair Force LS SSD
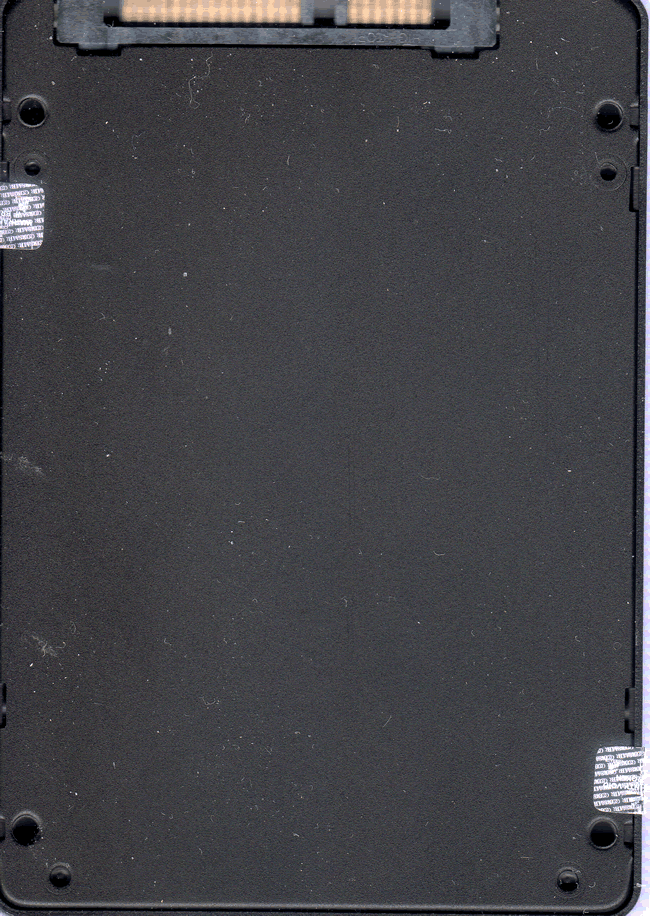
Drive underside
Corsair continues pretty much with the
style of front sticker that we have seen on the Neutron GTX, but with different
colour for the Force LS.
Now let’s look at what’s inside the SSD.
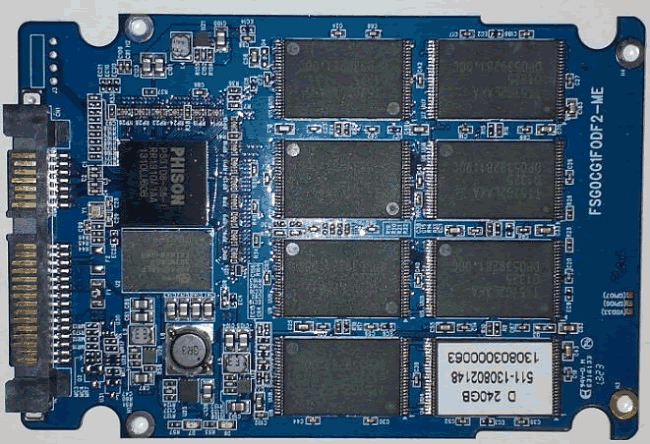
On
the top of the Corsair Force LS we find eight NAND made by Toshiba, a Phison
Controller. the DDR3 memory chip, and also a lot of capacitors at the top right.
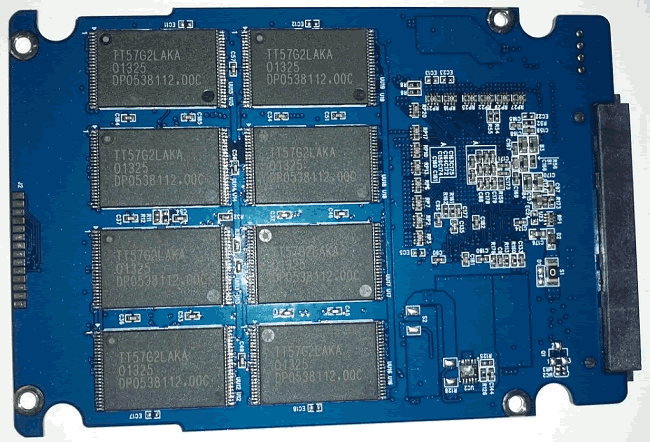
On
the back we will find another eight 19nm NAND manufactured by Toshiba.
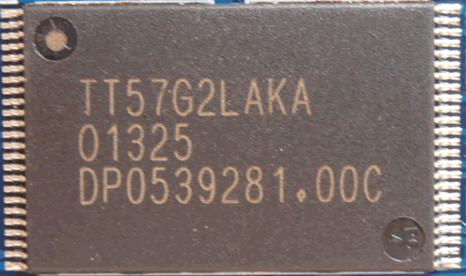
Here
is a closer look at the Toggle NAND which is manufactured by Toshiba, using a 19nm
process.
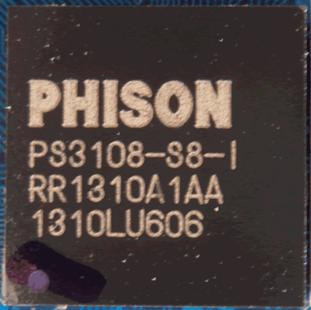
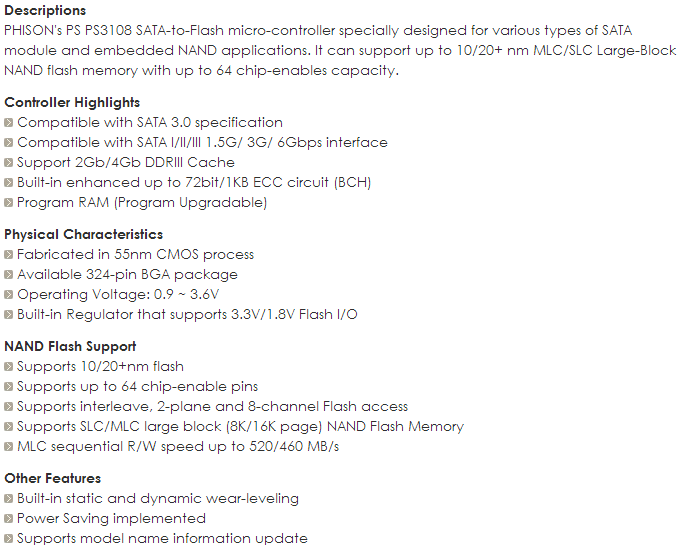
The
PHISON PS3108-S8, below you can see all the features of the controller as they
appear on the PHISON website.
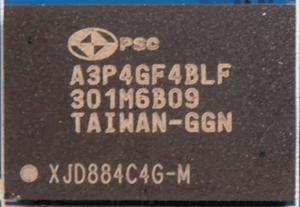
Now let’s
move on to the memory. The Corsair Force LS 240GB SSD has 512MB of DDR3, and
the chip manufactured by Powerchip.
Specifications
The following specifications are taken from
the official Corsair website.
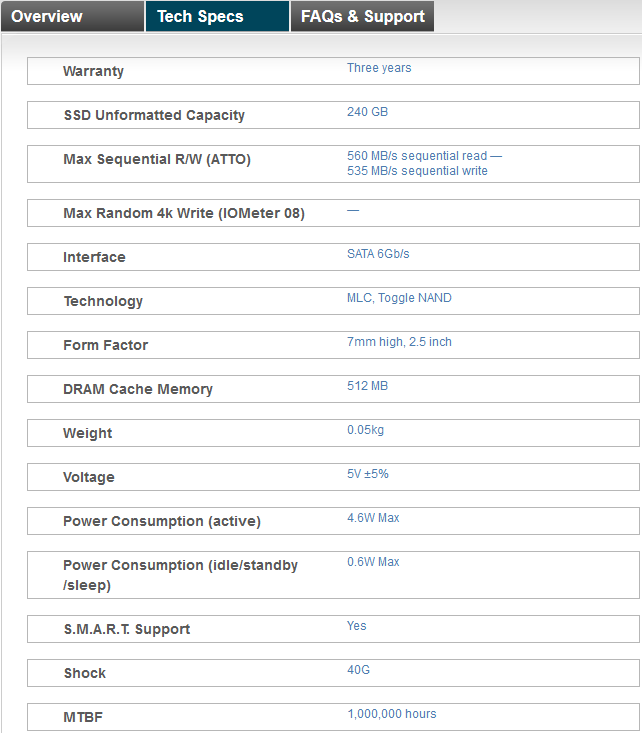
From the above table we can get a more detailed
picture of the various sizes that the M500 is available in, and the performance
that each size can give. As we can see the drive has MTBF of 1 million hours.
One final thing that it’s worth mentioning
is the wide variety of form factors that the M500 is available in, from the
standard 2.5” inch, to the widely spread mSATA, and also you can find it in the
M.2 form factor.
CrystalDiskInfo
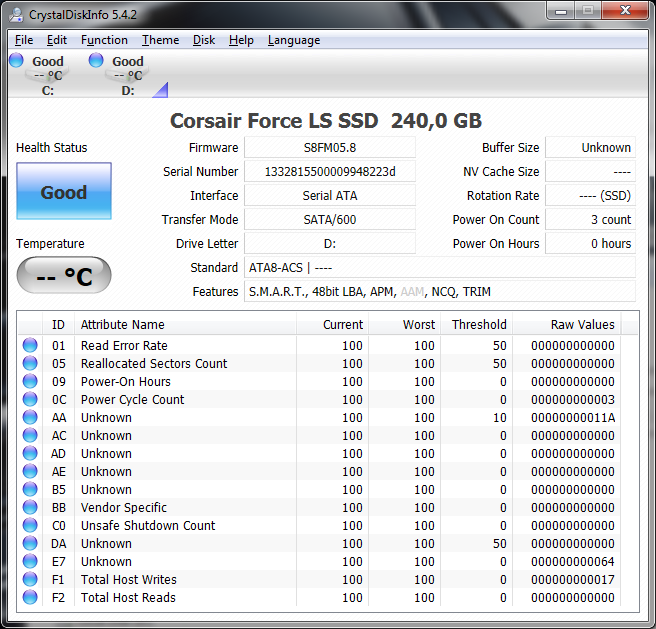
In
the above picture we can take a look at all the info that is available for the Corsair
Force LS SSD.
Let’s head to the next page where we
take a look at our testing methods and the review PC.
Test machine
For this review I will be using a computer
with the following configuration:
Hardware:
- Motherboard: AsRock Z68 Extreme 4 (Intel Z68
chipset) - Processor: Intel 2nd generation
Core i5 2500K @ 4Ghz - RAM: 16GB Crucial BallistiX Sports
- GFX: Onboard Intel HD 3000
- Sound: Onboard Realtek ALC889 HD audio
controller - Hard disk OS: Corsair Nova 64GB
- PSU: Corsair CX430 430W
- Display: Futsiju Siemens 22”
- Operating System: Windows 7 Ultimate 64bit with
Service Pack 1
The Corsair Force LS 240GB SSD was
connected to the Intel native SATA 6Gbps (port 1) on the Z68 motherboard of our
review PC and all tests on the drive were carried out with the drive connected
to this port. All power saving features were disabled during all of my
synthetic benchmarks.
AHCI mode was also selected for all drives
in the UEFI of our test PC, and all the tests were carried out in this mode.

The SATA 6Gbps drivers used on our review
PC were the Intel Rapid Storage Technology (RST) Version 11.7.0.1013.
Test applications
To test the performance of the Corsair
Force LS 240GB SSD, I will be using the following test applications in this
review.
- HD Tune
Pro - ATTO
- Iometer
- AS SSD
Benchmark - CrystalDiskMark
- Anvil’s
Storage Utilities - PCMark
Test procedures
I will start off our testing procedures
explanation by stating that I did not run many synthetic benchmarks on the Corsair
Force LS SSD. You may ask why I have run so few synthetic benchmarks.
SSD technology has moved so fast in the
last couple of years, that basic synthetic benchmarks alone are now of very
limited use, as they don't really tell us much about performance and how the
drive will behave in the real world. I have therefore decided to show some
basic benchmarks for the Corsair Force LS SSD, and will complement this with
advanced benchmarks using IOMeter and AS SSD benchmark. I will also show how
the Corsair Force LS SSD performs in the real world.
The reality of SSD performance
While I can easily show you which SSD is
technically the faster, when you use one of these modern SSDs as an operating
system drive it becomes very difficult to tell them apart as far as performance
is concerned.
A typical use of a small capacity SSD at
the moment is to have your operating system and applications installed onto the
SSD. The performance difference compared to a traditional HDD is enormous,
however when you start to compare SSD to SSD the difference becomes almost
impossible to detect.
Let’s look at why this is the case.
Drive A can boot to the desktop in 8.11
seconds, and drive B can boot to the desktop in 8.12 seconds, the difference in
time is milliseconds, and can one really tell the difference?
The fact is, all modern SSDs are only
ticking over when they are only running the OS and launching applications, it’s
only when you get to some of the larger capacity SSDs, with enough free space
to be able to hold the actual data that you’re going to be working with, be
that video, audio or pictures, for example, that you actually get a tangible
difference in performance. This is where the SSDs with the better sequential
performance start to pull well ahead of the SSDs which have lower sequential
read/write performance.
Small file random IOPS vs sequential performance
IOPS
This is a fairly complex subject, but I
will do my best to explain things in a manner that is easy to understand.
The term IOPS is the amount of input or
output transactions that can take place in a one second interval, so for
example, if an SSD is quoted as being able to cope with 20,000 4K random write
IOPS, then the SSD should be able to cope with 20,000 input transactions in a
period of one second. If the same SSD is said to be able to produce 20,000 4K
random read IOPS, then the same SSD should be able to produce 20,000 4K random
read output transactions in a one second interval.
Ok, now we have some figures to work with,
the next question is how many IOPS are actually required?
This will depend on your usage pattern. If
you are a typical desktop user who browses the internet, does some word
processing or perhaps some audio or video editing, and perhaps plays a few
games, then in actual fact, you don’t need to have massive 4K random read/write
performance. The actual amount of 4K random performance that is required for a
fast and smooth running system for a desktop user with a usage pattern similar
to the above will be well under 1,000 4K IOPS.
On the other hand, if the SSD is being used
for running a large and complex database server, then 4K random performance is
the absolute measurement of how fast that server will run, as this type of
application does most of its input and output transactions in the 4K domain.
So why would I need an SSD with 80,000 4K
IOPS for a desktop?
In fact you don’t need this type of performance
for a desktop, but an SSD which is capable of coping with 80,000 4K IOPS will
be faster than an SSD which can only cope with 20,000 4K IOPS.
OK, I just said if under 1,000 4K IOPS are
actually required for typical desktop usage, why is an SSD with 80,000 4K IOPS
faster than an SSD with only 20,000 4K IOPS, confused?
You may ask, if I only require 1,000 4K
IOPS surely the rest is wasted?
While you may never need 80,000 4K IOPS,
IOPS is all about latency. The reason that an SSD can cope with as much as 80,000
4K IOPS is because latency in this domain is very low. With 4K files, even if
you require to process 500 of them at the same time, you are not talking about
a huge amount of data, it has far more to do with how long it takes the SSD to
process a single file, and the amount of time required to process a single 4K
is all about how long it takes for the SSD to access or store that data before
it can move on to the next transaction.
In other words an SSD with 80,000 4K IOPS
performance will handle those 500 files faster than the SSD with 20,000 IOPS.
So how will a desktop user even notice this
faster speed if so little 4K random IOPS and data are actually used?
Multitasking is a good example. The more
tasks you run at the same time, you more you will notice the speed difference.
Sequential performance
I have always maintained that sequential
performance was every bit as important as small random file performance for a
desktop SSD. Some highly regarded people on other sites found this statement
quite funny a couple of years ago when I made it, but my, how times have
changed in the world of SSD reviewing.
To me this was always so obvious for a
desktop user. For example, let’s say you want to launch an application or game.
Both have some fairly large files to load, and also a great many small files,
but the point is, even the smaller files are sequential in nature. Now let’s
say you’re into audio or video editing. Video files tend to be huge, and the
files are written or read sequentially. Isn’t this how many users are using
their PCs these days?
Summary
So how does this shape up in the real
world? Which is better, massive 4K IOPS or massive sequential performance?
In an ideal world you want both, as an SSD
with massive random 4K IOPS and sequential performance will always be faster
than an SSD that has high sequential performance and moderate 4K random IOPS
performance, and the same applies to an SSD that has massive 4K random
performance and moderate sequential performance. The SSD which has high performance
in both patterns will always be the faster SSD.
However, you can still have an SSD that is
very fast for desktop use that has moderate random 4K performance and massive
sequential performance, the same can be said about a drive having massive
random 4K performance and moderate sequential performance, as it is about
getting the balance right if you have to compromise on one or the other.
Drive preparation for running the tests
All the SSDs used in this article were in a
clean and fresh state when the testing period started. From then on, each drive
had to rely on its own NAND cleaning effectiveness for the remainder of the
tests.
- Both our spinning HDD drives were
defragged before the start of each test.
- All SSD and HDD used in this article had
their partitions aligned to the Windows 7 x64 defaults.
Where I use graphs in this article to
display results, I will use the following colours to make it easier, for our
readers to see which drive we are reviewing.
![]() Corsair
Corsair
Force LS 240GB SSD
![]() Comparison SDD
Comparison SDD
Now let's head to the next page, where I
look at some basic benchmarks...
Reading Benchmarks
HD Tune

HD Tune – Sequential reading test
I present the graph below for comparison
with other recently tested drives.

As we can see the Corsair Force LS SSD is
fast, but it was never intended to be fighting for the top position, and we can
also see the 51.9MB/Sec difference compared to the Corsair Neutron GTX. As it
is expected the drive is in the middle of the chart.
ATTO disk benchmark
ATTO has become a standard tool for
measuring the data throughput of HDD and SSD. It measures the reading and
writing performance, using different file sizes and block sizes.

ATTO had no trouble reaching the maximum
speed of the drive, the result is what I expected to see.
CrystalDiskMark 3.0
CrystalDiskMark is quite a handy
benchmarking application, as it focuses on the file sizes that can cause a
problem on a system drive.

The default setting on CrystalDiskMark uses
random data, and that gives a more realistic view of the performance of any
drive. Here we can have a more rounded view of the performance of the Force LS,
and as we can see the drive is very fast with sequential data but falls behind in
the 4K test. Overall the result is very good.

One quick run of CrystalDiksMark with
compressible data. We can see that the Corsair Force LS really likes to handle
compressible data.
AS SSD Benchmark
AS SSD benchmark is a benchmarking tool
specifically designed to test SSDs. The application tests sequential reading
and writing performance, 4K random reading and writing performance.
AS SSD benchmark also tests 4K threaded
performance. This is very exciting, as this test is the first available test
that I am aware of, that simulates how a PC operating system actually works. A
modern PC and OS, such as Windows Vista/7 does not just run a single thread at
a time, it runs many threads. The AS SSD benchmark "4K 64Thrd" tests
run 64 threads simultaneously throughout the test. If this result is good, then
you can be pretty sure the drive will perform extremely well as a system drive.
After the tests complete, AS SSD benchmark
derives a total score for the drive being tested. This is based on all aspects
of the test results, and gives an indication of how the drive is performing
overall.
Now let’s look at the results for the Corsair
Force LS SSD in the form of a screenshot. All our other comparison drives’
results are presented in the form of a graph.


Corsair’s Force LS is showing good performance
for a value orientated drive, and gives a score of 710 points.
Let's head to the next page and run some
tests using PCMark Vantage and PCMark 8.....
PCMark Vantage - HDD Suite
For these tests we will be using FutureMark’s
PCMark Vantage. This suite of real world test applications is highly regarded,
as one of the most comprehensive ways of testing a computer’s performance in
the real world. The PCMark Vantage test application also includes an HDD/SSD/USB
Flash suite of testing procedures, designed to fully test out the performance
of an HDD/SSD to its limits.
PCMark Vantage HDD suite results

Here
are the results for the Corsair Force LS 240GB SSD.

Here we have a more detailed view of the
performance of the Corsair Force LS, compared to other SSD’s that I have tested
so far.

The
total score of the Corsair Force LS SSD isn’t that impressive by today’s
standards.
PC Mark 8 - HDD Suite
Here at Myce.wiki, we only recently
introduced PCMark Vantage to our SSD testing. PCMark Vantage is a good test,
but is now somewhat outdated in the applications that it tests, even to the
extent of including a test trace on how Windows Vista booted. We could have
course have opted for the newer PCMark 7, but I personally had issues with the
way it ran the HDD tests.
We have built quite a close relationship
with FutureMark software, the authors of the PCMark PC benchmarking software
that we use in our tests. I decided I would use PCMark Vantage as stopgap
measure until the more up-to-date PCMark 8 benchmarking suite became available.
I'm pleased to say that PCMark 8 is now available, and it gives me great
pleasure to introduce you all to the results obtained by this new 'real world'
benchmarking suite.
I will describe the basic way that each
test is carried out, above the graph for each test.
PC Mark 8 HDD suite results

Here
is a screenshot of the Corsair Force LS 240GB SSD result.

I am providing a graph so that you can
compare the performance of different drives that I have tested so far.

Another graph to give you a much better
view of the performance of the Corsair Force LS SSD, compared to other drives.
Summary:
I wasn’t expecting the drive to rule the
charts, but the Corsair Force LS gave a very nice overall performance.
Let's head to the next page for our
IOMeter test results.....
I/O Performance
There is little point of having an SSD
drive that has blazing sustained reading and writing speeds, if the drive can't
handle reading and writing of small random files. If you intend to use your new
SSD drive to store and run your operating system, then the drive must be able
to cope with the many small random files that Windows will write to the drive
continually. So I feel it is very important to test how many of these random
files that a drive can handle in one second. I believe that anything over 1,000
I/O’s per second would be enough for most users running a consumer grade
mainstream PC, and should provide a smooth running system. But obviously, the
more I/O's that a drive can handle, the faster the drive will feel and leave
more headroom for those huge multitasking sessions that users sometimes engage
in.
The things that I will look at are the
total I/O per second and total MB/s.
Partition alignment and sector boundaries
Windows 7 and Vista will automatically
align a partition to 4k boundaries during partition creation, Windows XP won’t.
It is imperative that an SSD’s partition is aligned. Windows XP is also
restricted to sector boundaries, while Windows 7 will use 4k boundaries if it
can. The Intel 510 is 4k boundary aware, and will use these boundaries if
possible. Of course it will also remap LBAs for compatibility with the sector
boundaries so that the drive can be used with Windows XP.
IOMeter allows us to set the sector
boundaries for conducting the tests, and I have therefore set the sector
boundaries at 4K, which means the IOMeter tests are valid for Windows 7 and
Windows Vista users. XP users will not be able to obtain such results.
I will provide a screenshot of the tests on
the review drive for those of you who like to see the actual test result. All
the comparison drive results are represented in the form of graphs.
If any of you would like to see a
screenshot from any IOMeter test on a particular drive, please feel free to
request one, and I’ll post the screenshot in the forum thread.
All the IOMeter tests create a 10GB data
set on the target drive, and each test is run for a duration of 3 minutes.
IOMeter 4K random write test with repeating data.
The first test involves creating continual
4KB random files on the target drive with IOMeter. I use a 4KB file size, as it
is believed that Windows will create and modify many of this size of file
constantly in the background during a typical Windows session. It is said that
most 4K random writes take place at a queue depth of only one.
Queue depth 1

Corsair Force LS 240GB SSD – 4K random write (Queue depth 1)

Queue depth 4

Corsair Force LS 240GB SSD (Queue depth 4)

Queue depth 32

Corsair Force LS 240GB SSD (Queue depth 32)

4K random write queue depth profile
For this
test I used various queue depths from 1 – 32 to give you an idea how this SSD
performs at different queue depths. For a normal desktop user, with lightweight
multitasking, the queue depth will rarely rise above 2. For heavy multitasking,
the queue depth is unlikely to rise above a value of 8.

A more detailed view of the performance of
the Corsair Force LS with various Queue Depths.
IOMeter 4K random read test.
If there are many 4k files created, then
that must also mean that many 4k files need to be read. This test measures 4k
reading performance.
Queue depth 1

Corsair Force LS 240GB SSD (Queue depth 1)

Queue depth 4

Corsair Force LS 240GB SSD (Queue depth 4)

Queue depth 32

Corsair Force LS 240GB SSD (Queue depth 32)

4K random read queue depth profile.
This test
shows how the review drive scales with increasing queue depths.

A more detailed view of the performance of
the Corsair Force LS SSD at different Queue Depths.
IOMeter 512KB write test with repeating data.
Sequential writing performance is also very
important; in this test sequential writing performance is measured.

Corsair Force LS 240GB SSD 512K Sequential write with repeating data

The result isn’t very impressive but it is
a very good one, the Corsair Force LS SSD reached a max speed of 405.8 MB/Sec.
IOMeter 512KB read test.
This test measures 512k sequential reading
performance.

Corsair Force LS 240GB SSD – 512K sequential reading test

A very impressive result again with
sequential data, the Corsair Force LS SSD is in this test the third fastest
drive, it maxes out at an impressive 552.48 MB/Sec.
IOMeter Workstation simulation (outstanding I/Os = 64).
When running applications you will find
that there is a mixture of small random files and larger sequential files,
being created and read. Not only that, it isn’t just one file at a time. In
this test I measure a simulated workstation pattern, with a queue depth of 64
(threaded).

Corsair Force LS 240GB SSD – Workstation simulation

For this last test we can again see
performance that is acceptable, but far away from impressive, the Corsair Force
LS SSD was able to achieve the speed of 159.1MB/s.
Summary
Again, there is no surprise with the performance
of the Corsair Force LS SSD as it performs well with compressible data, but
falls behind when it handles incompressible data.
Now let’s head to the next page where we
will look at how the Corsair Force LS SSD
performs using Anvil's Storage utilities....
Anvil’s Storage Utilities
As well as performing SSD endurance tests.
Anvil’s Storage Utilities has a very nice SSD benchmarking application. The SSD
benchmark tests many different aspects of SSD performance, including 4K random
at different queue depths, and also sequential performance, but more importantly
than this, all using real test data.
Another very nice feature of Anvil’s SSD
benchmark is the fact that you can change the compression levels of the test
data. The compression levels of the data sets used for the tests can be varied
from 0% compression right up to 100% compressed data, and there are even a few
data profiles already included, such as database (8%) compression, and also an
application profile (46%) compression, which is designed to simulate real
application data being read and written to the SSD.
Anvil’s Storage Utilities is still in beta
at the moment, but the application is currently solid enough to use in this
article, and I have already verified the results obtained using an SATA
analyser.
I will include a screenshot of the review
drive, and all comparison results will be presented in the form of graphs. If
you would like to see screenshots of the test results obtained on the other
SSDs in this article, you can do so by following the link here.
I will also be testing three different
compression profiles, which are as follows.
- 0 fill (100% compressible data)
- Application simulation profile (46%
compressed) - 100% (non compressible data)
So let’s begin the tests.
0 fill

Corsair Force LS 240GB SSD (0 fill)

Results
are ranked by highest total score.
Once again we can see that the drive likes compressed
data, and in this test is the second fastest.
Application profile

Corsair Force LS 240GB SSD (application profile)

Results are ranked by highest total score.
In this test the Corsair Force LS is
showing the performance that I expected to see, it’s somewhere in the middle.
If you look closely you will see that it manages to beat drives that in theory
should be in a different league, overall it’s a very good result.
100% incompressible

Corsair Force LS 240GB SSD (100% incompressible)

Results are based on the total highest score.
Again the Corsair Force LS delivers a very
good performance, with incompressible data.
Summary
?It's crystal clear that the Corsair Force
LS isn’t going to be the fastest drive you can get, but a drive that is more
value orientated. Looking at the Corsair Force LS as a value for money solution
you can't complain that much about its performance, in some cases the drive is
able to beat other drives that are aimed for more of an 'enthusiast' user.
Now let's head to the next page for some
real world tests....
It has become clear that simply conducting
endless benchmarks on SSD drives is pointless. Real users may run a few
benchmarks when they first fit their SSD drive, but most users just want a
drive that performs well in the real world. They want their drive to work
"out of the box" and work fast and smoothly.
Most of the latest SSD drives can deliver
very fast sustained reading and writing speeds, but these alone tell you very
little about how the drive will perform in the real world.
If you intend to use your SSD as your
primary system drive, with an operating system and applications installed and
running from the drive, real world performance becomes much more important than
just fast sequential read and write speeds, in this case I felt that it was
time to move into a different method of testing.
From now on I will only use the log files
from the Event Viewer to measure the start-up and shutdown of the system, and
also use filecopy to measure all my copy tests from a RAM disk to the selected
storage drive that I will be testing. For these tests I will also enable all
power savings features that are available, since I believe that this is the way
that the majority of the users will have them set on their PC.
Real world copy tests
I will now conduct some real world copy
tests so that you can have a much better view of how the drive will perform. In
these simple tests I try to simulate what a real user does with their drives. I
will be copying some mp3 files, various picture and MKV files, and finishing by
installing MS Office 2007.
As I said earlier from now on all my test
files will be stored in a RAM disk and copied/pasted to the destination drive
using filecopy. The filecopy utility will be used from now on for all my tests,
and I’ll be using it this way to measure the time that it takes to copy the
files.
Before I move on to the test, I want to
give you an idea on how fast your RAM is. Below you can find the results.

As
we can clearly see speed isn’t going to be an issue in these tests.
Copy tests – 259 MP3 song files (1.36GB total)

Let's start this test by copying 259 MP3 files
from the RAM disk to the destination SSD. We can see that the Corsair Force LS produces
a very good result, the drive only needing 4.27 seconds to finish the task.
Copy tests – 3,377 JPEG picture files (2.56GB total)

Moving to my next test, and this time I
will be copying 3.377 picture files that are stored in the RAM disk to the Corsair
Force LS SSD. Again the result is very good, and the Corsair Force LS is the
second fastest drive that I have tested so far.
Copy Tests – 1 MKV and 1 SRT file (3.46GB)

Again I followed the same procedure, and
the Corsair Force LS came in second fastest.
Windows start-up and closedown based on the Event Viewer
Logs
Start-up & Shutdown time
The next two screen shots were taken after I'd
installed all the drivers and all the software that I use every day. Below are
the results.

Used
state boot time in measured in milliseconds.

Used
state shutdown, again measured in milliseconds.
It’s clear that the Corsair Force LS SSD is
a very fast drive in both tests. Again I would like to point out that the times
in these tests will vary from system to system and they're only here as a
reference for each drive.
Installing applications
Installing applications is possibly
something you don't do that often. But should you replace your system disk,
then you will most likely have to re-install your applications. Most of the SSD
drives I have tested up until now are quite slow at installing applications,
most likely because their I/O performance was quite limited.
For these tests, we picked some popular
applications and copied the entire contents of the CD or DVD media to the RAM disk.
We did this to make sure that the reading speed of our CD/DVD reader would not
hamper the performance of the target drive.
We then installed these applications onto
our comparison HDD drives, which were all running mirror image installations of
our Windows 7 Home Premium 64-bit installation, and timed the amount of time
taken to install the application with a stopwatch on each of the drives.
MS Office 2007 Enterprise (full install)
Now let’s see
how the Corsair Force LS SSD performs
with the installation of MS Office 2007 Enterprise Edition.
The procedure
followed was very simple. I copied all the files from the CD to the RAM disk and
used the virtual drive as a source for the installation files.

It’s clear that the Corsair Force LS SSD is able to give a very good
result, for the full install, it only needed 151 seconds to complete this task.
Speed degradation after heavy testing
On this page I will measure how the SSD
performs after heavy testing and usage.
I will run an AS SSD benchmark test when
the OS is freshly installed so that we can get a good view of how the drive
performs with the OS. After that I will fill the drive up to 50% of its
capacity, use the drive for a few days, and then re-run the AS SSD benchmark.
The same procedure will be followed once again, but this time the drive will be
filled close to 90% or higher of its capacity. To finish this test, I will
simply delete all the extra data and leave the PC idle for a few hours so that
the controller has the time to perform any necessary cleaning, then see how the
drive performs.

Here is the first test that I ran with the
drive having only the OS, and various other applications that I use daily.

Filling the drive with data up to 50% of
its capacity we start to see a small drop in the performance, but overall the
performance is acceptable for daily use. But what would happen if we leave the SSD
inactive for more than 10 minutes?

We can see that the drive has gained back
most of its performance, proving that TRIM is working correctly and was able to
fully restore the performance of the drive.

This is a very unusual scenario for any
SSD. I have left less than 4GB of free space on the Force LS, and no time for
TRIM to work. As you can see the performance drops, and this is expected with
so little free capacity there isn’t any for TRIM to operate. I know that this isn’t
a something that would normally happen, but it gives a nice view of what would
happen when you push the drive to the limits.

After this it is time to delete all the
unwanted files from the drive, and again give TRIM a little more than ten
minutes to work on the drive. As we can see from the picture above, the
controller is showing a slightly better result even from the first run that I
did.
I can clearly say that TRIM is able to keep
the performance of the drive very close to the original state, as long as you
have enough free space for it to work. Also the Corsair Force LS SSD showed
some very interesting results in daily use, and the drive never felt sluggish
for as long as I used it.
This concludes our review. To read the final
thoughts and conclusion, click the link below....
Conclusion:
Let us summarise the most important
positive and negative points below:
Positive:
- SATA 6Gbps support.
- 7mm thick SSD ready for Ultrabooks.
- Very good TRIM operation
- Very good performance when used as a
system drive. - 3 year warranty.
- Very well priced.
Negative:
- Performance with incompressible data.
- 4K read/write performance could have been
better.
To sum up, this is what I would say:
Summing up a review isn’t the easiest task
for a lot of different reasons. One of these reasons is the excellent performance
that you can get with most SSD drives, even those that aren’t focused on
enthusiasts. A great example is the new Corsair Force LS SSD. The Force LS SSD
is a drive that has very good performance when it comes to benchmarks, but more
importantly it maintains this performance when it’s used on daily basis.
I used the Corsair Force LS SSD for almost
two weeks and during this time I was pleasantly surprised by the performance
that is showed, and how well the drive was able to keep this maintained. During
this time I used the Corsair Force LS SSD it never felt sluggish or slow, it
felt like the drive had a lot of performance, especially considering that most
of the time the drive was full of data with not a lot of free space.
There is one weak point for me, and that is
the 4K performance. But I had to remind myself that this wasn’t a drive that was
going to compete against the Corsair Neutron GTX, so this is something that was
to be expected.
I am not going to say much about pricing,
because the drive is only available in Europe, and also prices can and will
change very frequently. You can get an idea of the cost of the Force LS on the
Corsair website, on Amazon and at your local shops. For the money that you
will pay, you will get a three year warranty from Corsair, and the drive can
replace the mechanical hard drive in your Ultrabook straight out of the box.
The parting sentence is:
“A pleasant surprise are the words that
first come to mind for the Corsair Force LS SSD. If you are looking for an SSD
that won't cost a lot of your money, and in return will give you a very good
and solid performance, then you should have the Corsair Force LS SSD on your shopping
list.”
I therefore give the 'Very good' rating and
the “Editor's choice” award to the Corsair Force LS 240GB SSD.


Thanks to:
|
|
EFD |
|
|
Alex Schepeljanski for |
|
|
|
|
|
FutureMark for providing a
|


You may comment on this review below, you
can also post your benchmarks in our forum.


")


