 |
Review: Intel SSD DC S3700 200GB |
Introduction
Welcome to Myce’s first Enterprise class Solid State Storage
(SSS) solution review.
We are delighted that this review is for an Intel DC S3700
200GB SATA SSD, which is widely regarded as a first class Enterprise solution.
The DC S3700 is a breakthrough product for Intel, which has
propelled them into, once again, being a competitive player in the Enterprise
Space. With the DC S3700 Intel has pushed a new byword and yardstick into the
evaluation of SSS solutions – “Consistency”.
So, we were excited to see if the DC S3700 would live up to
its reputation when scrutinised by Myce’s new OakGate Technology based
Enterprise Test Bench.
I take this opportunity to thank the excellent Intel
personnel that quickly and effectively responded to some questions that were
thrown up by our testing – more about this later.
Market Positioning and Specification
Market Positioning
As the ‘Data Center’ in the name suggests, Intel targets the
DC S3700 directly at modern day Data Centres.
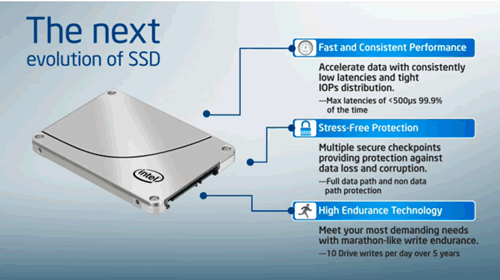
Here is how Intel positions the DC S3700 (taken directly from
Intel’s web site).

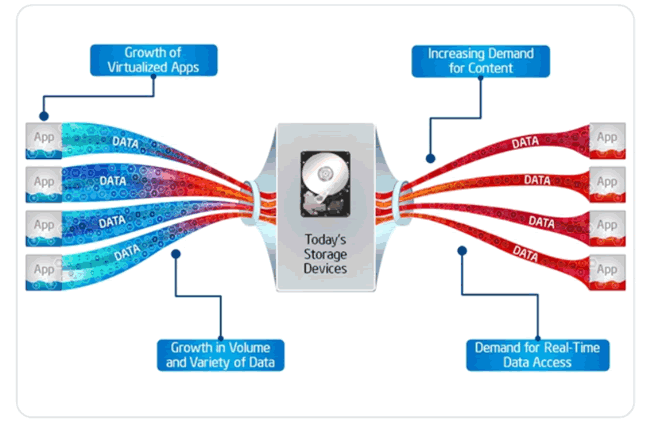

The pictures above serve as a useful reminder that the rate
of data transfer is not really so much about the speed data moves at, but is
about the width of the channel that it travels along. To use a well used
analogy – the wider a motorway is (the more lanes it has) then the more cars
that can pass along at any given speed.
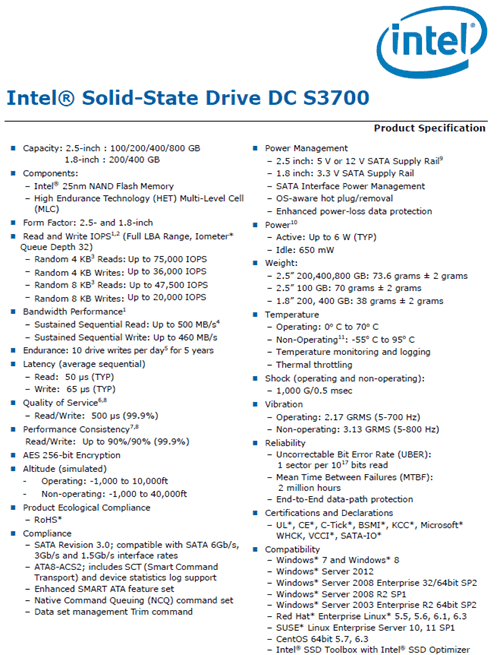
Specification
Here is Intel’s detailed specification for the DC S3700
(taken directly from Intel’s Product Specification PDF) -
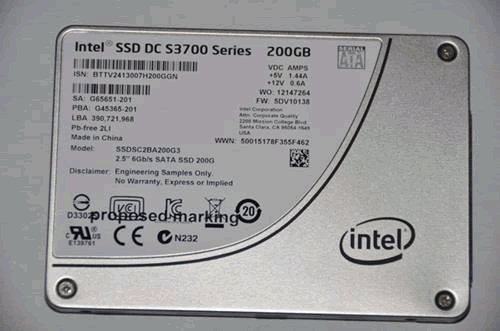
Product Image
Now let's head to the next page, to look at Myce’s
Enterprise Testing Methodology.....
Testing Methodology
Please click
here
to view or download a detailed introduction to Myce’s Enterprise Class Solid
State Storage (‘SSS’) Testing Methodology as a PDF.
Put briefly:
All testing is performed on an OakGate Technology test unit
We perform two sets of Performance Tests:
- A full set of the mandatory Storage Network Industry
Association’s (‘SNIA’) tests as specified in their Solid State Storage
Performance Test Specification Enterprise V1.0 – SNIA
SSS PTS Version 1.0. - A set of tests, known as the ‘Myce/Oakgate Full
Characterisation Test Set’, that provides readers with a fuller
characterisation of the solution.
We also review other important factors such as Power
Consumption, Data Reliability and Failover features.
A word about SNIA testing – before striking a partnership
with OakGate Technology I spent some time researching how I may implement SNIA
testing using freely available tools such as IOMeter and FIO. I arrived at a
conclusion that whilst it was theoretically possible it was impractical. The
reason for this is as without the automation offered by a test bench, such as
the OakGate Unit, the only way to meet the SSS PTS requirements is to run the
maximum number of test cycles and then to manually look back at the results to
determine when/if steady state has been achieved in the workload specific test
cycle, and then harvest the data from the qualifying Measurement Window – this
means that the test runs would always take a maximum elapsed time, and there
would be a great deal of human effort required to review, gather, and report
upon the data. I empathise with, acknowledge and respect the efforts of other
reviewers who endeavour to meet the SNIA’s principles in their testing - I am
privileged and thankful to be able to use a superb test bench which automates
the whole process and allows me to meet the SNIA’s specification in full.
Before we move on, let’s remind ourselves of some basics –
When reviewing the performance of an SSS solution there are
three basic metrics that we look at:
1. IOPS – the number of
Input/Output Operations per Second
2. Bandwidth – the number of
bytes transferred per second (usually measured in Megabytes per second, ‘MBs’)
3. Latency – the amount of time
each IO request will take to complete (usually, in the context of SSS
solutions, measured in Microseconds, which are millionths of a second).
It is true to say that IOPS and Bandwidth had all been
growing rapidly before the advent of SSS solutions, but Latency can only be significantly
decreased by eliminating mechanical devices, and thus Latency is the single
most important aspect that SSS solutions deliver to enhance performance.
Latency in a technical environment is synonymous with delay.
In the context of an SSS solution it is the amount of time between an IO
request being made, and when the request is serviced.
Bandwidth, also commonly referred to as ‘Throughput’, is the
amount of data that can be transferred from a storage device to a host, in a
given amount of time. In the context of SSS solutions it is typically measured
in Megabytes per second (MBs).
A great enterprise SSS solution
offers an effective balance of all three metrics. High IOPS and Bandwidth is
simply not enough if Latency (the delay in an IO operation) is too high. As we
will see in the test results presented below, as Latency increases IOPS will
inevitably decrease.
Queue Depth is the average amount
of IO requests outstanding. If you are running an application and the Average
Queue Depth is one or higher and CPU utilisation is low, then the application’s
performance is most probably suffering from a ‘Storage Bottleneck’.
Another important factor to
remember is that SSS performance is influenced by previous workloads, not just
the current workload, and especially by what has previously been written to the
drive. As specified in the SNIA SSS PTS the goal of all good Enterprise level
testing is to provide consistent circumstances, so that results can be compared
fairly across different SSS solutions – it is for this reason that all of our
tests start with a purge of the drive, so that it starts in a ‘Fresh Out of the
Box’ (FOB) state. Most tests then have a pre-conditioning phase where the
drive is put into a ‘Steady State’ before the test phase begins. Put briefly, a
‘Steady State’ is achieved when the performance of the drive no longer varies
over time and settles into a consistent level of performance for the workload
in hand. You can find a detailed explanation of ‘Steady State’ and how it is
determined in the SNIA tests in our Enterprise Testing Methodology paper, which
can be viewed or downloaded as a PDF by clicking here.
For interest, here are some
generally accepted assumptions that differentiate the use and therefore the
approach to testing Enterprise/Server and Consumer/Client SSS solutions:
Enterprise/Server SSS
assumptions:
- The drive is always full
- The drive is being accessed
100% of the time (i.e. the drive gets no idle time) - Failure is catastrophic for
many users
·
The Enterprise market chooses SSS
solutions based on their performance in steady state, and that steady state,
full, and worst case are not the same thing
Consumer/Client SSS
assumptions:
·
The drive typically has less than
50% of its user space occupied
·
The drive is accessed around 8
hours per day, 5 days per week, and typically data is written far less
frequently
·
Failure is catastrophic for a
single user
·
The consumer/client market
generally chooses SSS solutions based on their performance in the FOB state
Esther
Spanjer, Director, SSD Technical Marketing at Smart Storage Systems, said, 'I
am happy to commend Myce for their high level of professionalism and
cooperation during the review process', Ms. Spanjer added, 'I wish them every
success in their partnership with OakGate Technology and their initiative to
provide authoritative performance reviews for the Enterprise Solid State
Storage market'
Now let's head to the next page, to look at the results
of our SNIA IOPS (Input/Output Operations per Second) Test.....
SNIA IOPS Test
Here is the specification for this test -

IOPS performance will typically
vary greatly depending on the nature of the IO traffic, including the mixture
of Read and Write operations, and the mixture of Block Sizes (the size of the
IO operation’s data packet, also referred to as IO Size). This test is designed
to benchmark the IOPS performance profile for random IO operations for 56
different combinations of Read/Write mix % and Block Sizes when in a Steady
State, which are of interest to most users.
All of the SNIA’s test
specifications define a ‘required’ set of parameters that must be run for the
test and then allows the operator to elect to run additional tests with
different parameters of their choice. It is the mandatory test with the
required parameters that we run. Note that all of the mandatory tests must be
conducted with random data.
As previously mentioned, a key
principle of SNIA testing is to provide a consistent basis for comparing
different solutions from different manufacturers - myce.com/blog will be in a strong
position to publish meaningful comparisons as we gain more experience in the
review of Enterprise level SSS solutions.
Here is the report of the results -

The second table confirms the Range in the Measurement
Window (the maximum variation of a 4K Round value from the Average of the 4K Round
values) and the slope of the best linear fit through the 4K values (please see
Testing Methodology paper for a detailed specification of the criteria for
determining the achievement of Steady State, click here)

You can see here that Steady State Convergence was
determined at the end of Round 5. The Steady State Convergence Plot provides a
visual confirmation of Steady State Convergence.

This graph shows the average results gathered in the
Measurement Window. You can see an expected drop in IOPS performance as IO size
increases and/or the percentage of Writes increases.

This is an alternative method for presenting the results
from the Measurement Window; one which personally I prefer. Users can simply
refer to the table to obtain the R/W mix and Block Size value of
interest. For example, Online Transaction Processing applications
typically run at a Block Size of 8K and a Read/Write Mix of 65/35, and Users
can quickly understand how the device might perform under Steady State for
these access characteristics.
Now let's head to the next page, where to look at the
results of the SNIA Write Saturation Test.....
SNIA Write Saturation Test
Here is the specification for this test -

The objective of this test is
to observe the time evolution of the drive’s performance, as a function of
time, from a ‘factory fresh’, ‘fresh out of the box’ (‘FOB’) state. When a
drive is in a FOB state (e.g. after it has been purged by, for example by a
SATA Secure Erase), we can expect an initial period of time when writes can
easily be accommodated by clean/empty blocks, but once all of the clean blocks
have been written to once and the drive’s controller must first clean blocks
(with erase write operations) before it can write new data, then we can expect
a slow down. The slow-down is usually quite dramatic and is commonly referred
to as the ‘write cliff’.
The Write Saturation Test is
easy to run as it requires no steady state determination – it can be easily run
in freely available software, such as IOMeter.
Here is the report of the
results -


You can see here the decline in Write IOPS performance as
the DC S3700 drops towards a Steady State. The marked fall, at around Round 17,
occurs, I assume, when all of the available NAND has been written to once and
the drive must clean blocks on the fly in preparation for accommodating further
writes – this is commonly referred to as the ‘Write Cliff’.
This is a typical picture of behaviour, and you can see that
the drive is achieving a steady state by Round 63 at around 35,000-36,000 IOPS
(which meets Intel’s spec of up to 36,000)
Note that the test was halted, as specified in the SNIA SSS
PTS, when 4 x the User Capacity had been written to the drive.

You can see here the increase in Write latency as the DC
S3700 drops towards a Steady State. You can also see that the latency graph line
is a mirror image of the IOPS graph line.

This is a graph showing the Maximum Write Latency values
that occurred in each Round.
Now let's head to the next page, to look at the SNIA
Throughput Test.....
SNIA Throughput Test
Here is the specification for this test -

The test is designed to measure the sequential Read and
Write IO performance for several Block Sizes, when under Steady State
conditions. One can easily compare the results produced by this test with
box-top numbers, which are usually stated as “Up to xxx MB/S”.
Here is the report of the results -


You can see here that Steady State was achieved for all Write
IO sizes by the end of Round 5.

You can see here that Steady State for all Read IO sizes was
achieved by the end of Round 6.

You can see here the average of the values recorded in the
Measurement Window, and that the highest ‘steady state’ write and read
throughput (at IO Size 1024K) is 396.04 MBs and 518.27 MBs respectively. The
Read result compares well to Intel’s specified ‘Up to 500 MB/s’ but the Write
result falls short of Intel’s specified ‘Up to 460 MBs’, but note that the test
was run with write cache disabled and this could well account for some of the
shortfall (we’ll come back to this later) and/or the ‘Up to’ value may not be
for the 200GB model.
Now let's head to the next page, to look at the results
of the SNIA Latency Test.....
SNIA Latency Test
Here is the specification for this test -

The Latency Test measures average and maximum response times
using random IOs at specified Block Sizes and Read/Write mixes, taken under
steady state conditions. The test runs at a Queue Depth of 1 (1 outstanding
IO), thus the results give the baseline response time for a single IO request.
The test also reports maximum latency values, which can be
helpful to see if there might be processes within the drive that may cause max
Latency values to become larger.
Here is the report of the results -


These are the Average and Maximum Latency Values observed in
the Measurement Window (measured in Milliseconds).

You can see here that Steady State Convergence was achieved
at the end of Round 9 (for a detailed specification of the rules for the
determination of Steady State, please see the Myce Enterprise SSS Testing
Methodology paper).

You can see here a graph of the Maximum Latency results.

Here is a 3D graph showing, at a glance, the Maximum Latency
values for each combination of Read/Write Mix and IO Size. You can see that
the Max Latency Values are far greater than the following Average values – it
begs the question of how frequently they occur (we’ll look at this later on).

Here is a 3D graph showing, at a glance, the Average Latency
values for each combination of Read/Write Mix and IO Size.
Now let's head to the next page, to look at the results
for the Myce/OakGate Read and Write Latency Tests......
Myce/OakGate 4K Read and Write Latency Tests
Here are the specifications for the tests -


These tests steadily increase the random 4K IO demand in
terms of IOPS, and report the drives response in terms of Average IOPS, Average
Latency and Maximum Latency. It is designed to show a drive’s maximum IOPS
capability and report the all important Latency numbers for each level of IOPS
demanded. The Maximum latency numbers give us an insight into the occurrence
of Latency peaks that could cause an unexpected response from time to time.
Here are the results –
Firstly, here is a graph showing the result for the
Pre-Conditioning in Step 2 -

I find the repetitive ‘saw tooth’ shape of the graph line
fascinating; it suggests to me that there is some form of cyclic pattern to the
DC S3700 firmware’s operations.
4K Latency Read Test

You can see that the drive can no longer meet the increase
in IOPS demand at just over 75,000 IOPS (right on Intel’s spec).

You can see that the average read latency remains below 175
Microseconds all the way up to 75,000 IOPS.

Here you can see some curious Maximum Latency Peaks,
seemingly occurring at regular time intervals. This demands further
investigation, so here is a zoom into the Latency scores that contributed to
the 70,000 IOPS plot –

As this is the first time, we are looking at a High
Resolution Latency Histogram, here’s an explanation – The x axis to the left is
the count of the IOs in the observation period (in a Round) that had a Latency
of the value along the Y axis (please note that the x axis is logarithmic to
allow the low order counts of the huge number of IOs that have been measured to
be visible); the y axis is the Latency value measured in Microseconds; The x
axis to the right is the % of the Total IOs observed that have a Latency <=
to a given Latency value; the rate of getting to 100% is highlighted by the red
graph line.
You can now see that the overwhelming majority of IOs are
below 500 Microseconds and that there are relatively few outlying exceptions.
So nothing much to worry about, but I felt that the
seemingly regular occurrences of the latency spikes warranted asking Intel if
they could offer an explanation.
Intel’s response was - “It seems the test that was run
displayed expected results given the atypical workload and will not cause any
significant customer impact. That said, we would prefer not to quote max
latency in this context, it doesn’t say much about the operation of the
drive.... We believe OakGate has the concept of QoS binning testing much like
we use for measuring latencies. This is a much preferred way to look at it. We
use the Max latencies graph as a way to highlight if we need to dig into QoS if
we have a massive outlier.”
QoS stands for ‘Quality of Service’.
OK, that’s fair comment and I have no argument, but I was
personally interested to look a bit harder. So, having prefilled the drive, I
ran a 4K Sequential Read Test at a Queue Depth of 1, for 2 hours. The test
repeated a loop 120 times and in each loop there was a 9 second warm up period
followed by 51 seconds of performance monitoring. This would allow us to see
if the Maximum Latency spikes occur in sequential operations, and also to
compare the baseline latencies observed to Intel’s specification. Here is the
result –

You can see that the regular spikes are again occurring in
this test – starting in the 7th Round, they then occur in every
subsequent 13th round. So, let’s look at the detailed latency
histogram of all the IOs in a round with a spike (Round 60)–

You can see here that 99.9% of the IOs in Round 60 completed
with a Latency <= 50 Microseconds. If you look carefully, there is just one
relatively massive outlier with a Latency of 10,005 Microseconds. This
histogram is an implementation of the ‘QoS binning’ approach that Intel
mentioned they prefer. Intel specifies the DCS3700’s QoS as – Read/Write 500
Microseconds for 99.9% of IOs, for 4KB random IOs in a Steady State, at a Queue
depth of 1 (we’ll look at this in a moment)
Now let’s look at the detailed latency histogram for all of
the IOs in a typical round.

Here you can see that 99.9% in Round 55 completed with a
Latency of 30 Microseconds. Intel specifies that the typical Sequential Read
Latency for a DC S3700 is 50 Microseconds. I don’t like the use of ‘typical’ as
I don’t understand what typical means – but in the context of this test, the
specified ‘typical’ Read Latency is, by any reasonable interpretation of
‘typical’, certainly beaten.
Last word on the Maximum Latency peaks – I can’t help
wondering what activity the firmware performs roughly every 13 minutes that
could give rise to the regular Max Latency spikes, but whatever it is, I guess
it must be important.
So, as we have touched upon the subject of Intel’s QoS
specification, let’s take a look at this now. Remember Intel specifies the
DCS3700’s QoS as – ‘Read/Write 500 Microseconds (99.9%)’ for Random 4K IOs at a
Queue Depth of 1, when in a Steady State.
I was not sure if this meant 99.9% of IOs in mixed
Read/Write traffic, or for 100% Reads traffic and 100% Writes traffic,
separately. So I decided to test both. So, I first ran a test that consisted
of i) Purge ii) Preconditioning the drive by performing 4K random Writes for 2
hours iii) Performing a 50/50 Read/Write mix of 4K random Reads and Writes for
120 rounds, with each round consisting of 9 seconds warm up time and 51 seconds
performance monitoring... and then I ran the test again but with step iii)
becoming - perform 100% Random 4K Writes for 120 rounds and then perform 100%
4K Reads for 120 Rounds.
Here are the results for the 50/50 Read/Write Mix –

You can see the Average Read Latency is about 155
Microseconds and that it blips up in a 13 round cycle.

You can see the typical Ave Write Latency per round is 25
Microseconds, except where it blips up in a 13 round cycle.

You can see here in the High Resolution Read Latency
Histogram for Round 28 that 99.9% of Read IOs have a Latency <= 2240
Microseconds, which doesn’t compare well with Intel’s spec. of 500 Microseconds
(so perhaps Intel’s spec. is for separate Reads and Writes); however, 95% of
IOs have a latency <= 530 Microseconds

You can see here in the High Resolution Write latency
Histogram for Round 25, that 99.9% of Write IOs have a Latency <= 450
Microseconds, which is inside Intel’s spec. of 500.
Here are the results for the separate Writes and Reads Tests
–

Here you can see that the Average Write Latency per round is
around 35 Microseconds.

In the High Resolution Write Latency Histogram for Round 64
you can see that 99.9% of the Write IOs have a latency <= 430 Microseconds,
which is comfortably within Intel’s spec. of 500.

Here you can see that the Average Read Latency per Round is
90 Microseconds, except where it blips up on a 13 Round cycle.

In the High Resolution Read Latency Histogram for Round 28
(a typical round) you can see that 99.9% of the Read IOs have a latency <=
100 Microseconds, which is very comfortably within Intel’s spec. of 500.
I do wish manufacturers would make it clear what their
numbers mean (or is it just that I lack experience).
4K Latency Write Test

Here you can see that the drive can no longer meet the
increase in IOPS demand at just over 32,500 (a wee bit short of Intel’s spec in
the context of this test).

Here we can see that the average latency remains below 200
micro seconds all the way up to 32,500 IOPS.

The result is a bit spiky, but arguably this is typical and
I feel it is no cause for concern.
Now let's head to the next page, to look at the results
for the Myce/Oakgate Reads and Writes Tests.....
Myce/OakGate Reads and Writes Tests
Here is the specification of the tests -

The tests are designed to show the Random and Sequential,
Read and Write, performance metrics for different combinations of Queue Depth
and IO size.
Here are the results -
Random Reads

You can see here that Read IOPS does not scale beyond a
queue depth of 16/32. You can also see that the level of IOPS for 4KB writes,
at a Queue Depth of 32 is slightly over Intel’s specified value of up to
75,000.

You can see here that bandwidth doesn’t scale beyond a queue
depth of 16/32.

You can see here that Read Latency does not change over a
queue depth of 32. I think we can conclude that the Intel effectively operates
at a maximum queue depth of 32.
Random Writes

You can see here that there is no effective scaling for
Random Writes IOPS above a queue depth of 2. You can also see that the level
of IOPS for 4KB Writes, at a Queue Depth of 32 is below Intel’s specified value
of up to 36,000.

Similarly you can see here that there is no effective
scaling in Random Writes bandwidth above a queue depth of 2.

Sequential Reads

You can see here that, just as for Random Reads, there is no
effective scaling in Sequential Read IOPS beyond a queue depth of 16/32.

You can see here that there is no effective scaling in
Sequential Read bandwidth beyond a queue depth of 16/32.

You can see here that there is no change in Sequential Read
latency beyond a queue depth of 32.
Sequential Writes

You can see here that there is no effective scaling for
Sequential Writes IOPS above a queue depth of 8.

You can see here that there is no effective scaling for
Sequential Writes bandwidth above a queue depth of 8.

You can see here that there is no change in Sequential
Writes latency beyond a queue depth of 32.
Remember back in the SNIA Throughput Test I said we’d take a
look at Intel’s specified Throughput numbers of –
‘Sustained Sequential Read: Up to 500MB/s’ and ‘Sustained
Sequential Write: Up to 460MB/s’
Let’s have a look now. To do this I have run a simple test:
i) Purge the Device ii) For 2 hours perform sequential 1024K (block size)
writes at a Queue Depth of 32 iii) For 2 hours perform sequential 1024K reads
at a Queue Depth of 32, and in this test I have enabled Write Caching. Here
are the results:

You can see the write speed falls slightly after
approximately 700 seconds as the drive reaches a Steady State. Let’s zoom in
on part of the graph line, which is in Steady state to take a closer look.

You can see a cyclic pattern again and the bandwidth spends
most of the time at around 390MBs but then falls to around 355 MBs for the rest
of the time. This doesn’t compare well to Intel’s spec. of - ‘Sustained
Sequential Write: Up to 460MB/s’, but I notice that an explanatory note is
tagged to the Bandwidth Performance values, which says – ‘Performance Values
vary by capacity and form factor’; so I assume that the up to 460MBs applies to
the 400GB and/or 800GB models.

Here is the graph for Read Bandwidth performance. You can
see that the specified - ‘Sustained Sequential Read: Up to 500MB/s’ is being
exceeded.

For interest, here is a zoomed in picture of part of the
graph line.
Now let's head to the next page, to look at the results
for the Myce/Oakgate 4K Mixed Reads/Writes Tests.....
NEW PAGE NEW PAGE NEW PAGE NEW PAGE
Myce/OakGate 4K Mixed Reads/Writes Tests

This test is designed to show the performance metrics for
different combinations of Queue Depth and Read/Write mix (the % of Reads and
the % of Writes making up the IO traffic)
4K Mixed R/W Test

As would be expected, there is a gradual decrease in Read
IOPS as the percentage of Writes increases. There is no dramatic fall off when
a small percentage of writing commences.

As would be expected there is a gradual increase in Write
IOPS as the percentage of Writes increases.

As would be expected, the total IOPS is at its greatest when
there is little or no Write activity.

As would be expected, there is a gradual decrease in Read
bandwidth as the percentage of Writes increases.

As would be expected, there is a gradual increase in Write
bandwidth as the percentage of writes increases.

As would be expected, the total bandwidth is at its greatest
when there is little or no write activity.

As would be expected, there is a gradual decrease in Read
Latency as the percentage of Writes increases.

As would be expected, there is a gradual increase in Write
latency as the percentage of writes increases.

Now let's head to the next page, to look at the results
of the Myce/OakGate Entropy Tests.....
Myce/OakGate Entropy Tests

These tests are designed to show performance metrics for
different combinations of Queue Depth and Entropy % (Entropy % is the
percentage of the data that is random). Testing with different Entropy % has
become important with the advent of controllers, such as those from LSI
Sandforce, that compress data before writing it to NAND. Controllers that
compress data can be expected to perform better with highly compressible data
(i.e. data with a low Entropy).
The first test performs 5 minutes of Random 4K writes for
each combination of Queue Depth and Entropy %.
The second test does the same thing for a mixture of Read
and Write traffic (70% Reads, 30% Writes).
4K Entropy Write Test

As would be expected with a controller that does not
compress data, there is little or no variance in performance to be found in any
of the Entropy tests, as the degree of random data increases (and this comment
applies to all of the test results for the Myce/OakGate Entropy Tests).

4K Entropy 70%_Reads_30%_Writes Test


Now let's head to the next page, to look at Power
Consumption and Data Reliability.....
Power Consumption and Data Reliability
Power Consumption
I believe most people know that data centres are already one
of the major consumers of electricity in the industrialised world; indeed it is
estimated that currently 2% of all electricity consumption goes into IT
applications. According to the European Union the energy consumption of data
centres was 46 Terawatt hours in 2006 and is set to rise to 93 TWhrs by 2020;
this is equivalent to one hundred million 100W light bulbs burning 24 hours a
day, 365 days a year.
Typically 40% of the power consumed by data centres is for
the IT load and 35% is for cooling the system. Generally speaking, if a drive
consumes more power it will produce more heat – so power consumption is indeed
a double edged sword. It is no surprise that a significant proportion of a
data centre’s power consumption goes on servers. I understand cloud based
applications, such as Facebook, are the primary cause of the growth in servers
and the demand for storage space.
I recently listened to a BBC Radio 4 Programme that quoted
IBM as saying that 90% of the world’s data has been created in the last 2 years
– staggering!
I’ve heard that Google has more than 1 million servers and
that Microsoft has more than 300,000 in its Chicago based data centre alone –
fortunately for humanity the very large players are also amongst the most
efficient (understandable, as the economics associated with power consumption
are for them huge). So suffice to say, the power consumption of SSS Enterprise
solutions is a very important global consideration.
The following graph uses the typical Power Consumption, when
active, as published in the respective manufacturer’s specification. (please note
that the value for the Samsung 843 is the average of the typical read active
and write active values, as specified by Samsung)

The Intel DC S3700’s can be regarded as reasonably typical
for a SATA drive, but is not as competitive as recent solutions from Seagate
and Samsung.
Data Reliability
UBER –(as defined by JEDEC, the global leader in developing
open standards for the microelectronic industry) is a metric for data
corruption rate equal to the number of data errors per bit read after applying
any specified error correction method. It stands for ‘Unrecoverable Bit Error
Rate’. JEDEC specifies that an Enterprise level SSS solution must have a value
>= 1 x 10¹⁶.

The Intel DC S3700 exceeds the JEDEC requirement and has a
competitive UBER of 1 x 10¹⁷.
Endurance is warranted at 10 Drive Writes per Day (DWPD) for
5 years.
This is how Intel outlines the Data Reliability and Security
features of the DC S3700 -
The Intel SSD DC S3700 Series
combines the following features to provide an SSD you can count on.
Full End to End data
protection. Protects your data from the time it enters the drive to the
time it leaves. The DC S3700 uses an advance error correction scheme that
ensures data integrity by protecting against possible data corruption in the
NAND, SRAM, and DRAM memory. The DC S3700 also protects the data in transit
through several techniques such as parity checks, Cyclic Redundancy Checks
(CRC) and LBA tag validation. Once an error is detected, an immediate attempt
will be made to correct it, and any uncorrectable error will be reported to the
host. To further improve data assurance, the Intel SSD DC S3700 provides an
array of surplus flash memory that caches data to minimize potential data loss.
Advanced Encryption Standard
(AES) Capable. Protects your data from external threats and internal system
issues with 256-bit encryption technology, giving you the peace of mind that
your company’s data is secure and safe.
Enhanced Power-Loss Data
Protection. Reduces potential data loss by detecting and protecting data
from an unexpected system power loss. The drive saves all cached data in the
process of being written before shutting down, thereby minimizing potential
data loss.
High
Endurance Technology
Meet your most demanding needs
with marathon-like write endurance.
Incorporating High Endurance
Technology (HET), the Intel® Solid-State Drive DC S3700 Series delivers
single-level cell (SLC) solid-state drive like endurance in a multi-level cell
(MLC) SSD package. By combining SSD NAND management techniques and NAND silicon
enhancements, HET enables the DC S3700 to achieve 10 Drive Writes per Day
(DWPD) over a 5 year drive life. For the DC S3700 800GB that’s equivalent to
recording over 186 years of HD video over the life of the drive.
Now let's head to the next page, to look at the
Conclusions of this review.....
Conclusions
The Intel SSD DC S3700 is a state of the art SATA based
Enterprise drive.
It offers an excellent balance of performance together with
endurance, data reliability, and data integrity features.
I understand Intel’s recommended channel pricing for the
200GB 2.5” model is USD 470. I found the 200GB listed by dabs.com in the UK
for £384.
It is easy to imagine that discounts would be available for
large Enterprise customers buying in a large volume.
Myce thanks Intel for supplying a sample for review.
We were delighted that our first Enterprise review was
performed on a drive from a world class manufacturer. For Myce.wiki, it creates
an excellent yardstick and basis for comparing subsequent SATA based Enterprise
solutions that we hope to review.
I am pleased to award the drive a rating of Excellent and to
name it as the current Editor’s Choice from amongst SATA based Enterprise
solutions.
Final Words – The Intel SSD DCS3700 deserves its reputation
as a first class Enterprise SSS solution.


")


