 |
Review: Kingston SSDNow E100 100GB |
Welcome to Myce’s review of the Kingston SSDNow E100 SATA
Enterprise SSD.
The Kingston E100 can be described as a mainstream
enterprise solution. It packages together 128GB of 32nm Toshiba Toggle NAND
(with 28GB set aside for use by the controller) and an LSI Sandforce SF-2582
controller.
LSI Sandforce controllers, or Flash Storage Processors
(‘FSPs’) as LSI Sandforce prefers to call them, have been hugely successful and
are used by many SSD manufacturers. I remember well my first experience with a
Sandforce FSP which was a few years ago, with an OCZ Vertex LE with a 3Gb/s,
first generation, SF controller. As a member of the OCZ Support forum it was a
lot of fun trying to figure out how the drive behaved.
The LSI Sandforce FSPs have a special capability – they can,
where possible, compress data before it is written to NAND. As this is the
first LSI Sandforce Enterprise drive we have reviewed we look at what makes
them special on Page 3 below.
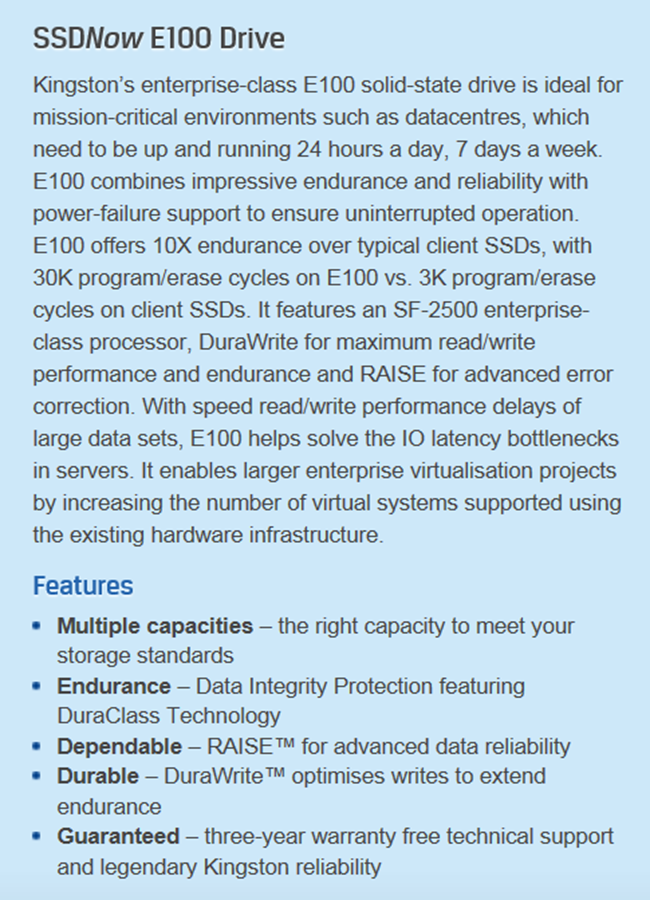
Market Positioning and Specification
Market Positioning
This is how Kingston positions the E100 -
Specification
Here is Kingston’s specification for the E100 (taken
directly from Kingston’s E100 Data Sheet) -
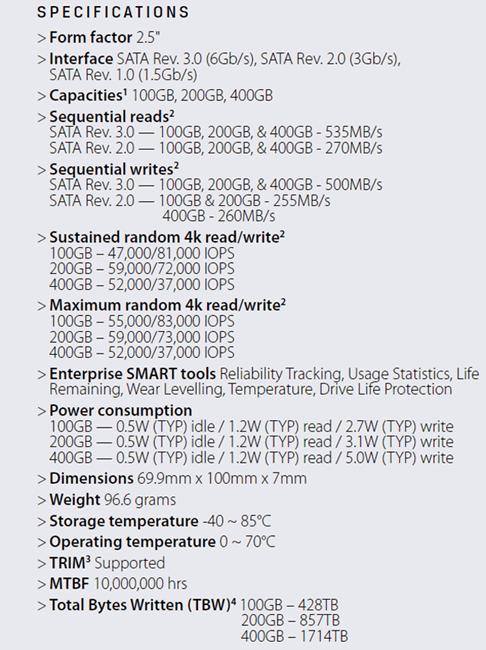
Please note that all the performance figures are for a drive
in a ‘Fresh Out of the Box’, ‘FOB’ state, which I feel is not at all helpful
for an enterprise drive as enterprise drives should be tested and measured in
steady state conditions.
The Toshiba toggle NAND used by the E100 is, I understand,
good for 30,000 Program/Erase Cycles.
Product Image
Here is a picture of the Kingston E100 SSDNow E100
that I tested –

Now let's head to the next page, to look at Myce’s
Enterprise Testing Methodology.....
Please click
here
to view or download a detailed introduction to Myce’s Enterprise Class Solid
State Storage (‘SSS’) Testing Methodology as a PDF.
Put briefly:
All testing is performed on an OakGate Technology test unit
We perform two sets of Performance Tests:
- A full set of the mandatory Storage Network Industry
Association’s (‘SNIA’) tests as specified in their Solid State Storage
Performance Test Specification Enterprise V1.0 – SNIA
SSS PTS Version 1.0. - A set of tests, known as the ‘Myce/OakGate Full
Characterisation Test Set’, that provides readers with a fuller
characterisation of the solution.
We also review other important factors such as Power
Consumption, Data Reliability and Failover features.
A word about SNIA testing – before striking a partnership
with OakGate Technology I spent some time researching how I may implement SNIA
testing using freely available tools such as IOMeter and FIO. I arrived at the
conclusion that whilst it was theoretically possible it was impractical. The
reason for this is as without the automation offered by a test bench, such as
the OakGate Unit, the only way to meet the SSS PTS requirements is to run the maximum
number of test cycles and then to manually look back at the results to
determine when/if steady state has been achieved in the workload specific test
cycle, and then harvest the data from the qualifying Measurement Window. this
means that the test runs would always take a maximum elapsed time, and there
would be a great deal of human effort required to review, gather, and report
upon the data. I empathise with, acknowledge and respect the efforts of other
reviewers who endeavour to meet the SNIA’s principles in their testing - I am
privileged and thankful to be able to use a superb test bench which automates
the whole process and allows me to meet the SNIA’s specification in full.
Before we move on, let’s remind ourselves of some basics –
When reviewing the performance of an SSS solution there are
three basic metrics that we look at:
1. IOPS – the number of
Input/Output Operations per Second
2. Bandwidth – the number of
bytes transferred per second (usually measured in Megabytes per second, ‘MB/s’)
3. Latency – the amount of time
each IO request will take to complete (usually, in the context of SSS
solutions, measured in Microseconds, which are millionths of a second).
It is true to say that IOPS and Bandwidth had all been
growing rapidly before the advent of SSS solutions, but Latency can only be significantly
decreased by eliminating mechanical devices, and thus Latency is the single
most important aspect that SSS solutions deliver to enhance performance.
Latency in a technical environment is synonymous with delay.
In the context of an SSS solution it is the amount of time between an IO
request being made, and when the request is serviced.
Bandwidth, also commonly referred to as ‘Throughput’, is the
amount of data that can be transferred from a storage device to a host, in a
given amount of time. In the context of SSS solutions it is typically measured
in Megabytes per second (MB/s).
A great enterprise SSS solution
offers an effective balance of all three metrics. High IOPS and Bandwidth is
simply not enough if Latency (the delay in an IO operation) is too high. As we
will see in the test results presented below, as Latency increases IOPS will
inevitably decrease.
Queue Depth is the average amount
of IO requests outstanding. If you are running an application and the Average
Queue Depth is one or higher and CPU utilisation is low, then the application’s
performance is most probably suffering from a ‘Storage Bottleneck’.
Another important factor to
remember is that SSS performance is influenced by previous workloads, not just
the current workload, and especially by what has previously been written to the
drive. As specified in the SNIA SSS PTS the goal of all good Enterprise level
testing is to provide consistent circumstances, so that results can be compared
fairly across different SSS solutions – it is for this reason that all of our
tests start with a purge of the drive, so that it starts in a ‘Fresh Out of the
Box’ (FOB) state. Most tests then have a pre-conditioning phase where the
drive is put into a ‘Steady State’ before the test phase begins. Put briefly, a
‘Steady State’ is achieved when the performance of the drive no longer varies
over time and settles into a consistent level of performance for the workload
in hand. You can find a detailed explanation of ‘Steady State’ and how it is
determined in the SNIA tests in our Enterprise Testing Methodology paper, which
can be viewed or downloaded as a PDF by clicking here.
For interest, here are some
generally accepted assumptions that differentiate the use and therefore the
approach to testing Enterprise/Server and Consumer/Client SSS solutions:
Enterprise/Server SSS assumptions:
- The drive is always full
- The drive is being accessed 100% of the time (i.e. the
drive gets no idle time) - Failure is catastrophic for many users
- The Enterprise market chooses SSS solutions based on their
performance in steady state, and that steady state, full, and worst case
are not the same thing
Consumer/Client SSS
assumptions:
- The drive typically has less than 50% of its user space
occupied - The drive is accessed around 8 hours per day, 5 days per
week, and typically data is written far less frequently - Failure is catastrophic for a single user
- The consumer/client market generally chooses SSS solutions
based on their performance in the FOB state
Esther
Spanjer, Director, SSD Technical Marketing at Smart Storage Systems, said, 'I
am happy to commend Myce for their high level of professionalism and
cooperation during the review process', Ms. Spanjer added, 'I wish them every
success in their partnership with OakGate Technology and their initiative to
provide authoritative performance reviews for the Enterprise Solid State
Storage market'
Now let's head to the next page, to look at an
introduction to LSI Sandforce Flash Storage Processors.....
Data Compression
LSI Sandforce FSPs have a very special feature - where
possible, they can compress data before it is written to NAND.
So, LSI Sandforce FSPs spurred us all to focus on the Write
Amplitude Factor (‘WAF’) and the benefits of reducing it.
Write Amplitude factor (‘WAF’) is simply the ratio of the
amount of data written by the host relative to the amount of data written to
the NAND - calculated as Data Written to NAND / Data Written by the Host.
Remember that once all pages have been written to once then blocks (groups of
pages) must be cleaned before they can be written to again - so with a
conventional controller, that does not compress data, the very best write
amplitude one can achieve is 2 (once all of the NAND has been written to
once). There are many other factors, such as Garbage Collection and Wear
Levelling activities, that also have a negative effect on WAF. Obviously, if
the WAF can be reduced through compression then it will have a very positive
effect on Endurance.
There are though many types of data such as videos and
photographs that are very largely incompressible and if an application mainly
uses these types of data (for example, YouTube) then little or no advantage can
be gained. However, many Enterprise applications, such as email servers,
content servers and database applications use compressible data – so arguably
compression offers a real advantage to many, or indeed most, Enterprise Users.
Kingston measures the endurance of their drives in ‘Total
Bytes Written’ (‘TBW’) – however, it is important to remember that TBW varies a
lot depending on the WAF assumed in its calculation. TBW is calculated as – Physical
Capacity x Flash Cell Life / Write Amplitude Factor. Flash cell Life is
the number of Program/Erase cycles supported by the NAND. In the E100 the 32nm
Toshiba Toggle NAND supports 30,000 cycles. Kingston specifies a TBW of 428TB
for the 100GB drive. Thus we can calculate the WAF Kingston has used in their
calculation as 30,000 x 100GB / 428TB = 3,000,000GB / 438,272GB = 6.845 – which
seems to me to be quite conservative.
In this review we should see some interesting results in the
Myce/OakGate Entropy Tests, as varying the Entropy level of data (the degree of
randomness of the data) is equivalent to varying the degree of compressibility
of the data, so an Entropy level of 100% is incompressible.
LSI Sandforce FSPs also have other valuable features as
follows (taken directly from the LSI Sandforce website) -
LSI DuraClass™ Technology
DuraClass technology represents a set of NAND flash
management features that work in tandem to deliver world-class SSD reliability,
performance, and power efficiency. It is this technology that differentiates
LSI SandForce Flash Storage Processors (FSPs) from standard flash controllers.
Of particular importance is the use of processing elements to optimally
overcome a number of the inherent issues associated with standard NAND flash
memory. DuraClass technology features include:
LSI DuraWrite™ architecture- optimizes the number of program
cycles to the flash, effectively extending flash rated endurance by 20x or more
when compared to standard controllers.
Powerful flash media error correction (ECC) and Redundant
Array of Independent Silicon Elements (RAISE) - deliver an order-of-magnitude
improvement in drive reliability versus today’s best enterprise HDDs. The
result is single-drive, RAID-like protection and recovery from potentially
catastrophic flash block failures – all while avoiding the inefficiencies of
traditional RAID.
Advanced wear levelling and monitoring - optimized wear levelling
algorithms further extending flash endurance.
Advanced read/program disturb management - safeguards
against errant re-programming of cells during read and program cycles.
Recycler - intelligently performs garbage collection with
the least impact on flash endurance.
Scalable Technology for Generations to Come
Given the smaller silicon geometries and trend toward
packing more bits per cell in flash devices, there has been a dramatic
reduction in the cost-per-Gigabyte for NAND flash-based SSDs, accelerating
deployment in mainstream applications. However, these changes have also reduced
the reliability characteristics of flash devices, resulting in lower endurance,
worse data integrity, and shorter data retention. This is elevating the
importance of advanced flash management technology . DuraClass technology is
architected to scale and compensate for standard NAND flash memory
shortcomings, ensuring SSDs can be reliably used in enterprise and client
computing environments for generations to come.
RAISE™ improves total SSD reliability

While the next generation of NAND flash memories are being
developed on smaller silicon geometries, to reach higher
densities, their endurance is significantly dropping. This is
increasing the need for and importance of advanced data protection
techniques to prevent data errors. LSI SandForce Flash
Storage Processors (FSPs) feature a higher-level ECC to protect
against correctable errors along with the innovative RAISE
technology to provide protection against uncorrectable errors. This
combination provides an uncorrectable bit error rate (UBER) of 10-29, with
nearly one quadrillion times fewer uncorrectable errors than other controllers.
RAISE technology writes data across multiple flash die
to enable recovery from a failure in a sector, page, or entire block. This
is just like the concept of multi-drive RAID used in disk-based storage,
however, RAISE only requires a single drive.
SSDs are built using flash die that are assembled up to 8
die per package. For optimum capacity, the SSD can be assembled with up to 16
packages. That puts 128 individual die in one SSD. If the failure rate
(unrecoverable read error) of one MLC die is conservatively 1,000 PPM (a
failure probability of 0.1%), then using the probability formula for 128
devices, the failure rate increases to 12.0% over the life of the SSD.
Using RAISE technology in an LSI SandForce Driven SSD
reduces the probability of a single unrecoverable read error by 100 times to
0.001%. Applying that same formula, the failure rate of the SSD drops from
12.0% to a mere 0.13%, nearly 100 times lower.

SandForce SSD Processors Encrypt Data
Security is a hot topic for
most industries and storage is not immune. Nearly all SSDs today store data
directly to flash memory without performing any encryption. These systems
support password protection techniques that prevent a would-be thief from
accessing the data on the SSD. However, the flash memory of an SSD can be
accessed directly with a special “clip” in the hands of a skilled technician,
unlike an HDD with rotating media. If the host spends time encrypting the data,
it will be secure, but this consumes valuable resources and slows the path to
the storage.
The LSI® SandForce® SF-2000
Flash Storage Processor (FSP) family solves this problem by using AES-256* and
AES-128 automatic hardware encryption to protect the information it stores on
the flash and to prevent unauthorized access. This is done at the drive level
without any host dependency and without slowing down the data transfer. The LSI
SandForce SF-2000 Client FSPs are compliant with the TCG Opal specification,
making it easier for SSD manufacturers to achieve compatibility with security
management applications. The result is simplified deployment and management of
SandForce Driven™ self-encrypting SSDs in corporate mobile computing
environments.
Now let's head to the next page, to look at the results
of our SNIA IOPS (Input/Output Operations per Second) Test.....
Here is the specification for this test -

IOPS performance will typically
vary greatly depending on the nature of the IO traffic, including the mixture
of Read and Write operations, and the mixture of Block Sizes (the size of the
IO operation’s data packet, also referred to as IO Size). This test is designed
to benchmark the IOPS performance profile for random IO operations for 56
different combinations of Read/Write mix % and Block Sizes when in a Steady
State, which are of interest to most users.
All of the SNIA’s test
specifications define a ‘required’ set of parameters that must be run for the
test and then allow the operator to elect to run additional tests with
different parameters of their choice. It is the mandatory test with the
required parameters that we run. Note that all of the mandatory tests must be
conducted with fully random data, which is worst case for the LSI Sandforce
controller used by the Kingston E100.
As previously mentioned, a key
principle of SNIA testing is to provide a consistent basis for comparing
different solutions from different manufacturers - myce.com/blog will be in a strong
position to publish meaningful comparisons as we gain more experience in the
review of Enterprise level SSS solutions.
Here is the report of the results -

The second table confirms the Range in the Measurement
Window (the maximum variation of a 4K Round value from the Average of the 4K Round
values) and the slope of the best linear fit through the 4K values (please see
Testing Methodology paper for a detailed specification of the criteria for
determining the achievement of Steady State, click here)

You can see here that Steady State Convergence was
determined at the end of Round 5. The Steady State Convergence Plot provides a
visual confirmation of Steady State Convergence.

This graph shows the average results gathered in the
Measurement Window. You can see an expected drop in IOPS performance as IO size
increases and/or the percentage of Writes increases. As Kingston specifies FOB
values we cannot directly compare the values to Kingston’s specification.

This is an alternative method for presenting the results
from the Measurement Window; one which personally I prefer. Users can simply
refer to the table to obtain the R/W mix and Block Size value of
interest. For example, Online Transaction Processing applications
typically run at a Block Size of 8K and a Read/Write Mix of 65/35, and users
can quickly understand how the device might perform under Steady State for
these access characteristics.
Now let's head to the next page, where to look at the
results of the SNIA Write Saturation Test.....
Here is the specification for this test -

The objective of this test is
to observe the time evolution of the drive’s performance, as a function of
time, from a ‘factory fresh’, ‘fresh out of the box’ (‘FOB’) state. When a
drive is in a FOB state (e.g. after it has been purged by, for example by a
SATA Secure Erase or SCSI Format), we can expect an initial period of time when
writes can easily be accommodated by clean/empty blocks, but once all of the clean
blocks have been written to once and the drive’s controller must first clean
blocks (with erase write operations) before it can write new data, then we can
expect a slow down. The slow-down is usually quite dramatic and is commonly
referred to as the ‘write cliff’.
The Write Saturation Test is
easy to run as it requires no steady state determination – it can be easily run
in freely available software, such as IOMeter.
Here is the report of the
results -


You can see here a huge drop in Write IOPS performance as
the E100 drops into a Steady State. The marked fall, at around Round 11 occurs
when all of the available NAND has been written to once and the drive must
clean blocks on the fly, in preparation for accommodating further writes – this
is commonly referred to as the ‘Write Cliff’.
This is a picture of typical behaviour, and you can see that
the drive is achieving a steady state at around 6,500-7,000 IOPS.
Note that the test was halted, as specified in the SNIA SSS
PTS, when 4 x the User Capacity had been written to the drive.

You can also see that the latency graph line is almost a mirror
image of the IOPS graph line.

This is a graph showing the Maximum Write Latency values
that occurred in each Round.
Now let's head to the next page, to look at the SNIA
Throughput Test.....
Please note that we have moved up to Version 1.1 of the SNIA
Throughput Test specification. The v1.0 Throughput Test is missing a pre-fill
stage between the purge and the tests loop, that sit within the overall loop on
Block Size.
Here is the specification for the Version 1.1 test -

The test is designed to measure the sequential Read and
Write IO performance for two Block Sizes, when under Steady State conditions.
One can easily compare the results produced by this test with box-top numbers,
which are usually stated as “Up to xxx MB/S”.
Here is the report of the results -


You can see here that Steady State was achieved for both Write
IO sizes by the end of Round 5.

You can see here that Steady State for both Read IO sizes
was achieved by the end of Round 6.

You can see here the average of the values recorded in the
Measurement Window. Great reads, not so great writes. It is worth remembering
that the SNIA tests are using incompressible data and this is worst case for
LSI Sandforce based drives.
Now let's head to the next page, to look at the results
of the SNIA Latency Test.....
Here is the specification for this test -

The Latency Test measures average and maximum response times
using random IOs at specified Block Sizes and Read/Write mixes, taken under
steady state conditions. The test runs at a Queue Depth of 1 (1 outstanding
IO), thus the results give the baseline response time for a single IO request.
The test also reports maximum latency values, which can be
helpful to see if there might be processes within the drive that may cause max
Latency values to become larger.
Here is the report of the results -


These are the Average and Maximum Latency Values observed in
the Measurement Window (measured in Milliseconds).

You can see here that Steady State Convergence was achieved
at the end of Round 5.

Here is a graph of the Maximum Latency results.

Here you can see a graph of the Average Latency results.

Here is a 3D graph showing, at a glance, the Maximum Latency
values for each combination of Read/Write Mix and IO Size. You can see that
the Max Latency Values are far greater than the following Average values – it
begs the question as to how frequently they occur (we’ll look at this later on
in the Myce/Oakgate Tests)?

Here is a 3D graph showing, at a glance, the Average Latency
values for each combination of Read/Write Mix and IO Size.
Now let's head to the next page, to look at the results
for the Myce/OakGate Read and Write Latency Tests......
Here are the specifications for the tests -


These tests steadily increase the random 4K IO demand in
terms of IOPS, and report the drives response in terms of Average IOPS, Average
Latency and Maximum Latency. It is designed to show a drive’s maximum IOPS
capability and report the all important Latency numbers for each level of IOPS
demanded. The Maximum latency numbers give us an insight into the occurrence
of Latency peaks that could cause an unexpected response from time to time.
Here are the results –
Firstly, here is a graph showing the result for the
Pre-Conditioning in Step 2 -

You can see a tight pattern until the write cliff is hit,
after which it is fair to say that bandwidth performance is somewhat erratic.
4K Latency Read Test

You can see that the drive can no longer meet the increase
in IOPS demand at around 47,750 IOPS.

You can see a gradual and accelerating increase in read
latency up to the maximum IOPS mark.

You can see here that Maximum latency values are
consistently high beyond the 17,000 IOPS mark.
Let’s now have a look at the distribution of the latency
values in a test designed to show the E100’s Quality of Service (QoS) for 4K
Writes and Reads when in a Steady State. The specification for the test is 1)
Purge the Drive 2) Precondition the drive by performing 4K random writes for 2
hours (100% random data) 3) Perform 60 rounds of 4K Random Writes, with each
round consisting of 9 seconds warm up and 51 seconds of performance measurement
4) Perform 60 rounds of 4K Random Reads, with each round consisting of 9
seconds warm up and 51 seconds of performance measurement. The test was
performed at a Queue Depth of 1.
Here are the results:


Firstly, here are Average and Maximum Write Latency plots
per Round

And here is the High Resolution Latency Histogram for Round 15.
As this is the first time in this review, that we are
looking at a High Resolution Latency Histogram, here’s an explanation – The X axis
to the left is the count of the IOs in the observation period (in a Round) that
had a Latency of the value along the Y axis (please note that the X axis is
logarithmic to allow the low order counts of the huge number of IOs that have
been measured to be visible); the Y axis is the Latency value measured in
Microseconds; The X axis to the right is the % of the Total IOs observed that
have a Latency <= to a given Latency value; the rate of getting to 100% is
highlighted by the red graph line.
You can see that 99.9% of the Latency Values were <= 1.89
Milliseconds but that 95% of the values were <= 190 Microseconds. If you
look carefully you will also see that there are relatively few outliers.


Here are the Average and Maximum Read Latency plots per
Round.

And here is the High Resolution latency Histogram for Round
22. You can see that 99.9% of Latency values were <= 280 Microseconds and 95%
were <= 190 Microseconds. You can also see that there are relatively few
outliers.
4K Latency Write Test

You can see here that the E100 fails to meet the increase in
IOPS demand at around 11,000 IOPS. Notice also that it appears to find a
second wind when the IOPS demand reaches 45,000. I don’t know what explains the
second wind – I can only guess it is something to do with the way in which an
LSI Sandforce FSP can apply and relax a throttle to ensure that endurance goals
are met.

Here we can see that Average Write Latency stays low until
11,000 IOPS but then shoots up, with a fall as the controller finds a second
wind.

Here are the Maximum Write Latency plots.
Now let's head to the next page, to look at the results
for the Myce/Oakgate Reads and Writes Tests.....
Here is the specification of the tests -

The tests are designed to show the Random and Sequential,
Read and Write, performance metrics for different combinations of Queue Depth
and IO size. Please note that these tests use a default data pattern, which is
highly compressible.
Here are the results -
Random Reads

Here you can see IOPS drop as IO size increases. You can
also see that there is good scalability up to the maximum Queue Depth of 32.

Here you can see a gradual increase in Bandwidth as IO Size
increases, plus again there is good scalability up to the maximum Queue Depth
of 32.

You can see here that Read Latency increases as IO Size and
Queue Depth increase.
Random Writes

You can also see that the level of Random Writes IOPS peaks
at an IO Size of 4K and a Queue depth of 4.


You can see here that Random Write Latency is at its lowest
for the 4K IO Size.
Sequential Reads

You can see here that Sequential Read IOPS decreases as IO
Size and Queue Depth increases.

You can see here that
Bandwidth scales all the way up to the maximum Queue Depth of 32.

You can see here that Read Latency increases as IO Size and
Queue Depth increase.
Sequential Writes

You can see here that there is no effective scaling for
Sequential Writes IOPS above a queue depth of 16.

You can see here that there is no effective scaling for
Sequential Writes Bandwidth above a queue depth of 16.

You can see here that Sequential Write latency is at its
lowest for an IO Size of 4K.
Now let's head to the next page, to look at the results
for the Myce/Oakgate 4K Mixed Reads/Writes Tests.....
NEW PAGE NEW PAGE NEW PAGE NEW PAGE
Myce/OakGate 4K Mixed Reads/Writes Tests

This test is designed to show the performance metrics for
different combinations of Queue Depth and Read/Write mix (the % of Reads and
the % of Writes making up the IO traffic)
4K Mixed R/W Test

You can see that there is no dramatic decrease in Read IOPS
as a small % of writes enters the mix.


As expected, Read Bandwidth decreases as the % of Writes
increases.


Now let's head to the next page, to look at the results
of the Myce/OakGate Entropy Tests.....

So, now we come to the results of the Entropy tests where we
are expecting to see some interesting results as the E100 uses an LSI Sandforce
FSP.
These tests are designed to show performance metrics for
different combinations of Queue Depth and Entropy % (Entropy % is the degree to
which the data that is random and therefore incompressible). Testing with
different Entropy % levels has become important with the advent of controllers,
such as those from LSI Sandforce, that compress data before writing it to NAND.
Controllers that compress data can be expected to perform better with highly
compressible data (i.e. data with low Entropy).
The first test performs 5 minutes of Random 4K writes for
each combination of Queue Depth and Entropy %.
The second test does the same thing for a mixture of Read
and Write traffic (70% Reads, 30% Writes).
4K Entropy Write Test

So, here we have evidence of the LSI Sandforce FSP’s ability
to compress data.
As expected, you can see here that there is gradual decrease
in Write IOPS as the Entropy % increases. Curiously the rate of decrease drops
off around 70-80% - I wonder if there is a point at which the Sandforce
controller’s compression algorithm is no longer effective.


4K Entropy 70%_Reads_30%_Writes Test

Here we can see that Read IOPS starts to gradually decrease
as the data becomes more incompressible.

And the same is true for
Writes.


And also for Bandwidth.


Here we can see the
expected increase in Latency as the data becomes more incompressible (and that
it is a mirror image of what we see for IOPS and Bandwidth)


Now let's head to the next page, to look at Power
Consumption and Data Reliability.....
Power Consumption
I believe most people know that data centres are already one
of the major consumers of electricity in the industrialised world; indeed it is
estimated that currently 2% of all electricity consumption goes into IT
applications. According to the European Union the energy consumption of data
centres was 46 Terawatt hours in 2006 and is set to rise to 93 TWhrs by 2020. This
is equivalent to one hundred million 100W light bulbs burning 24 hours a day,
365 days a year.
Typically 40% of the power consumed by data centres is for
the IT load and 35% is for cooling the system. Generally speaking, if a drive
consumes more power it will produce more heat – so power consumption is indeed
a double edged sword. It is no surprise then that a significant proportion of
a data centre’s power consumption goes on servers. I understand cloud based
applications, such as Facebook, are the primary cause of the growth in servers
and the demand for storage space.
I recently listened to a BBC Radio 4 Programme that quoted
IBM as saying that 90% of the world’s data has been created in the last 2 years
– staggering!
If you are a Facebook user, like me and the Reynolds sibs, and
you reside in Europe – this is most probably where your data is click here. Some
interesting Facebook statistics – Facebook has more than 1 Billion monthly
active users, it generates 1 Trillion page views per month and more than 219
Billion photos have been uploaded since launch – amazing!
I’ve heard that Google has more than 1 million servers and
that Microsoft has more than 300,000 in its Chicago based data centre alone –
fortunately for humanity the very large players are also amongst the most
efficient (understandably, as the economics associated with power consumption
are huge for them). So suffice to say, the power consumption of SSS Enterprise
solutions is a very important global consideration.
The following graph uses the typical Power Consumption, when
active, as published in the respective manufacturer’s specification (please
note that the value for the Samsung 843 is the average of the typical read
active and write active values, as specified by Samsung).
The value for the Kingston E100 is calculated as the average
of 1.2W (TYP) Read and 2.7W (TYP) Write.

The Kingston E100 has very low Power Consumption
requirements, especially when reading data.
Data Reliability
The 'Unrecoverable Bit Error
Rate' (UBER),as defined by JEDEC, the global leader in developing open
standards for the microelectronic industry, is a metric for data corruption
rate equal to the number of data errors per bit read after applying any
specified error correction method. UBER = number of data errors / number of
bits read. JDEC specifies that the maximum error rate allowable for an
Enterprise level SSS solution is one error in every 10^16 bits read.

The E100 exceeds the JEDEC requirement and has a competitive
UBER of 1 in 10^17.
The E100 has a 3 year warranty and Kingston quotes a TBW of
428TB. Typically enterprise drives are warranted for 5 years, so 3 years is
falling short of expectations.
The E100 includes power failure support.
Now let's head to the next page, to look at the
Conclusions of this review.....
In reaching conclusions about the Kingston E100 it is
important for me to remember that I have tested the entry point 100GB drive. No
doubt, the performance profile of the larger drives in the series, which have
greater levels of NAND set aside for use by the controller would be a lot
better, particularly under steady state conditions as enforced by nigh on all
of our tests.
Another key factor to be taken into account is price. The
E100 100GB is available from the Kingston website for £319.99 ($483.44 at
current exchange rates) and the 200GB for £569.73 ($860.75). This makes it an
expensive drive, especially when you bear in mind that the Intel DC S3700 200GB
(Our current Editor’s choice amongst Enterprise SATA drives) is available for
some £180 less than the E100 200GB.
I can’t help but have the feeling that the market has moved
on and left the E100 somewhat stranded.
Nevertheless, the E100 is a massive step forward from
spinning disks and it implements proven, high quality components. Perhaps,
particularly for read intensive applications it would not disappoint.


")


