|
|
Review: Micron
|
|
|
|

The name Micron isn’t an unknown name to
most readers. We see the Micron name very often, mainly in SSDs from Crucial
and other manufacturers, also you can find micron on other storage related
products, such as USB3flash drives, an example of that is the Lexar P10, a
flash drive with speeds very close to SSDs This time I am taking a look on an
enterprise SSD that doesn’t have the Crucial name on it. Micron was kind to
send me the 480GB M500DC SSD for an in-depth review. You can find all the
information you want about Micron history and their products simply by clicking
here.
So let’s start this review by taking a
quick look at the Micron M500DC SSD.
Micron M500DC 480GB SSD
As expected, you won't find any fancy
packaging or any 7mm to 9.5mm adapters, all you get is the drive in an
antistatic bag. So let’s take a close look at the drive.
A closer look at the Micron M500DC 480GB SSD
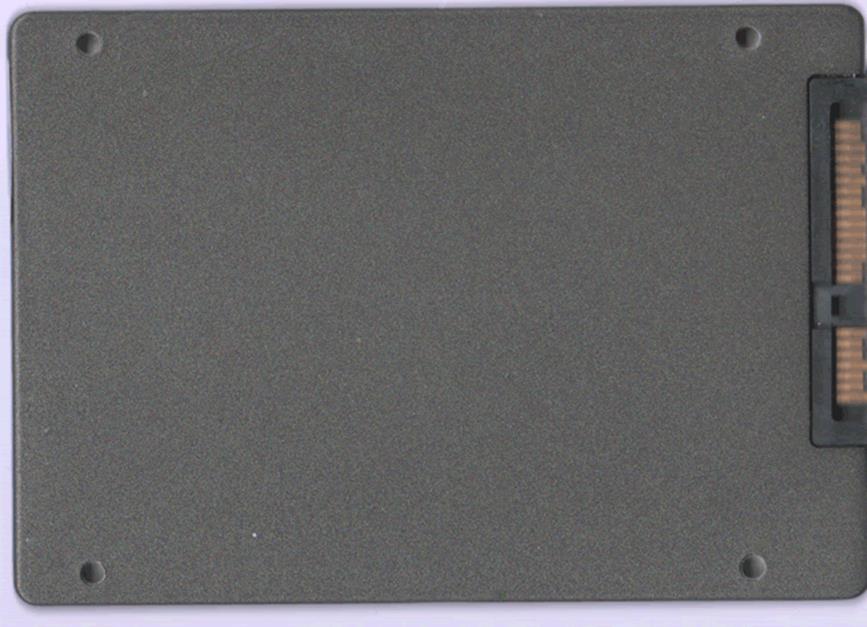
Top side of the Micron M500DC SSD

Drive underside
It’s clear that the Micron M500DC has only
the very basic information that is required, and no kind of fancy stickers. As
simple as it gets.
Inside the Micron M500DC SSD
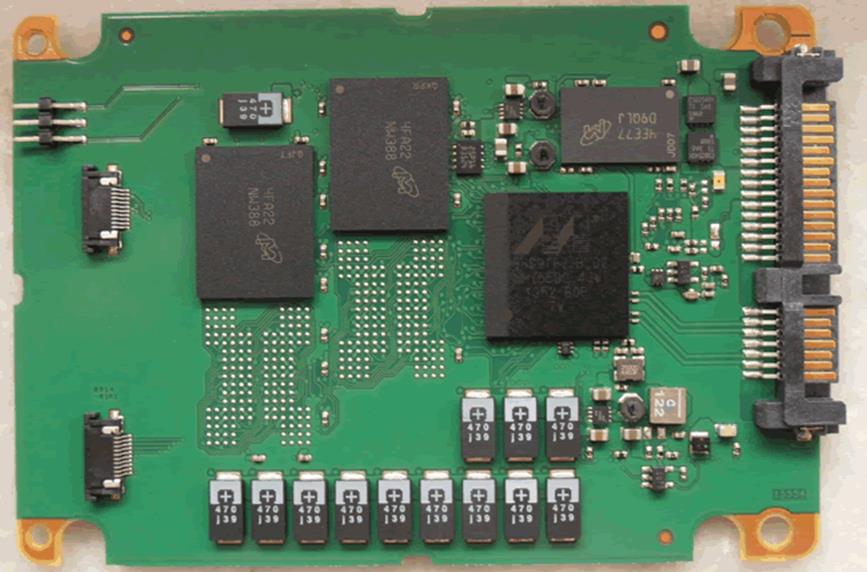
On the top of the Micron M500DC circuit
board we can see 256MB of DDR3 RAM, the Marvel controller, and two 20 nm NAND
chips, also there are a lots of capacitors that will provide sufficient power
to ensure that data isn't lost on the M500DC.
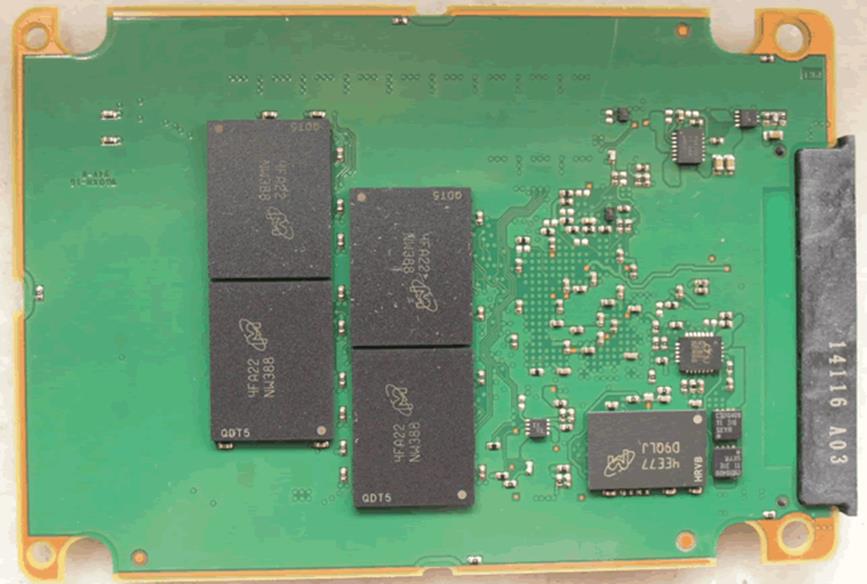
On the other side of the M500DC circuit
board we find another 256MB of DDR3 RAM, and four 20nm NAND chips manufactured
by Micron. So we have a total size of 768GB, and the Micron M500DC has a total
of 288GB to be used for over provisioning.
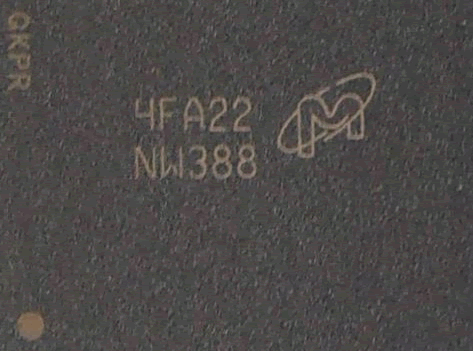
Here
is a closer look at the Micron 20nm MLC NAND.
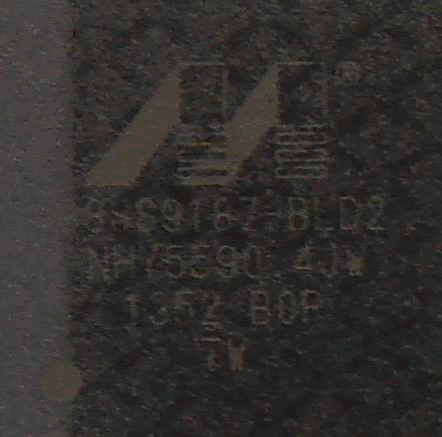
A close look at the eight
channel Marvell 88SS9187
controller.

The
DDR3 memory is also manufactured by Micron.
Specifications
The following specifications are taken from
the official Micron website, to find out more information click here.
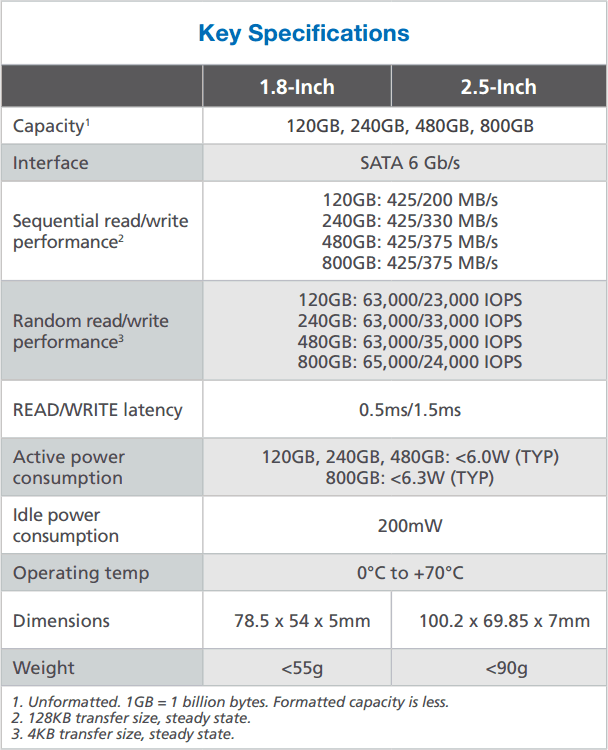
As we can see the Micron M500DC is
available in two form factors, 1.8” and 2.5”, and also in four capacities,
120GB, 240GB, 480GB, and 800GB.
XPERT (eXtended Performance and Enhanced Reliability)
Here is how Micron describes XPERT.
eXtended Performance and Enhanced
Reliability Technology (XPERT) is a suite of Micron-designed storage
architecture enhancements that greatly improve SSD performance and reliability.
XPERT extends drive life and ensures data integrity. RAIN Redundant Array of
Independent NAND).
With XPERT, Micron aligns storage media
design, SSD firmware development, and hardware integration to create a
comprehensive architecture that enables enterprise class SSDs to meet the
unrelenting demands of 24/7/365 data centers. The XPERT feature set gives us
the flexibility to design SSDs to meet exact application requirements. Only the
XPERT features that are appropriate to a particular application are designed
in, so our SSDs can precisely match data center usage models. From booting
general purpose servers and storing mission-critical databases, to ensuring
long-term, trouble-free operation of appliances and managing petabytes of cloud
data—XPERT-enabled SSDs meet the stringent usage requirements demanded by the
massive growth of digital data.
XPERT Feature Set – Overview
- Adaptive Read Management/Optimized Read
(ARM/OR) - Redundant Array of Independent NAND
(RAIN) - DataSAFE
- Reduce Command Access Latency
(ReCAL)
- Media Customizations
At this point I won’t go into further
details, as you can find an excellent PDF file that you can download directly
from Micron, that will provide a more detailed view on XPERT's features.
The PDF can be downloaded here.
CrystalDiskInfo

In
the above screen shot we see all the available info for the Micron M500DC SSD.
Let’s head to the next page where we
take a look at our testing methods and the review PC.
Test machine
For this review I will be using a computer
with the following configuration:
Hardware:
- Motherboard: AsRock Z77 Extreme 4 (Intel Z68
chipset) - Processor: Intel 2nd generation
Core i5 2500K @ 4Ghz - RAM: Kingston 2x4GB
- GFX: Onboard Intel HD 3000
- Sound: Onboard Realtek HD audio
controller - Hard disk OS: Corsair Nova 64GB
- PSU: Corsair CX430 430W
- Display: Futsiju Siemens 22”
- Operating System: Windows 7 Ultimate 64bit with
Service Pack 1
The Micron M500DC 512GB SSD was connected
to the Intel native SATA 6Gbps (port 1) on the Z77 motherboard of our review PC
and all tests on the drive were carried out with the drive connected to this port.
All power saving features were disabled during all of my synthetic benchmarks.
AHCI mode was also selected for all drives
in the UEFI of our test PC, and all the tests were carried out in this mode. As
we can also see the formatted size of the Micron M500DC SSD is 447GB.

The SATA 6Gbps drivers used on our review
PC were Intel Rapid Storage Technology (RST) Version 11.7.0.1013.
Test applications
To test the performance of the Micron M500DC
480GB SSD, I will be using the following test applications in this review.
- HD Tune
Pro - ATTO
- Iometer
- AS SSD
Benchmark - CrystalDiskMark
- Anvil’s
Storage Utilities - PCMark
Test procedures
I will start off our testing procedures
explanation by stating that I did not run many synthetic benchmarks on the Micron
M500DC SSD. You may ask why I have run so few synthetic benchmarks.
SSD technology has moved so fast in the
last couple of years, that basic synthetic benchmarks alone are now of very
limited use, as they don't really tell us much about performance and how the
drive will behave in the real world. I have therefore decided to show some basic
benchmarks for the Micron M500DC SSD, and will complement this with advanced
benchmarks using IOMeter and AS SSD benchmark. I will also show how the Micron
M500DC SSD performs in the real world.
The reality of SSD performance
While I can easily show you which SSD is
technically the faster, when you use one of these modern SSDs as an operating
system drive it becomes very difficult to tell them apart as far as performance
is concerned.
A typical use of a small capacity SSD at
the moment is to have your operating system and applications installed onto the
SSD. The performance difference compared to a traditional HDD is enormous,
however when you start to compare SSD to SSD the difference becomes almost
impossible to detect.
Let’s look at why this is the case.
Drive A can boot to the desktop in 8.11
seconds, and drive B can boot to the desktop in 8.12 seconds, the difference in
time is milliseconds, and can one really tell the difference?
The fact is, all modern SSDs are only
ticking over when they are only running the OS and launching applications, it’s
only when you get to some of the larger capacity SSDs, with enough free space
to be able to hold the actual data that you’re going to be working with, be
that video, audio or pictures, for example, that you actually get a tangible
difference in performance. This is where the SSDs with the better sequential
performance start to pull well ahead of the SSDs which have lower sequential
read/write performance.
Small file random IOPS vs sequential performance
IOPS
This is a fairly complex subject, but I
will do my best to explain things in a manner that is easy to understand.
The term IOPS is the amount of input or
output transactions that can take place in a one second interval, so for
example, if an SSD is quoted as being able to cope with 20,000 4K random write
IOPS, then the SSD should be able to cope with 20,000 input transactions in a
period of one second. If the same SSD is said to be able to produce 20,000 4K
random read IOPS, then the same SSD should be able to produce 20,000 4K random
read output transactions in a one second interval.
Ok, now we have some figures to work with,
the next question is how many IOPS are actually required?
This will depend on your usage pattern. If
you are a typical desktop user who browses the internet, does some word
processing or perhaps some audio or video editing, and perhaps plays a few
games, then in actual fact, you don’t need to have massive 4K random read/write
performance. The actual amount of 4K random performance that is required for a
fast and smooth running system for a desktop user with a usage pattern similar
to the above will be well under 1,000 4K IOPS.
On the other hand, if the SSD is being used
for running a large and complex database server, then 4K random performance is
the absolute measurement of how fast that server will run, as this type of
application does most of its input and output transactions in the 4K domain.
So why would I need an SSD with 80,000 4K
IOPS for a desktop?
In fact you don’t need this type of
performance for a desktop, but an SSD which is capable of coping with 80,000 4K
IOPS will be faster than an SSD which can only cope with 20,000 4K IOPS.
OK, I just said if under 1,000 4K IOPS are
actually required for typical desktop usage, why is an SSD with 80,000 4K IOPS
faster than an SSD with only 20,000 4K IOPS, confused?
You may ask, if I only require 1,000 4K
IOPS surely the rest is wasted?
While you may never need 80,000 4K IOPS,
IOPS is all about latency. The reason that an SSD can cope with as much as 80,000
4K IOPS is because latency in this domain is very low. With 4K files, even if
you require to process 500 of them at the same time, you are not talking about
a huge amount of data, it has far more to do with how long it takes the SSD to
process a single file, and the amount of time required to process a single 4K
is all about how long it takes for the SSD to access or store that data before
it can move on to the next transaction.
In other words an SSD with 80,000 4K IOPS
performance will handle those 500 files faster than the SSD with 20,000 IOPS.
So how will a desktop user even notice this
faster speed if so little 4K random IOPS and data are actually used?
Multitasking is a good example. The more
tasks you run at the same time, you more you will notice the speed difference.
Sequential performance
I have always maintained that sequential
performance was every bit as important as small random file performance for a
desktop SSD. Some highly regarded people on other sites found this statement quite
funny a couple of years ago when I made it, but my, how times have changed in
the world of SSD reviewing.
To me this was always so obvious for a
desktop user. For example, let’s say you want to launch an application or game.
Both have some fairly large files to load, and also a great many small files,
but the point is, even the smaller files are sequential in nature. Now let’s
say you’re into audio or video editing. Video files tend to be huge, and the
files are written or read sequentially. Isn’t this how many users are using
their PCs these days?
Summary
So how does this shape up in the real
world? Which is better, massive 4K IOPS or massive sequential performance?
In an ideal world you want both, as an SSD
with massive random 4K IOPS and sequential performance will always be faster
than an SSD that has high sequential performance and moderate 4K random IOPS
performance, and the same applies to an SSD that has massive 4K random
performance and moderate sequential performance. The SSD which has high performance
in both patterns will always be the faster SSD.
However, you can still have an SSD that is
very fast for desktop use that has moderate random 4K performance and massive
sequential performance, the same can be said about a drive having massive random
4K performance and moderate sequential performance, as it is about getting the
balance right if you have to compromise on one or the other.
Drive preparation for running the tests
All the SSDs used in this article were in a
clean and fresh state when the testing period started. From then on, each drive
had to rely on its own NAND cleaning effectiveness for the remainder of the
tests.
- Both our spinning HDD drives were
defragged before the start of each test.
- All SSD and HDD used in this article had
their partitions aligned to the Windows 7 x64 defaults.
Where I use graphs in this article to
display results, I will use the following colours to make it easier, for our
readers to see which drive we are reviewing.
![]() Micron M500DC 480GB
Micron M500DC 480GB
SSD
![]() Comparison
Comparison
SDD
Now let's head to the next page, where I
look at some basic benchmarks...
Reading Benchmarks
HD Tune

HD Tune – Sequential reading test
I present the graph below, for comparison
with other recently tested drives.

For an SSD that isn’t made to be used in a
desktop the Micron M500DC delivers a very good result in this test.
ATTO disk benchmark
ATTO has become a standard tool for
measuring the data throughput of HDD and SSD. It measures the reading and
writing performance, using different file sizes and block sizes.

Again, the Micron M500DC is able to go
slightly faster than its advertised speeds, and once more the result is very
good for a non consumer/enthusiast SSD.
CrystalDiskMark 3.0
CrystalDiskMark is quite a handy
benchmarking application, as it focuses on the file sizes that can cause a
problem on a system drive.

Microns M500DC continues to show very good
performance when tested as a consumer/enthusiast SSD.

In
the above graph you can compare the read speed of the Micron M500DC SSD with
some consumer drives,

and
here I present the write results for the Micron M500DC.
It’s clear that the performance of the
Micron M500DC is similar to the M500, the drive on which it was based. Overall
the result is very good.
AS SSD Benchmark
AS SSD benchmark is a benchmarking tool
specifically designed to test SSDs. The application tests sequential reading
and writing performance, 4K random reading and writing performance.
AS SSD benchmark also tests 4K threaded performance.
This is very exciting, as this test is the first available test that I am aware
of, that simulates how a PC operating system actually works. A modern PC and
OS, such as Windows Vista/7 does not just run a single thread at a time, it
runs many threads. The AS SSD benchmark "4K 64Thrd" tests run 64
threads simultaneously throughout the test. If this result is good, then you
can be pretty sure the drive will perform extremely well as a system drive.
After the tests complete, AS SSD benchmark
derives a total score for the drive being tested. This is based on all aspects
of the test results, and gives an indication of how the drive is performing
overall.
Now let’s look at the results for the Micron
M500DC SSD in the form of a screenshot. All our other comparison drives’
results are presented in the form of a graph.


The same solid performance continues in the
AS SSD test, and we can see that the Micron M500DC takes a higher place by only
one point compared to the M500.
Summary:
To be fair, these tests are made to show
which SSD is the fastest one, and the Micron M500DC wasn’t design to go head to
head with these SSDs. The drive however is able to deliver excellent
performance.
Let's head to the next page and run some
tests using PCMark Vantage and PCMark 8.....
PCMark Vantage - HDD Suite
For these tests we will be using
FutureMark’s PCMark Vantage. This suite of real world test applications is
highly regarded, as one of the most comprehensive ways of testing a computer’s
performance in the real world. The PCMark Vantage test application also
includes an HDD/SSD/USB Flash suite of testing procedures, designed to fully
test out the performance of an HDD/SSD to its limits.
PCMark Vantage HDD suite results

Here
I present the results for the Micron M500DC 480GB SSD.

Here is a detailed view of the performance
of the Micron M500DC SSD, and you can compare the result with other drives that
I have tested.

Finally here is the score that the Micron
M500DC achieved in this test.
PC Mark 8 - HDD Suite
Here at Myce.wiki, we only recently
introduced PCMark Vantage to our SSD testing. PCMark Vantage is a good test,
but is now somewhat outdated in the applications that it tests, even to the
extent of including a test trace on how Windows Vista booted. We could have
course have opted for the newer PCMark 7, but I personally had issues with the
way it ran the HDD tests.
We have built quite a close relationship
with FutureMark software, the authors of the PCMark PC benchmarking software
that we use in our tests. I decided I would use PCMark Vantage as stopgap
measure until the more up-to-date PCMark 8 benchmarking suite became available.
I'm pleased to say that PCMark 8 is now available, and it gives me great
pleasure to introduce you all to the results obtained by this new 'real world'
benchmarking suite.
I will describe the basic way that each
test is carried out, above the graph for each test.
PC Mark 8 HDD suite results

Here
is a screenshot of the Micron M500 SSD result.

The result is again excellent, the Micron
M500DC was able to give a higher score than some of the consumer drives that I
tested, and it’s only beaten by the Crucial M550.

A more detailed look at the performance of
the Micron M500DC SSD, again compared with some consumer drives.
Summary:
The Micron M500DC SSD is again giving an
excellent performance.
Let's head to the next page for our
IOMeter test results.....
I/O Performance
There is little point of having an SSD drive
that has blazing sustained reading and writing speeds, if the drive can't
handle reading and writing of small random files. If you intend to use your new
SSD drive to store and run your operating system, then the drive must be able
to cope with the many small random files that Windows will write to the drive
continually. So I feel it is very important to test how many of these random
files that a drive can handle in one second. I believe that anything over 1,000
I/O’s per second would be enough for most users running a consumer grade
mainstream PC, and should provide a smooth running system. But obviously, the
more I/O's that a drive can handle, the faster the drive will feel and leave
more headroom for those huge multitasking sessions that users sometimes engage
in.
The things that I will look at are the
total I/O per second and total MB/s.
Partition alignment and sector boundaries
Windows 7 and Vista will automatically
align a partition to 4k boundaries during partition creation, Windows XP won’t.
It is imperative that an SSDs partition is aligned. Windows XP is also
restricted to sector boundaries, while Windows 7 will use 4k boundaries if it
can. The Intel 510 is 4k boundary aware, and will use these boundaries if
possible. Of course it will also remap LBAs for compatibility with the sector
boundaries so that the drive can be used with Windows XP.
IOMeter allows us to set the sector
boundaries for conducting the tests, and I have therefore set the sector
boundaries at 4K, which means the IOMeter tests are valid for Windows 7 and
Windows Vista users. XP users will not be able to obtain such results.
I will provide a screenshot of the tests on
the review drive for those of you who like to see the actual test result. All
the comparison drive results are represented in the form of graphs.
If any of you would like to see a
screenshot from any IOMeter test on a particular drive, please feel free to
request one, and I’ll post the screenshot in the forum thread.
All the IOMeter tests create a 10GB data
set on the target drive, and each test is run for a duration of 3 minutes.
IOMeter 4K random write test with repeating data.
The first test involves creating continual
4KB random files on the target drive with IOMeter. I use a 4KB file size, as it
is believed that Windows will create and modify many of this size of file
constantly in the background during a typical Windows session. It is said that
most 4K random writes take place at a queue depth of only one.
Queue depth 1

Micron M500DC 480GB SSD – 4K random write (Queue depth 1)

Queue depth 4

Micron M500DC 480GB SSD (Queue depth 4)

Queue depth 32

Micron M500DC 480GB SSD (Queue depth 32)

4K random write queue depth profile
For this
test I used various queue depths from 1 – 32 to give you an idea how this SSD
performs at different queue depths. For a normal desktop user, with lightweight
multitasking, the queue depth will rarely rise above 2. For heavy multitasking,
the queue depth is unlikely to rise above a value of 8.

A detailed view of the performance of the Micron
M500DC SSD with various Queue Depths.
IOMeter 4K random read test.
If there are many 4k files created, then
that must also mean that many 4k files need to be read. This test measures 4k
reading performance.
Queue depth 1

Micron M500DC 480GB SSD (Queue depth 1)

Queue depth 4

Micron M500DC 480GB SSD (Queue depth 4)

Queue depth 32

Micron M500DC 480GB SSD (Queue depth 32)

4K random read queue depth profile.
This test
shows how the review drive scales with increasing queue depths.

Here is a more detailed view of the performance
of the Micron M500DC SSD at different Queue Depths.
IOMeter 512KB write test with repeating data.
Sequential writing performance is also very
important; in this test sequential writing performance is measured.

Micron M500DC 480GB SSD 512K Sequential write with repeating data

The performance is similar to the Crucial
M500, a very good result.
IOMeter 512KB read test.
This test measures 512k sequential reading
performance.

Micron M500DC 480GB SSD – 512K sequential reading test

The Micron M500DC didn’t like this test,
and as a result it finishes last.
IOMeter Workstation simulation (outstanding I/Os = 64).
When running applications you will find
that there is a mixture of small random files and larger sequential files,
being created and read. Not only that, it isn’t just one file at a time. In
this test I measure a simulated workstation pattern, with a queue depth of 64
(threaded).

Micron M500DC 480GB SSD – Workstation simulation

Not only is the Micron M500DC SSD faster by
36.74 MB/Sec compared to the Crucial M500, it also is one of the fastest drives
that I have tested.
Summary
The Micron M500DC SSD is a pleasant
surprise, it was able to give some excellent results in a set of tests that were
designed for consumer drives.
Let's head to the next page for our
IOMeter test results.....
I/O Performance
Mixed 8K test, on different queue depth profiles.

Another
great result for the Micron M500DC.
128K sequential read/write queue depth profiles.
This a simple test that allows us to have a
clearer view of the sequential performance of the Micron M500DC.
This test
shows how the review drive scales with increasing queue depths.

It’s clear that the Micron M500DC has a
very consistent performance for both read and write.
Consistency tests
Many of our regular readers will remember
that back in 2013 we ran a test showing how much difference there was between
an enterprise drive and a consumer drive, we also ran some test with OP, and at
that time we were able to show you how the difference in performance was. The
Micron M500DC is an SATA 6Gb/S drive, but it’s not aimed at consumers so in
this set of tests I will be using the full capacity of the drive so we can see
the overall consistency of the tested drive. The drive is tested for two hours,
which is enough time to give us a clear view of how the tested drive can handle
extreme workloads. You can read the “What difference Over Provisioning does”
article here.
4K random read test.
Let's start this test with 4K full random
read at 32QD

IOPS

Average
latency, measured in ms.
It’s clear that the Micron M500DC has outstanding
read performance.
4K write read test.

IOPS

Average
latency, measured in ms.
For almost 800 seconds the Micron M500DC is
able to give its best, and after that the drive requires almost 1000 seconds to
start giving a more consistent result. Again the Micron M500DC shows excellent
performance.
8K mixed read/write profiles, two hours consistency test.
This is a test that I choose to run on
mixed load, 80% write, 20% read, with 80% random data, and 20% sequential data.
Let's see the results

IOPS

Average
latency, measured in ms.
Again we see that the drive gives a very
solid performance up to 2500seconds, and after that it continues to be
consistent, but there is a small drop in performance which results in an
increase in latency.
128K sequential read test.

IOPS

Average
latency, measured in ms.
It’s crystal clear that the Micron M500DC
doesn’t have any issues handling sequential data.
128K sequential write test.

IOPS

Average
latency, measured in ms.
Again the M500DC is showing very consistent
performance, when it comes to writing sequential data.
128K random write test.

IOPS

Average
latency, measured in ms.
When it comes to random data the Micron
M500DC gives a similar graph to the one that we saw in the 4K random test.
Again we see that the latency increases as the IOPS drop. Overall though the
performance continues to be solid.
Micron M500 SSD with total 120GB OP
As a reference, here is the performance of
the Micron M500SSD with Ό of its size used as for OP.

The graph shows it all, the difference
between the M500DC and the M500 is almost indescribable, even if you are
willing to sacrifice 120GB.
Now let’s head to the next page where we
will look at how the Micron M500DC SSD performs
using Anvil's Storage utilities....
Anvil’s Storage Utilities
As well as performing SSD endurance tests.
Anvil’s Storage Utilities has a very nice SSD benchmarking application. The SSD
benchmark tests many different aspects of SSD performance, including 4K random
at different queue depths, and also sequential performance, but more importantly
than this, all using real test data.
Another very nice feature of Anvil’s SSD
benchmark is the fact that you can change the compression levels of the test
data. The compression levels of the data sets used for the tests can be varied
from 0% compression right up to 100% compressed data, and there are even a few
data profiles already included, such as database (8%) compression, and also an
application profile (46%) compression, which is designed to simulate real
application data being read and written to the SSD.
Anvil’s Storage Utilities is still in beta
at the moment, but the application is currently solid enough to use in this
article, and I have already verified the results obtained using an SATA
analyser.
I will include a screenshot of the review
drive, and all comparison results will be presented in the form of graphs. If
you would like to see screenshots of the test results obtained on the other
SSDs in this article, you can do so by following the link here.
I will also be testing three different
compression profiles, which are as follows.
- 0 fill (100% compressible data)
- Application simulation profile (46%
compressed) - 100% (non compressible data)
So let’s begin the tests.
0 fill

Micron M500DC 480GB SSD (0 fill)

Results
are ranked by highest total score.
It’s clear that there are faster
consumer/enthusiast drives but the Micron M500DC is able to finish in the
middle of the graph.
Application profile

Micron M500DC 480GB SSD (application profile)

Results are ranked by highest total score.
Again the Micron M500DC delivers some
excellent performance, and continues to occupy the middle of chart.
100% incompressible

Micron M500DC 480GB SSD (100% incompressible)

Results are based on the total highest score.
Closing this set of tests, it comes as no
surprise that again the Micron M500DC is able to stay in the middle of the
graph.
Summary
The results are excellent for a drive that
probably will never have this light workload and was never intended to be used
as an OS drive for your PC.
Now let's head to the next page for the
conclusion....
Summary
Let us summarise the most important
positive and negative points below:
Positives:
- Very consistent.
- SATA 6Gb/s compatible.
- 7mm thick.
- 5 year warranty.
- Excellent data loss protection.
- A lot of over provision NAND.
Negatives:
- None.
To sum up, this is what I would say:
When you test a lot of consumer and
enthusiast SSDs you are looking for the fastest drive, the one that will be
able to give you the quickest performance at the time that you are testing the
drive. But getting your hands dirty with an enterprise drive you get to
re-think what is more important, and at this time the word performance becomes
irrelevant. Now it’s has been replaced by the word consistency, and with a
drive like the Micron M500DC you get to see how consistency can be transformed
into real usage.
The Micron M500DC is an excellent drive,
it’s very fast, it has very good data protection in case of a power loss, and
Micron promises very high endurance, 1.9PB for the 480GB and the 800GB SSDs.
Two drive fills per day for five years is a very high number for an SATA 6Gb/S
SSD. The Micron M500DC is very reliable, but more importantly is able to be
very consistent over a long period of time, as we can see from the tests that I
ran.
Being an SATA 6Gb/s SSD the Micron M500DC
gives everyone the option to have a very fast server and also to have all the
benefits that an enterprise drive can give.
Words cannot describe the shock that you experience
when you get the chance to test an excellent drive, and the Micron M500DC is an
excellent drive.
The parting sentence is:
“The Micron M500DC is simply an excellent
SSD, it’s consistent, reliable, and ready for any demanding environment.”
I therefore give the 'Excellent' rating to
the Micron M500DC 480GB SSD.

Thanks to:
|
|
EFD |
|
|
Alex Schepeljanski for |
|
|
|
|
|
FutureMark for providing a
|


You may comment on this review below, you
can also post your benchmarks in our forum.


")


