 |
Review: Reviewed Provided Firmware
|
Welcome to
Myce’s review of the Micron M510DC 480GB SATA Enterprise SSD (hereafter
referred to as the Micron M510DC).
With the M510DC; Micron targets the intensely competitive
‘Read Centric, Low Cost’ market segment. I understand this market segment is
growing rapidly and already accounts for more than 50% of the overall market
for enterprise SSDs. This market comes from the incredible demand for cost
effective storage where data is written infrequently but read very frequently.
For example, Myce’s content is most often written once and then read tens of
thousands of times and it is clear that our storage requirements are very much
read centric. To a large extent the same is true for the likes of Facebook, YouTube,
the BBC, and many other of the world’s most popular content rich websites.
Micron brings 16nm MLC NAND to the fight – how does it perform
and how does it stand up against its competitors? Please read on to find out.
Micron is undeniably a leading player in the storage market.
Their leadership position was recently reinforced when together with Intel they
announced the launch of a new storage technology know as ‘3D XPoint’
(pronounced "cross point", by the way). 3D XPoint promises to be
1,000 times faster and 1,000 times more durable than NAND flash. Earth
shattering stuff within the storage industry and no doubt to the world at large
in due course (my congratulations to anyone holding Micron stock that was
purchased before 28th July – I understand the Chinese would now like to buy it
:o) ).
Micron has also been pioneering with current NAND technology
and with the M510DC they have brought the use of lower cost (more gigabytes per
wafer) 16nm NAND to market, which could give them a price advantage.
Market Positioning and
Specification
Market
Positioning
This is how Micron
positions the Micron M510DC series of drives –
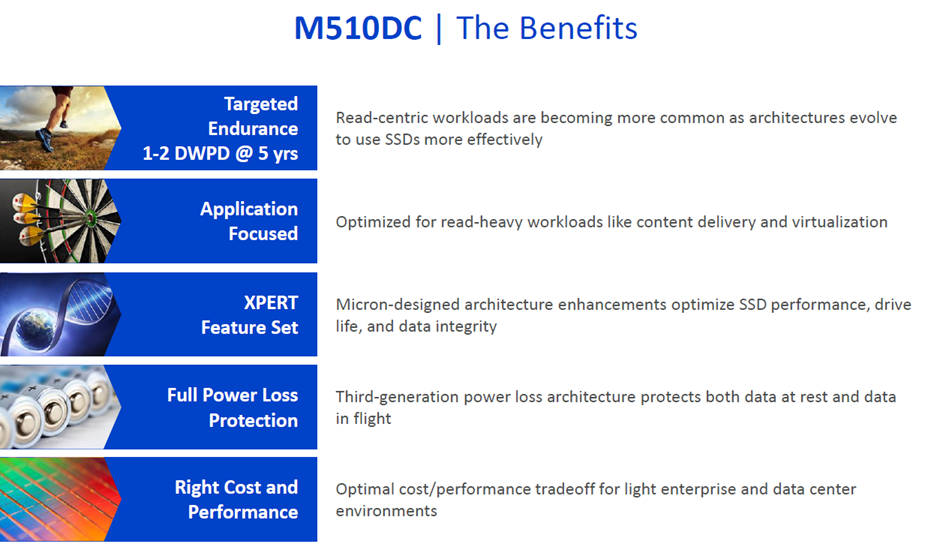
You can see that Micron targets read-centric workloads and
positions their XPERT feature set as an important differentiator. The XPERT
feature set provides architectural enhancements, including data path
protection, adaptive thermal monitoring, and power loss protection, that are
designed to greatly improve SSD performance, drive life, and reliability. The
Micron M510 also supports TCG compliant data encryption.
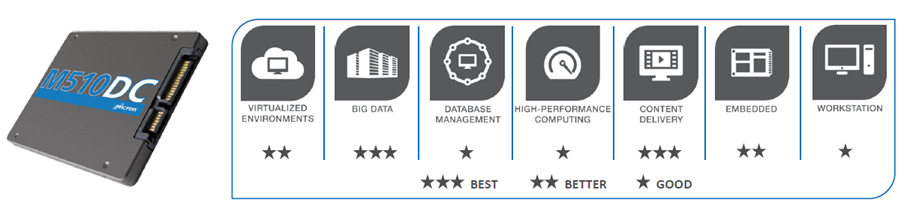
Here is
confirmation of the applications that Micron see the M510DC being best suited
to.
Specification
Here is Micron's
specification for the Micron M510DC series –
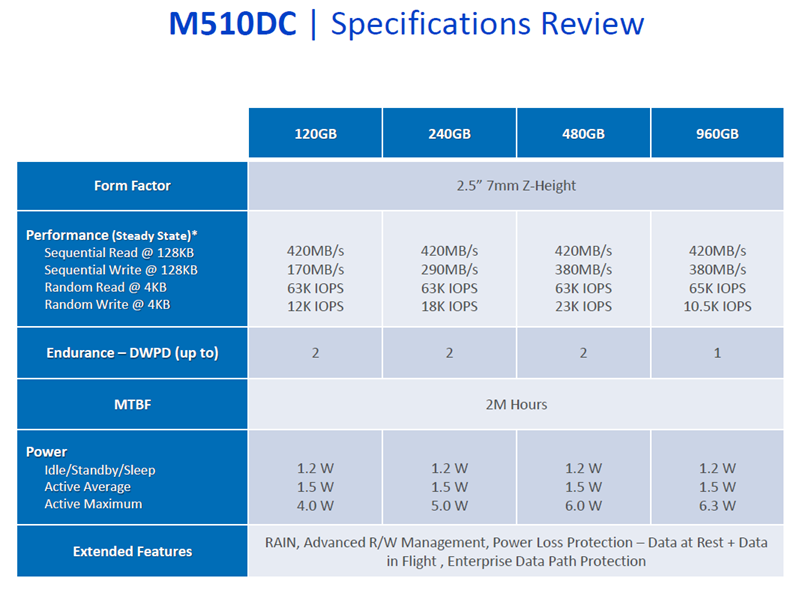
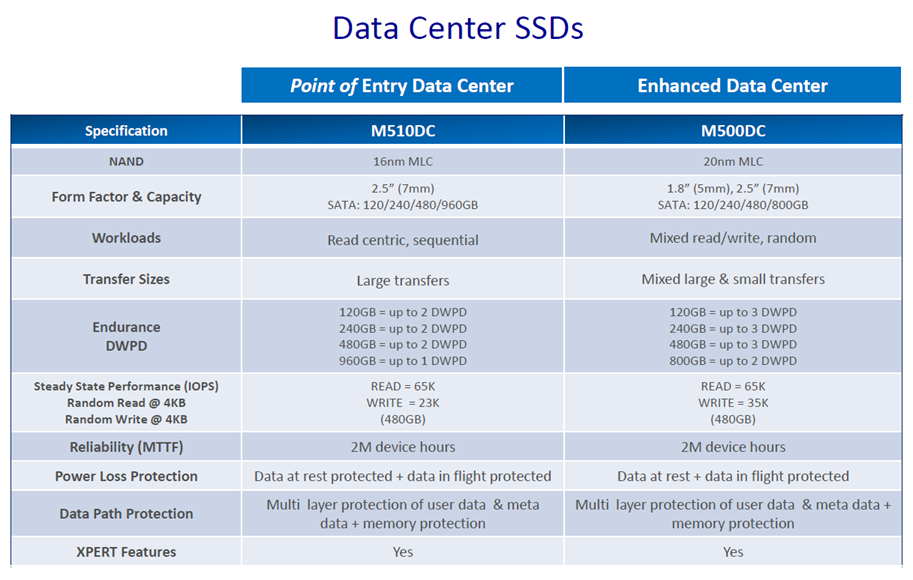
The Micron M510DC uses a proven Marvell controller.
In response
to a recent request I now take this opportunity to show you what an automated
test script, as used in our OakGate test system, looks like –
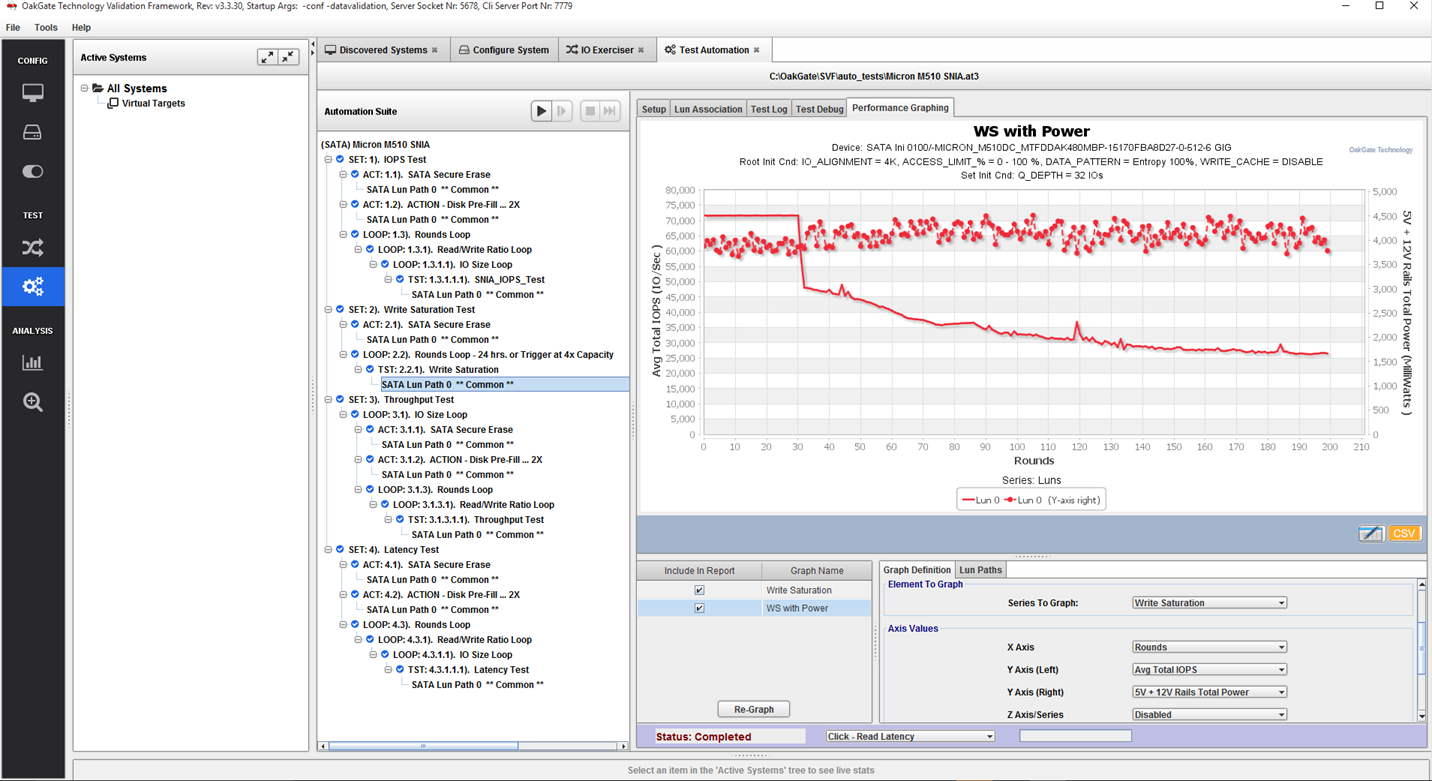
In the central pane you can see the script that runs the
SNIA tests (these scripts are remarkably easy to develop as the OakGate system
includes SNIA specific Steady State determination exits). On the right hand
side you can see the Performance Graphing functionality, which makes it very
easy to define and generate graphs.
Now let's
head to the next page, to look at Myce’s Enterprise Testing Methodology.....
Please click here
to view or download a detailed introduction to Myce’s Enterprise Class Solid
State Storage (‘SSS’) Testing Methodology as a PDF.
Put briefly:
All testing
is performed on an OakGate Technology test unit
We perform
two sets of Performance Tests:
1.
A full set of the Storage Network Industry Association’s (‘SNIA’) tests
with mandatory parameters, as specified in their Solid State Storage
Performance Test Specification Enterprise V1.0 – SNIA
SSS PTS Version 1.0.
2.
A set of tests, known as the ‘Myce/OakGate Full Characterisation Test
Set’, that provides readers with a fuller characterisation of the solution.
Comprehensive power consumption testing is performed using
Quarch hardware as documented here.
We also review other important factors such as Data
Reliability and Failover features.
A word about SNIA testing – before striking a partnership
with OakGate Technology I spent some time researching how I might implement
SNIA testing using freely available tools such as IOMeter and FIO. I arrived
at the conclusion that whilst it was theoretically possible it was impractical.
The reason for this is as without the automation offered by a test bench, such
as the OakGate Unit, the only way to meet the SSS PTS requirements is to run
the maximum number of test cycles and then to manually look back at the results
to determine when/if steady state has been achieved in the workload specific
test cycle, and then harvest the data from the qualifying Measurement Window. This
means that the test runs would always take a maximum elapsed time, and there
would be a great deal of human effort required to review, gather, and report
upon the data. I empathise with, acknowledge, and respect the efforts of other
reviewers who endeavour to meet the SNIA’s principles in their testing - I am
privileged and thankful to be able to use a superb test bench which automates
the whole process and allows me to meet the SNIA’s specification in full.
Before we
move on, let’s remind ourselves of some basics –
When
reviewing the performance of an SSS solution there are three basic metrics that
we look at:
1.
IOPS – the number of Input/Output Operations per Second
2.
Bandwidth – the number of bytes transferred per second (usually measured
in Megabytes per second, ‘MB/s’)
3.
Latency – the amount of time each IO request will take to complete
(usually, in the context of SSS solutions, measured in Microseconds, which are
millionths of a second).
It is true to say that IOPS and Bandwidth had all been
growing rapidly before the advent of SSS solutions, but Latency can only be significantly
decreased by eliminating mechanical devices, and thus Latency is the single
most important aspect that SSS solutions deliver to enhance performance.
Latency in a technical environment is synonymous with delay.
In the context of an SSS solution it is the amount of time between an IO
request being made, and when the request is serviced.
Bandwidth, also commonly referred to as ‘Throughput’, is the
amount of data that can be transferred from a storage device to a host, in a
given amount of time. In the context of SSS solutions it is typically measured
in Megabytes per second (MB/s).
A great enterprise SSS solution offers an effective balance
of all three metrics. High IOPS and Bandwidth is simply not enough if Latency
(the delay in an IO operation) is too high. As we will see in the test results
presented below, as Latency increases IOPS will inevitably decrease.
Queue Depth is the average amount of IO requests
outstanding. If you are running an application and the Average Queue Depth is
one or higher and CPU utilisation is low, then the application’s performance is
most probably suffering from a ‘Storage Bottleneck’.
Another important factor to remember is that SSS performance
is influenced by previous workloads, not just the current workload, and
especially by what has previously been written to the drive. As specified in
the SNIA SSS PTS the goal of all good Enterprise level testing is to provide
consistent circumstances, so that results can be compared fairly across
different SSS solutions – it is for this reason that all of our tests start
with a purge of the drive, so that it starts in a ‘Fresh Out of the Box’ (FOB)
state. Most tests then have a pre-conditioning phase where the drive is put
into a ‘Steady State’ before the test phase begins. Put briefly, a ‘Steady
State’ is achieved when the performance of the drive no longer varies over time
and settles into a consistent level of performance for the workload in hand. You
can find a detailed explanation of ‘Steady State’ and how it is determined in
the SNIA tests in our Enterprise Testing Methodology paper, which can be viewed
or downloaded as a PDF by clicking here.
For interest, here are some generally accepted
assumptions that differentiate the use and therefore the approach to testing
Enterprise/Server and Consumer/Client SSS solutions:
Enterprise/Server SSS assumptions:
1.
The drive is always full
2.
The drive is being accessed 100% of the time (i.e. the drive gets no
idle time)
3.
Failure is catastrophic for many users
4.
The Enterprise market chooses SSS solutions based on their performance
in steady state, and that steady state, full, and worst case are not the same
thing
Consumer/Client SSS assumptions:
1.
The drive typically has less than 50% of its user space occupied
2.
The drive is accessed around 8 hours per day, 5 days per week, and
typically data is written far less frequently
3.
Failure is catastrophic for a single user
4.
The consumer/client market generally chooses SSS solutions based on
their performance in the FOB state
Esther Spanjer, Director, Enterprise
Business Development EMEA at Sandisk, said, 'I am happy to commend Myce for
their high level of professionalism and cooperation during the review process',
Ms. Spanjer added, 'I wish them every success in their partnership with OakGate
Technology and their initiative to provide authoritative performance reviews
for the Enterprise Solid State Storage market'
Now let's
head to the next page, to look at the results of our SNIA IOPS (Input/Output
Operations per Second) Test.....
IOPS performance will typically vary greatly depending on
the nature of the IO traffic, including the mixture of Read and Write operations,
and the mixture of Block Sizes (the size of the IO operation’s data packet,
also referred to as IO Size). This test is designed to benchmark the IOPS
performance profile for random IO operations for 56 different combinations of
Read/Write mix % and Block Sizes when in a Steady State, which are of interest
to most users.
All of the SNIA’s test specifications define a ‘required’
set of parameters that must be run for the test and then allow the operator to
elect to run additional tests with different parameters of their choice. It is
the mandatory test with the required parameters that we run. Note that all of
the mandatory SNIA tests must be conducted with fully random data
As previously mentioned, a key
principle of SNIA testing is to provide a consistent basis for comparing
different solutions from different manufacturers.
Here are the
results -

You can see
here a visual confirmation that Steady State Convergence was determined at the
end of Round 5 (note that steady state convergence is calculated from the 4K
line).


Here is a 3D and tabular presentation of the results. Users
can simply refer to the grid to obtain the R/W mix and Block Size value of
interest. For example, Online Transaction Processing applications
typically run at a Block Size of 8K and a Read/Write Mix of 65/35, and users
can quickly understand how the device might perform under Steady State for
these access characteristics.
You can see that the 4K 100% Read IOPS result is 88,194 (that
comfortably exceeds Micron’s specification of 63,000) and that the 4K 100% Write
IOPS result is a 25,393 (which exceeds Micron’s specification of 23,000).
Product
Comparison
For interest
we present a comparison of the 4K 100% Writes and Reads results with those of
the other Enterprise SSDs we have tested -


Now let's
head to the next page, where we look at the results of the SNIA Write
Saturation Test.....
This test
performs random 4K writes.
The objective of this test is to observe the time evolution of
the drive’s performance, as a function of time, from a ‘factory fresh’, ‘fresh
out of the box’ (‘FOB’) state. When a drive is in a FOB state (e.g. after it
has been purged by, for example a SATA Secure Erase or SCSI Format), we can
expect an initial period of time when writes can easily be accommodated by
clean/empty blocks, but once all of the clean blocks have been written to once
and the drive’s controller must first clean blocks (with erase write
operations) before it can write new data, then we can expect a slow down. The
slow-down is usually quite dramatic and is commonly referred to as the ‘write
cliff’.
The Write Saturation Test is easy to run as it
requires no steady state determination – it can be easily run in freely
available software, such as IOMeter.
Here are the results -

You can see here a steep fall followed by a gradual drop in
Write IOPS performance as the Micron M510DC reaches a Steady State. The fall that
begins at Round 31 is the ‘write cliff’.
Note that the test was halted, as specified in the SNIA SSS
PTS, when 4 x the User Capacity had been written to the drive. You can see that
the Micron M510DC is settling towards a steady state at just over the 25,000
IOPS level, which is excellent for its target market.

You can also
see that the latency graph line is a mirror image of the IOPS graph line.
Now let's
head to the next page, to look at the SNIA Throughput Test.....
The test is designed to measure the sequential Read and
Write IO performance for two Block Sizes, when under Steady State conditions.
One can easily compare the results produced by this test with box-top numbers,
which are usually stated as “Up to xxx MB/S”.
Here are the
results -

You can see
here a visual confirmation that Steady State was achieved for both Write IO
sizes by the end of Round 5.
-

You can see
here a visual confirmation that Steady State for both Read IO sizes was
achieved by the end of Round 6.
Here are the
average values recorded in the measurement window –

These are reasonable results and they exceed Micron’s
specification for 128K sequential reads of 420 MB/s and writes of 380 MB/s.
Product
Comparison
For interest
we present a comparison of the 1024K sequential reads and writes (single port)
performance in comparison with those of the other Enterprise SSDs we have
tested -


Now let's
head to the next page, to look at the results of the SNIA Latency Test.....
The Latency Test measures average and maximum response times
using random IOs at specified Block Sizes and Read/Write mixes, taken under
steady state conditions. The test runs at a Queue Depth of 1 (1 outstanding
IO), thus the results give the baseline response time for a single IO request.
The test also
reports maximum latency values, which can be helpful to see if there might be
processes within the drive that may cause max Latency values to become larger.
Here are the
results -

You can see
here that Steady State was achieved in Round 9 through Round 13 (the
‘Measurement Window’). Note that the 4K Write line is used to determine the
achievement of steady state.

These are the
Average and Maximum Latency Values observed in each round of the Measurement Window
(measured in Milliseconds).

Here is a 3D
graph showing, at a glance, the Maximum Latency values for each combination of
Read/Write Mix and IO Size.

Here is a 3D
graph showing, at a glance, the Average Latency values for each combination of
Read/Write Mix and IO Size.
Product
Comparison
For interest
we present a comparison of the 4K 65% Reads 35% Writes latency results in
comparison with those of the other Enterprise SSDs we have tested -


Now let's
head to the next page, to look at the results for the Myce/OakGate 4K Read and
Write Latency Tests......
These tests steadily increase the random 4K IO demand in
terms of IOPS, and report the drive's response in terms of Average IOPS, Average
Latency and Maximum Latency. It is designed to show a drive’s maximum IOPS
capability and report the all important Latency numbers for each level of IOPS
demanded. The Maximum latency numbers give us an insight into the occurrence
of Latency peaks that could cause an unexpected response from time to time.
Here are the
results –
Firstly, here
is a graph showing the result for the initial Pre-Conditioning step (4K Random
Writes) –

You can see
the ‘write cliff’ at just over 2000 seconds, plus a distinct second step down
in performance at around 5,200 seconds.
4K Latency Read Test

You can see that the drive can no longer meet the increase
in IOPS demand at 89,000 IOPS, which is significantly greater than Micron’s specification
of 63,000.

You can see a
gradual increase in read latency up to the maximum IOPS mark.

You can see a
few max latency spikes.
Let’s have a
close look at the distribution of the Latency results at the 81,000 IOPS level
(at one of the spikes) –

As this is the first time in this review, that we are
looking at a High Resolution Latency Histogram, here’s an explanation – The X
axis to the left is the count of the IOs in the observation period (in a Round)
that had a Latency of the value along the Y axis (please note that the X axis
is logarithmic to allow the low order counts of the huge number of IOs that
have been measured to be visible); the Y axis is the Latency value measured in
Microseconds; The X axis to the right is the % of the Total IOs observed that
have a Latency <= to a given Latency value; the rate of getting to 100% is
highlighted by the red graph line.
You can see
that 99.9% of the Latency values are <= 710 Microseconds (0.71 Milliseconds)
and there are very few outliers, so the quality of service is very good.
4K Latency Write Test

You can see
that the Micron M510 begins to fail to meet the increase in demand at around
the 21,000 IOPS level (at the 23,000 level of demand the response is actually
below 22,500).

Here we can
see that Average Write Latency stays below 50 microseconds until a demand of 20,000
IOPS.

The maximum
write latency results are relatively high even at a low level of IOPS demand.
Now let’s
have a look at the distribution of the Latency Values at the 20,000 IOPS Mark –

You can see that 99.9% of the Latency Values are <= 4.59
microseconds. Although there are relatively few, you can also see that there
is a cluster of outliers with latency values in the range of 10,700 through
14,500 microseconds.
Now let's
head to the next page, to look at the results for the Myce/Oakgate Reads and
Writes Tests.....
The tests are
designed to show the Random and Sequential, Read and Write, performance metrics
for different combinations of Queue Depth and IO size.
Here are the
results -
Random Reads


Random Writes


Sequential Reads


Sequential Writes


Now let's
head to the next page, to look at the results for the Myce/Oakgate 4K Mixed Reads/Writes
Tests.....
This test is
designed to show the performance metrics for different combinations of Queue
Depth and Read/Write mix (the % of Reads and the % of Writes making up the IO
traffic)
4K Mixed R/W Test


Now let's
head to the next page, to look at the results of the Myce/OakGate Entropy Tests.....
These tests are designed to show performance metrics for
different combinations of Queue Depth and Entropy % (Entropy % is the degree to
which the data that is random and therefore incompressible). Testing with
different Entropy % levels has become important with the advent of controllers,
such as those from LSI Sandforce, that compress data before writing it to NAND.
Controllers that compress data can be expected to perform better with highly
compressible data (i.e. data with low Entropy).
The first
test performs 5 minutes of Random 4K writes for each combination of Queue Depth
and Entropy %.
The second
test does the same thing for a mixture of Read and Write traffic (70% Reads,
30% Writes).
4K Entropy Write Test

You can see there is little or no variance in performance to
be found in any of the Entropy tests, as the degree of random data increases
(and this comment applies to all of the test results for the Myce/OakGate
Entropy Tests). We can therefore conclude that the Micron M510DC does not
compress data.


4K Entropy 70% Reads 30% Writes
Test
As we saw no
evidence of compression in the 4K Entropy Write Test we skip the presentation
of the 70/30 entropy results.
Now let's
head to the next page, to look at Power Consumption and Data Reliability.....
Power
Consumption
I believe most people know that data centres are already one
of the major consumers of electricity in the industrialised world; indeed it is
estimated that currently 2% of all electricity consumption goes into IT
applications. According to the European Union the energy consumption of data
centres was 46 Terawatt hours in 2006 and is set to rise to 93 TW hrs by 2020. This
is equivalent to one hundred million 100W light bulbs burning 24 hours a day,
365 days a year.
Typically 40% of the power consumed by data centres is for
the IT load and 35% is for cooling the system. Generally speaking, if a drive
consumes more power it will produce more heat – so power consumption is indeed
a double edged sword. It is no surprise then that a significant proportion of
a data centre’s power consumption goes on servers. I understand cloud based
applications, such as Facebook, are the primary cause of the growth in servers
and the demand for storage space.
If you are a Facebook user, like me and the Reynolds sibs, and
you reside in Europe – this is most probably where your data is click here. Some
interesting Facebook statistics – Facebook has more than 1 Billion monthly
active users, it generates 1 Trillion page views per month and more than 219
Billion photos have been uploaded since launch – amazing! Here is an
interesting video showing the remarkable scale of Facebook’s largest North
American data centre click
here.
My thanks to Anna of Intel for pointing me to the following
Info-graphs -


Power Testing
We present
our standard set of power consumption tests.
SNIA Write
Saturation

This test allows us to observe the power consumption
characteristics as the drive passes from a fresh ‘out of the box’ state to one
where blocks must first be cleaned before they can be written to. It also
allows us to form a view on the amount of power that is being consumed by the
cleaning of the blocks (for 4K random writes). We can see a slight increase in
power consumption after hitting the write cliff at round 30, but roughly
speaking, by round 180 we can see that around 4,000mW is required to sustain
around 25,000 IOPS whereas before the write cliff, the same level of power was
sustaining around 72,000 IOPS. Thus we can deduce that roughly 47,000/72,000 of
the 4,500mW (i.e. roughly 65% of the power) is consumed by housekeeping.
4K Latency
Test - Reads

This test allows us to observe how power consumption
characteristics vary as the demand for random 4K reads (in terms of IOPS) is
increased. You can see that the demand for power increases gradually and in a
linear fashion.
4K Latency
- Writes

This test allows us to observe how power consumption
characteristics vary as the demand for random 4K writes (in terms of IOPS) is
increased. You can see that the demand for power increases gradually and in a
linear fashion.
We can use the points on these two lines to calculate the
sweet spot where one gets the best IOPS per mW for a given demand in IOPS. Here
is the resultant plot –

You can see that the sweet spot lies at the 29,000 IOPS
demand, which we could have guessed at intuitively. It is worth noting though,
that at this level of IOPS demand, the drive’s response is 24,298 IOPS.
4K Mixed
Reads/Writes

This test allows us to see how power consumption
characteristics vary when performing 4K random reads and writes with different
combinations of read/write % and queue depth. As would be expected, you can
see that as one increases the % of writes the power consumption increases.
We have then
taken the data to calculate the IOPS per mW for each combination, as follows -

The IOPS per mW results can then be compared to those for
the Toshiba THNSN960PCSZ (the drive with the best power consumption results,
that has thus far been subjected to our Enterprise Power Tests)

You can see
that the Micron M510DC is behind the Toshiba THNSNJ960PCSZ with regard to 4K
Read/Write efficiency.
Sequential
Reads

This test allows us to see how power consumption
characteristics vary when performing sequential reads with different
combinations of IO Size and queue depth. As might be expected, the power
consumption increases as the MB/s increases.
We have then
used this data to calculate the MB/s per mW as follows -

The MB/s per
mW results can then be compared to those for the Toshiba THNSN960PCSZ (the
drive with the best power consumption results, that has thus far been subjected
to our Enterprise Power Tests).

You can see
that the Toshiba is significantly more power efficient.
Sequential
Writes

This test allows us to see how power consumption
characteristics vary when performing sequential writes with different
combinations of IO Size and queue depth. As might be expected, the power
consumption increases as the MB/s increases.
We have then used
this data to calculate the MB/s per mW as follows -

The MB/s per
mW results can then be compared to those for the Toshiba THNSN960PCSZ (the
drive with the best power consumption results, that has thus far been subjected
to our Enterprise Power Tests).

Again, you can see that the Toshiba is significantly more power
efficient.
Power Up
to Idle

This test
allows us to see the shape of the power demand as a drive is powered up. It
also allows us to see the peak level of current demanded to kick the drive into
life.
As you can
see, power is drawn from only the 5v rail and peaks just after 4,000mS.

Here is a
closer look at the first 150 mS. You can see that the drive initially comes to
life when the supply has reached around 1,200mV on the 5v rail.
Idle

This test
allows us to view the power consumption characteristics when a drive is idling
(powered up but with no IO activity).

Here is a
picture of the raw data values that were recorded.

Here are the
statistics calculated for the recording.
The average
power used when idling was 1,125mW from the 5v rail, which compares favourably to
Micron’s specification of 1,200mW.
Data
Reliability
The 'Unrecoverable Bit Error Rate' (UBER),as defined by
JEDEC, the global leader in developing open standards for the microelectronic
industry, is a metric for data corruption rate equal to the number of data
errors per bit read after applying any specified error correction method. UBER
= number of data errors / number of bits read. JDEC specifies that the maximum
error rate allowable for an Enterprise level SSS solution is one error in every
10^16 bits read.
Micron specifies an UBER of 1 in 10^16 bits read
for the Micron M510DC.

The Micron
M510DC 480GB is warranted to support up to 2 Drive Writes per Day (DWPD) over 5
years.
The Micron
M510DC includes sophisticated power failure support and end-to-end data
protection.
Now let's
head to the next page, to look at the Conclusions of this review.....
As was stated earlier, the Micron M510DC targets the
intensely competitive ‘Read Centric, Low Cost’ market segment. We have tested
a number of its key competitors in the past – The Samsung 845DC EVO, the
Toshiba THNSNJnnnPCSZ, and the Intel DC S3500. For interest I have drawn
together some of the key metrics we have discovered in our reviews of these
competitors, to enable readers to compare these drives to the Micron M510DC and
to endeavour to reach a conclusion as to which drive is the best solution (I
could also have included the Sandisk Cloudspeed 1000E but I feel this belongs
in what I am going to in the future refer to as the ‘Mixed Workload’ market
segment, which for me lies between the ‘Read Centric’ segment and what I will
refer to as the ‘Write Intensive’ market).
The metrics I have pulled out are –
For 4K Random 100% Reads and 100% Writes – IOPS (the IOPS
level recorded in the SNIA IOPS test); IOPS per mW (the IOPS per milliwatt as recorded
in our Myce/OakGate Mixed Reads/Writes Test); the Quality of Service, being the
latency that 99.9% of all IOs equalled or fell below, as recorded in the
Myce/OakGate 4K Latency Read and Writes Tests.
For 4K Random Mixed (50% Reads and 50% Writes) – IOPS (the
total IOPS level recorded in the Myce/OakGate Mixed Reads/Writes Tests); IOPS
per mW (the IOPS per milliwatt as recorded in our Myce/OakGate Reads/Writes
Test)
For 32K Sequential Reads – MB/s and MB/s per mW (MB/s per
milliwatt as recorded in our Myce/OakGate Sequential Reads Test)
Endurance – the number Drive Writes per Day (DWPD) as
warranted by the drive’s manufacturer.
(Please note that no power consumption data is available for
the Intel DC S3500 as our review predated the arrival of Quarch Technology
power monitoring equipment in our test laboratory)
Here is a chart of the metrics -

You will immediately notice that I have not included price
in the chart. This is a major omission but to be upfront about it I find it nigh
on impossible to get meaningful pricing data for enterprise drives. The price
an enterprise customer pays is greatly dependant on the volume they purchase.
It is easy to imagine that when the likes of Facebook, Google, and Microsoft
are in town, shopping for 1000’s of drives, they will command a significant
discount.
Some observations –
Customers with Read-Centric requirements will not want to
pay more for endurance they don’t need (this is perhaps one of the reasons that
enterprise customers used to buy consumer drives, although I suspect o longer do so given the aggressive pricing and useful enterprise features that
now prevail in this market segment).
The Toshiba THNSNJnnnPCSZ has a clear advantage when it
comes to power consumption. The reduction in TCO that reduced power consumption
delivers would have to be factored in to any major purchasing decision.
There is no great difference between the drives when it
comes to 4K Random Read performance – the Toshiba has the best Quality of
Service.
The Micron M510 has the best 4K Random Write performance but
its Quality of Service is a bit patchy, whilst the Samsung 845DC EVO delivers a
remarkably consistent Quality of Service even though its IOPS score is behind
the Micron and the Toshiba.
The Toshiba has the best 4K Random Mixed performance.
The Micron M510 lags behind on Sequential Read Performance
and I feel this may be a turn off for many buyers.
The Micron M510 has the best endurance and this may attract
customers with overlapping Read-Centric and Mixed Workload requirements.
So, which is the best drive – well, it really does depend on
your specific requirements and the price you can command.
In conclusion, if the price is right I believe the Micron
M510DC will prove to be an attractive proposition and will find many customers
and I am pleased to award the Micron M510 the Myce rating of ‘Excellent’.


")


