|
|
Review: OCZ Vector 150 240GB SSD |

A year is a long time in the SSD business, and it's hard to
believe that the original OCZ Vector SSD launched nearly one year ago. The
original Vector was the first SSD to use the Indilinx BareFoot 3 SSD
controller. The original Vector also used IMFT 25nm MLC NAND.
It won't have escaped your notice that 25nm NAND has been
phased out, and is now very difficult to source in quantity. 25nm NAND has now
been replaced by 19nm, and 20nm NAND respectively. Generally, the smaller node
NAND doesn't perform as well as the its larger counterpart. Of course, the
smaller node NAND is cheaper to produce, and allows for more storage in the
same size of package.
It isn't exactly news that OCZ has found it very difficult
to source 25nm NAND for the Vector range of SSDs, so much so that the Vector
range is quite difficult to get hold of. The Vector is OCZ's enthusiast part,
and it's quite clear that they needed a replacement for the Vector, and needed
that replacement immediately. Enter the Vector 150 series of SSDs.
The Vector 150 utilises the familiar BareFoot 3 SSD
controller, but the NAND has made the transition to the smaller node size. The
Vector 150 now uses Toshiba 19nm toggle mode MLC NAND. OCZ was kind enough to
send me a Vector 150 review sample, the 240GB version to be exact. The Vector
150 is available in 120GB, 240GB, and 480GB capacity versions.
So let's find out how this new SSD performs in our range of
tests.
OCZ Technology company information
OCZ should need no introduction, but those of you who would
like to find out more about OCZ, can do so at their website.
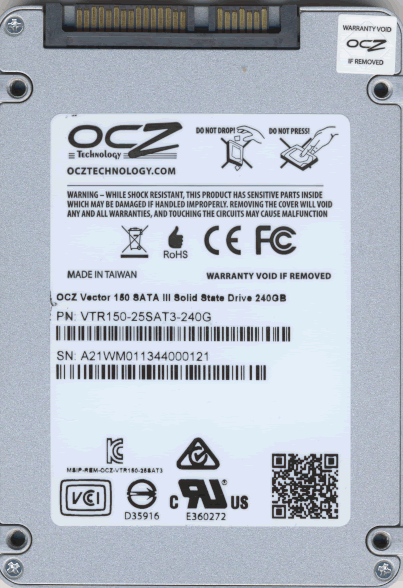
The OCZ Vector 150 - 240GB SSD
Now it’s time to take a look at the drive itself and what it
came shipped with.
Packaging
The review sample I received was the full retail kit.
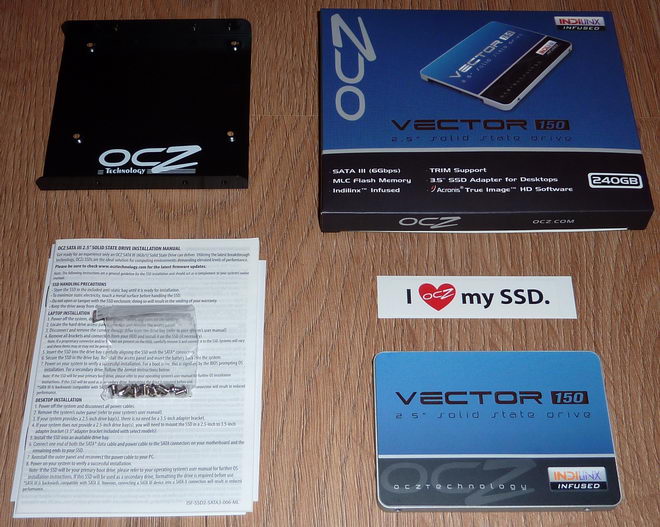
OCZ Vector 150 240GB SSD full retail kit
The full retail kit contained the following items. The
Vector 150 240GB SSD itself, 3.5 inch to 2.5 inch drive converter bracket,
eight fixing screws, an 'I love my SSD' sticker, instruction booklet, warranty
information, and a licence key for Acronis True Image 2013 HD.
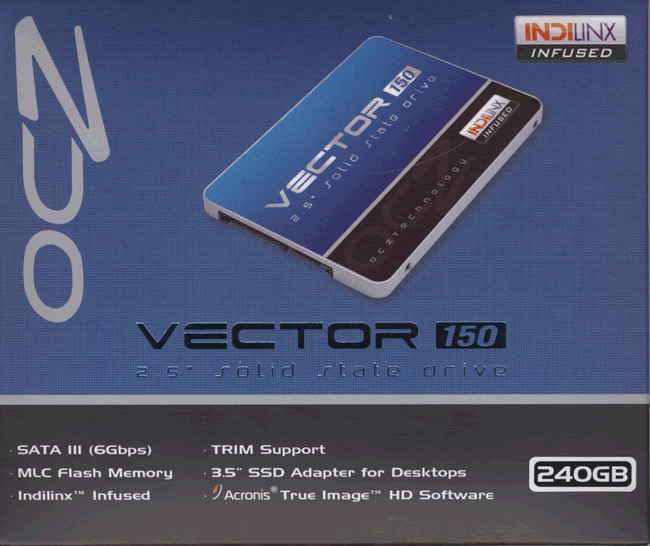
Box front

Box rear
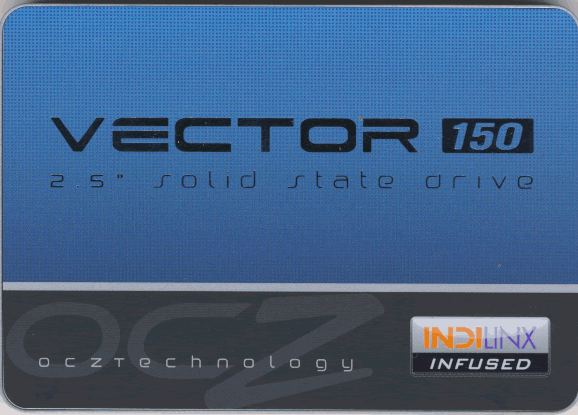
Drive top
Drive bottom
The casing on the OCZ Vector 150 is 7mm thick and an all
metal affair, with the bottom of the case acting as a heat sink for the
BareFoot 3 SSD controller.
Software
The software supplied via download from the OCZ Technology
website is as follows.
- OCZ SSD Toolbox
- Acronis True Image HD
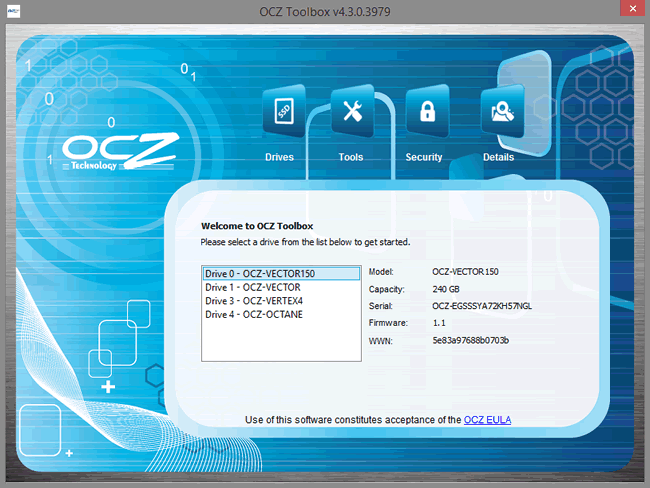
OCZ SSD Toolbox
The OCZ SSD toolbox provides a means of updating the SSD's firmware,
Secure Erasing the SSD, and also providing useful information about the OCZ
Vector hardware via S.M.A.R.T.
Bundled Acronis True Image HD 2013
As I mentioned a little earlier on this page, the OCZ Vector
150 is bundled with a serial key for Acronis True Image HD 2013. Primarily this
software is provided to allow the consumer to easily migrate their existing
system partition over to their new Vector 150 SSD. But, True Image HD also has
a few other very useful features. Let's take a brief look at the True Image HD
software.

Note: Not all features are available in the OEM version.
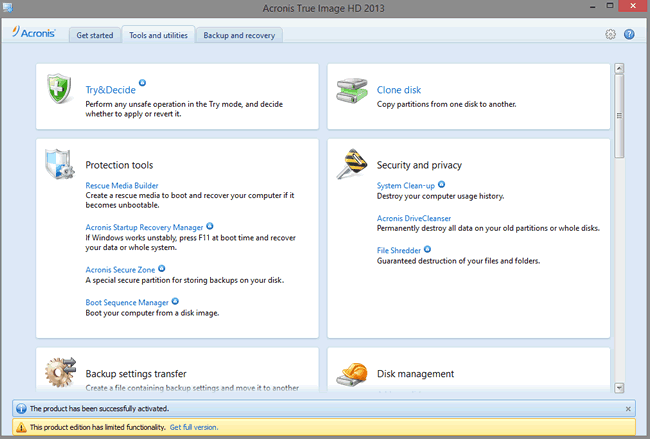
Available tools.
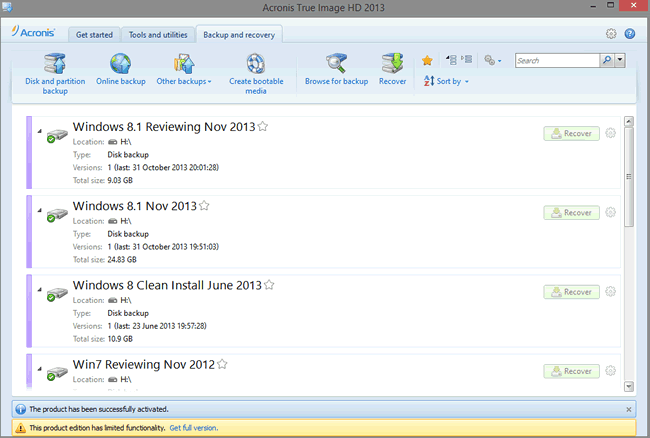
Recover the backup of your system drive to your new Vector 150 SSD
Cloning your system drive to your new Vector 150 only takes
a few simple mouse clicks, and enough HDD space for the backup data itself.
Recovering the backup to your new Vector 150 SSD is once again a very simple
task, only requiring a few simple mouse clicks.
Now let's head to the next page, where we look in more
detail at the OCZ Vector 150 SSD.....
A closer look at the OCZ Vector 150 hardware.
PCB

PCB topside
The topside of the PCB hosts eight 19nm Toggle mode MLC NAND
chip packages manufactured by Toshiba. We can also see the first of two DDR3
cache chips, and various support components.

PCB underside
The underside of the PCB hosts the Indilinx BareFoot 3 SSD
controller, another eight NAND chip packages, and the second of the two DDR3
cache chips.
The SSD controller

The SSD controller is the Indilinx BareFoot 3 designated
IDX500M00-BC. The controller also supports an AES-256 encryption engine, by
means of password protection in the system UEFI/BIOS.

Indilinx BareFoot 3 block diagram
The Indilinx BareFoot 3 is actually powered by two CPU's.
The first is an ARM Cortex, and the second is much more interesting, the OCZ
Aragon co-processor. Aragon is an R.I.S.C. architecture co-processor
specifically designed for SSDs, and is there to efficiently manage the NAND
flash interface. The NAND interface has support for ONFI and toggle mode NAND,
and there are eight channels available to the NAND array. Unfortunately, there
is not much more known about this processor, but it is most likely clocked at
around 400MHz.

DDR3 cache
There are two DDR3 cache memory chip packages mounted on the
240GB Vector 150 SSD, giving a total cache of 512MB, which is manufactured by
Micron.
The NAND

The NAND is 19nm Toggle mode MLC manufactured by Toshiba.
There are 16 packages onboard the Vector 150, giving a total of 256GB, but only
240GB of this NAND is available for user storage. 16GB of the NAND is set aside
for exclusive use by the controller (over-provisioning). This OP area is there
to enhance sustainable performance, and increase durability. The OCZ Vector 150
is guaranteed to be able to withstand 50GB of writes per day for a period of
five years.
Drive maintenance features
For Windows 7 and Windows 8 users, and some distributions of
Linux, the OCZ Vector 150 series SSD supports ATA TRIM to keep the NAND clean.
The OCZ Vector 150 series also has advanced garbage collection to clean the
NAND during drive idle periods.
Specifications

Features


Let’s head to the next page where we take a look at our
testing methods and the review PC....
Test machine
For this review I will be using a computer with the
following configuration:
Hardware:
- Motherboard: Asus Z87 SaberTooth (Intel Z87 chipset)
- Processor: Intel 4th generation Core i7 4770K
- CPU cooler: BeQuiet Dark Rock Pro 2
- RAM: 16GB Samsung Green DDR3 1600MHz (dual channel)
- GFX: Onboard Intel HD 4600
- Sound: Onboard Realtek ALC1050 HD audio controller
- Hard disk OS: OCZ Vector 256GB SSD.
- Case: Antec Performance One P280
- PSU: Antec True Power modular 550W
- Display: Dell UltraSharp U2412M 24” widescreen IPS LCD (HDCP
compliant) - Operating System: Windows 8.1 Professional 64bit
The OCZ Vector 150 SSD was connected to the Intel native SATA
6Gbps (port 0) on the Z87 motherboard of our review PC and all tests on the drive
were carried out with the drive connected to this port.
AHCI mode was also selected for all drives in the UEFI of
our test PC, and all tests were carried out in this mode. The SATA 6Gbps drivers
used on our review PC were the Intel Rapid Storage Technology (RST) Version
12.8.0.1016.
CPU power saving states were disabled for consistency, and
all the SSDs in this article were tested with all CPU power saving states
disabled.

Test applications
To test the performance of the OCZ Vector 150 series 240GB
SSD, I will be using the following test applications in this review.
- HD-Tune Pro
- ATTO
- Iometer
- AS SSD
Benchmark - CrystalDiskMark
- MyCE Reality Suite
- Anvil’s
Storage Utilities - PC
Mark 8
Test procedures
I will start off our testing procedures explanation by
stating that I did not run many synthetic benchmarks on the OCZ Vector 150 SSD.
You may ask why I have run so few synthetic benchmarks?
SSD technology has moved so fast in the last couple of years,
that basic synthetic benchmarks alone are now of very limited use, as they don't
really tell us much about performance and how the drive will behave in the real
world. I have therefore decided to show some basic benchmarks of the OCZ Vector
150 series SSD, and will complement this with advanced benchmarks using IOMeter
and AS SSD benchmark. I will also show how the OCZ Vector 150 series SSD performs
in the real world with our Myce Reality Suite test.
The reality of SSD performance
While I can easily show you which SSD is technically the
faster, when you use one of these modern SSDs as an operating system drive it
becomes very difficult to tell them apart as far as performance is concerned.
A typical use of a small capacity SSD at the moment is to
have your operating system and applications installed onto the SSD. The
performance difference compared to a traditional HDD is enormous, however when
you start to compare SSD to SSD the difference becomes almost impossible to
detect.
Let’s look at why this is the case.
Drive A can boot to the desktop in 8.11 seconds, and drive B
can boot to the desktop in 8.12 seconds, the difference in time is
milliseconds, and can one really tell the difference?
The fact is, all modern SSDs are only ticking over when they
are only running the OS and launching applications, it’s only when you get to
some of the larger capacity SSDs, with enough free space to be able to hold the
actual data that you’re going to be working with, be that video, audio or
pictures, for example, that you actually get a tangible difference in
performance. This is where the SSDs with the better sequential performance start
to pull well ahead of the SSDs which have lower sequential read/write
performance.
Small file random IOPS vs sequential performance
IOPS
This is a fairly complex subject, but I will do my best to
explain things in a manner that is easy to understand.
The term IOPS is the amount of input or output transactions
that can take place in a one second interval, so for example, if an SSD is
quoted as being able to cope with 20,000 4K random write IOPS, then the SSD
should be able to cope with 20,000 input transactions in a period of one
second. If the same SSD is said to be able to produce 20,000 4K random read
IOPS, then the same SSD should be able to produce 20,000 4K random read output
transactions in a one second interval.
Ok, now we have some figures to work with, the next question
is how many IOPS are actually required?
This will depend on your usage pattern. If you are a typical
desktop user who browses the internet, does some word processing or perhaps
some audio or video editing, and perhaps plays a few games, then in actual
fact, you don’t need to have massive 4K random read/write performance. The
actual amount of 4K random performance that is required for a fast and smooth
running system for a desktop user with a usage pattern similar to the above
will be well under 1,000 4K IOPS.
On the other hand, if the SSD is being used for running a
large and complex database server, then 4K random performance is the absolute
measurement of how fast that server will run, as this type of application does
most of its input and output transactions in the 4K domain.
So why would I need an SSD with 80,000 4K IOPS for a
desktop?
In fact you don’t need this type of performance for a
desktop, but an SSD which is capable of coping with 80,000 4K IOPS will be
faster than an SSD which can only cope with 20,000 4K IOPS.
OK, I just said if under 1,000 4K IOPS are actually required
for typical desktop usage, why is an SSD with 80,000 4K IOPS faster than an SSD
with only 20,000 4K IOPS, confused?
You may ask, if I only require 1,000 4K IOPS surely the rest
is wasted?
While you may never need 80,000 4K IOPS, IOPS is all about
latency. The reason that an SSD can cope with as much as 80,000 4K IOPS is
because latency in this domain is very low. With 4K files, even if you require
to process 500 of them at the same time, you are not talking about a huge
amount of data, it has far more to do with how long it takes the SSD to process
a single file, and the amount of time required to process a single 4K is all
about how long it takes for the SSD to access or store that data before it can
move on to the next transaction.
In other words an SSD with 80,000 4K IOPS performance will
handle those 500 files faster than the SSD with 20,000 IOPS.
So how will a desktop user even notice this faster speed if
so little 4K random IOPS and data are actually used?
Multitasking is a good example. The more tasks you run at
the same time, you more you will notice the speed difference.
Sequential performance
I have always maintained that sequential performance was
every bit as important as small random file performance for a desktop SSD. To
me this was always so obvious for a desktop user. For example, let’s say you
want to launch an application or game. Both have some fairly large files to
load, and also a great many small files, but the point is, even the smaller
files are sequential in nature. Now let’s say you’re into audio or video
editing. Video files tend to be huge, and the files are written or read
sequentially. Isn’t this how many users are using their PCs these days?
Summary
So how does this shape up in the real world? Which is
better, massive 4K IOPS or massive sequential performance?
In an ideal world you want both, as an SSD with massive random
4K IOPS and sequential performance will always be faster than an SSD that has
high sequential performance and moderate 4K random IOPS performance, and the
same applies to an SSD that has massive 4K random performance and moderate
sequential performance. The SSD which has high performance in both patterns
will always be the faster SSD.
However, you can still have an SSD that is very fast for
desktop use that has moderate random 4K performance and massive sequential
performance, the same can be said about a drive having massive random 4K
performance and moderate sequential performance, as it is about getting the
balance right if you have to compromise on one or the other.
Test drives
- Intel 520 series 240GB
- OCZ Vertex 4 512GB SSD
- OCZ Agility 4 256GB SSD
- Corsair Neutron GTX 240GB SSD
- Samsung 830 256GB SSD
- OCZ Vector 256GB SSD
- Toshiba THNSNF512GCSS
512GB SSD - Samsung 840 Pro 512GB SSD
- Plextor M5 Pro 512GB SSD
- Samsung 840 250GB SSD
- Kingston V300 240GB SSD
- OCZ Vertex 3.20 240GB SSD
- OCZ Vertex 450 256GB SSD
- Seagate 600 series 480GB SSD
- Samsung 840 EVO 250GB SSD
- Samsung 840 EVO 750GB SSD
- OCZ Vector 150 240GB SSD
Drive preparation for running the tests
All the SSDs used in this article were in a clean and fresh
state when the testing period started. From then on, each drive had to rely on
its own NAND cleaning effectiveness for the remainder of the tests.
For the sake of clarity, I now only include SATA 6Gbps SSDs
in these tests, and all were connected to the native Intel SATA 6Gbps (port 0)
of my motherboard for these tests.
- All SSDs used in this article had their partitions aligned
to the Windows 8.1 x64 defaults.
Where I use graphs in this article to display results, I
will use the following colours to make it easier, for our readers to see which drive
we are reviewing.
![]() OCZ Vector 150 240GB SSD
OCZ Vector 150 240GB SSD
![]() Comparison SSD
Comparison SSD
Now let's head to the next page, where I look at some
basic benchmarks...
Synthetic Benchmarks
HD Tune Pro
In this benchmark I am checking sequential reading speed.

With an average sequential reading speed of 523.7 MB/s the OCZ
Vector 150 shows an excellent turn of speed.
Let's see how this compares to other recently tested SSDs in
the table below.

The OCZ Vector 150 has done extremely well in the HD Tune
Pro 5 sequential reading test, and whilst there isn't a large margin between
the top SSDs, the OCZ Vector 150 240GB is the seventh fastest in this test.
ATTO disk benchmark
ATTO has become a standard tool for measuring the data
throughput of HDD and SSD. It measures the reading and writing performance,
using different file sizes and block sizes.

The reading speed results on the OCZ Vector 150 are
extremely impressive, topping out at nearly 558 MB/s, and writing speed is
equally impressive topping out at nearly 534 MB/s.
Let's find out how this compares with other recently tested
SSDs.
ATTO Reading performance

ATTO - Reading performance at various block sizes
The OCZ Vector 150 is one of the fastest SSDs when reading
data, although it does have the characteristic BareFoot 3 dip at 16K and 32K
block sizes.
ATTO Writing performance

ATTO - Writing performance at various block sizes
The OCZ Vector 150 is showing excellent writing performance.
CrystalDiskMark 3.0
Crystal Disk Mark is quite a handy benchmarking application,
as it focuses on the file sizes that can cause a problem on a system drive.

As we can see from the above screenshot, sequential reading and
writing speeds are both very impressive, random reading and writing speeds at
low and high queue depths are excellent.
AS SSD Benchmark
AS SSD benchmark is a benchmarking tool specifically
designed to test SSDs. The application tests sequential reading and writing
performance, 4K random reading and writing performance.
AS SSD benchmark also tests 4K threaded performance. This is
very exciting, as this test is the first available test that I am aware of,
that simulates how a PC operating system actually works. A modern PC and OS,
such as Windows 7/8 does not just run a single thread at a time, it runs many
threads. The AS SSD benchmark "4K 64Thrd" tests run 64 threads
simultaneously throughout the test. If this result is good, then you can be
pretty sure the drive will perform extremely well as a system drive.
After the tests complete, AS SSD benchmark derives a total
score for the drive being tested. This is based on all aspects of the test
results, and gives an indication of how the drive is performing overall.
Now let’s look at the result from the OCZ Vector 150 SSD in
the form of a screenshot. All our other comparison drives’ results are
presented in the form of a graph.


As we can see from the AS SSD test run, the OCZ Vector 150
has excellent reading performance, and writing performance is very impressive, finishing
this test in fourth place overall.
Summary:
The OCZ Vector 150 240GB SSD has performed extremely well in
the basic synthetic benchmarks. Random reading and writing performance is very
impressive. Sequential reading and writing performance is excellent.
Let's head to the next page for our IOMeter test
results.....
I/O Performance
There is little point of having an SSD drive that has
blazing sustained reading and writing speeds, if the drive can't handle reading
and writing of small random files. If you intend to use your new SSD drive to
store and run your operating system, then the drive must be able to cope with
the many small random files that Windows will write to the drive continually.
So I feel it is very important to test how many of these random files that a
drive can handle in one second. I believe that anything over 1,000 I/O’s per
second would be enough for most users running a consumer grade mainstream PC,
and should provide a smooth running system. But obviously, the more I/O's that
a drive can handle, the faster the drive will feel and leave more headroom for
those huge multitasking sessions that users sometimes engage in.
IOMeter is probably the most versatile of all the synthetic
benchmarks. Its ability to be configured to generate a multitude of different
I/O traffic is unmatched. Another great feature of IOMeter, is the capability
to test any storage metric that you can think of, providing you know how to
configure the assignments. The reviewer also has complete control over things
like queue depth, block size, whether the traffic is random, sequential, or
even a mixture of both.
Partition alignment and sector boundaries
Windows 8.1, Windows 7, and Windows Vista will automatically
align a partition to 4k boundaries during partition creation, Windows XP won’t.
It is imperative that an SSD’s partition is aligned. Windows XP is also
restricted to sector boundaries, while Windows 7 and 8 will use 4k boundaries
if they can. The OCZ Vector 150 is 4k boundary aware, and will use these
boundaries if possible. Of course it will also remap LBAs for compatibility
with the sector boundaries so that the drive can be used with Windows XP.
IOMeter allows us to set the sector boundaries for
conducting the tests, and I have therefore set the sector boundaries at 4K,
which means the IOMeter tests are valid for Windows 7, Windows 8 and Windows
Vista users. XP users will not be able to obtain such results.
I will provide a screenshot of the tests on the review drive
for those of you who like to see the actual test result. All the comparison
drive results are represented in the form of graphs.
If any of you would like to see a screenshot from any
IOMeter test on a particular drive, please feel free to request one, and I’ll
post the screenshot in the forum thread.
All the IOMeter tests create a 10GB data set on the target
drive, and each test is run for a duration of 3 minutes.
IOMeter 4K random write test with repeating data.
The first test involves creating continual 4KB random files
on the target drive with IOMeter. I use a 4KB file size, as it is believed that
Windows will create and modify many of this size of file constantly in the
background during a typical Windows session. It is said that most 4K random
writes take place at a queue depth of only one, and I have been requested to
include this test in my reviews.
Queue depth 1

OCZ Vector 150 240GB SSD – 4K random write (QD 1)

At 166.73 MB/s the OCZ Vector 150 is outstanding, and
finishes this test in first place.
Our next test involves creating continual 4KB random files
on the target drive with IOMeter. I use a 4KB file size, as it is believed that
Windows will create and modify many of this size of file constantly in the
background during a typical Windows session. I will use queue depths of 4 and
32 for these tests.
Queue depth 4

OCZ Vector 150 240GB SSD (QD 4)

At a queue depth of 4, the OCZ Vector 150 delivers excellent
performance, and finishes this test in sixth place.
Queue depth 32

OCZ Vector 150 240GB SSD (QD 32)

At 370.76 MB/s, the OCZ Vector 150 240GB SSD has outstanding
performance, and finishes this test in fifth place.
IOMeter 4K random write test with fully random data.
This test is exactly the same as the test above except that
the test data is fully random and is therefore much more difficult to compress.
This test was requested as SandForce based SSDs gain a lot of performance by
being able to compress data on the fly. While the above test shows the
SandForce based SSDs in a best case scenario, the following test will show the
SandForce based SSDs in a much more realistic scenario.
Queue depth 4 with fully random data

OCZ Vector 150 240GB SSD – 4K random write (QD 4 with fully random data)

The OCZ Vector 150 pays no penalty when writing data which
is incompressible, and with 308.03 MB/s it finishes the test in sixth place.
4K random write queue depth profile
For this test I used various queue depths from 1 – 32 to
give you an idea how this SSD performs at different queue depths. For a normal
desktop user, with lightweight multitasking, the queue depth will rarely rise
above 2. For heavy multitasking, the queue depth is unlikely to rise above a
value of 8.
The results are shown below.

As we can see, the OCZ Vector 150 has very impressive
performance at low queue depths, and it doesn't stop there, as each rise in
queue depth gives increasing performance, with the exception of a slight dip at
a queue depth of four.
Below I present a table of the results in more detail.

IOMeter 4K random read test.
If there are many 4k files created, then that must also mean
that many 4k files need to be read. This test measures 4k reading performance.
It is said that most 4K random reads take place at a queue
depth of only one, and readers have requested that I include this test in my
reviews.
Queue depth 1

OCZ Vector 150 240GB SSD - 4K random read (QD 1)

In this test the OCZ Vector 150 is performing well, but is
ultimately outgunned by quite a few SSDs in this test.
Queue depth 4

OCZ Vector 150 240GB SSD - 4K random read (QD 4)

Once again the Vector is outgunned by many of the SSDs in
this test, and finishes in fifteenth place.
Queue depth 32

OCZ Vector 150 240GB SSD - 4K random read (QD 32)

At a queue depth of 32, the OCZ Vector 150 is performing
very well, and finishes the test in ninth spot.
4K random read queue depth profile.
This test shows how the review drive scales with increasing
queue depths.

Below I present a table of the results in greater detail.

If we look at the OCZ Vector 150 4K random read performance
in detail, at lower queue depths it can't keep pace with some of the SSDs in
this test. However, at high queue depths the OCZ Vector 150 really starts to
shine.
IOMeter 512KB write test with repeating data.
Sequential writing performance is also very important; in
this test sequential writing performance is measured.

OCZ Vector 150 240GB SSD - 512K Sequential write with repeating data

The OCZ Vector 150 shows an excellent turn of speed, finishing
this test in seventh place, and is only marginally slower than the fastest SSD
in this test.
512K sequential write - Queue depth profile
While most sequential writes will rarely rise above a queue
depth of two, it has been noted from SATA analyzer traces that with more
demanding tasks, queue depths can rise very close to a queue depth of four.
This is why I now include queue depth profiles for sequential read and write.
Please note that in the following graph, I do not have the
lowest possible score set at zero. This is purely to allow the graphs to be
easier to read, but starting with a lowest possible score other than zero,
gives the impression that there are large differences between competing SSDs with
regard to performance, so please keep this in mind.

512K sequential write - Queue depth profile
Below I present a table of the results in more detail.

The OCZ Vector 150 series reaches peak performance at a
queue depth of four, where it manages a very impressive 528.82 MB/s.
IOMeter 512KB sequential write test with fully random data.
This test is almost exactly the same as the test above
except that the test data is fully random in nature. This test was requested as
SandForce based SSDs gain a lot of performance by being able to compress data
on the fly. While the above test shows the SandForce based SSDs in a best case
scenario, the following test will show the SandForce based SSDs in a more
realistic light. In the real world, the data is neither 100% incompressible nor
100% compressible, it is somewhere in between. So please keep this in mind.

OCZ Vector 150 240GB SSD – 512K sequential write with fully random data

With data that is not so easy to compress, the SandForce SF-2281
based SSDs take a big performance hit, whilst the OCZ Vector 150 returns an extremely
impressive 525.52 MB/s, and finishes this test in fourth place.
IOMeter 512KB sequential read test QD1.
This test measures 512k sequential reading performance at
very low queue depths.

OCZ Vector 150 240GB SSD – 512K sequential reading test (QD 1)

The OCZ Vector 150 240GB SSD has excellent sequential
reading performance at very low queue depths, finishing this test in eight
place, and is only marginally slower than the fastest SSD in this test.
IOMeter 512KB sequential read test (dual threaded).
This test measures 512k sequential reading performance QD2.

OCZ Vector 150 240GB SSD – 512K sequential reading test (QD 2)

At a more realistic queue depth the OCZ Vector 150 240GB is still
showing excellent sequential reading performance, and finishes this test in
third place.
512K sequential read - Queue depth profile
While most sequential reads will rarely rise above a queue
depth of two, it has been noted from SATA analyzer traces that with more
demanding tasks, queue depths can rise very close to a queue depth of four.
This is why I now include queue depth profiles for sequential read and write.
Please note that in the following graph, I do not have the
lowest possible score set at zero. This is purely to allow the graphs to be
easier to read, but starting with a lowest possible score other than zero,
gives the impression that there are large differences between competing SSDs with
regard to performance, so please keep this in mind.

512K sequential read - Queue depth profile
Below I present a table of the results in greater detail.

The OCZ Vector 150 reaches maximum sequential reading performance
at a queue depth of four, where it achieves an outstanding 556.34 MB/s.
IOMeter Workstation simulation (outstanding I/Os = 64).
When running applications you will find that there is a
mixture of small random files and larger sequential files, being created and
read. Not only that, it isn’t just one file at a time. In this test I measure a
simulated workstation pattern, with a queue depth of 64 (threaded).

OCZ Vector 150 240GB SSD – Workstation simulation

The Indilinx BareFoot 3 has mighty good mixed read/write
performance, and this can clearly be seen in the IOMeter Workstation
simulation, where the Vector 150 reaches a very impressive 454.25 MB/s.
Summary
All in all, the OCZ Vector 150 240GB SSD has performed
extremely well in our IOMeter tests, and demonstrates that the Indilinx
BareFoot 3 is a very powerful SSD controller.
Now let’s head to the next page where we will look at how
the OCZ Vector 150 series SSD performs using a new benchmarking application....
Anvil’s Storage Utilities
As well as performing SSD endurance tests. Anvil’s Storage
Utilities has a very nice SSD benchmarking application. The SSD benchmark tests
many different aspects of SSD performance, including 4K random at different
queue depths, and also sequential performance, but more importantly than this,
all using real test data.
Another very nice feature of Anvil’s SSD benchmark is the
fact that you can change the compression levels of the test data. The
compression levels of the datasets used for the tests can be varied from 0%
compression right up to 100% compressed data, and there are even a few data
profiles already included, such as database (8%) compression, and also an
application profile (46%) compression, which is designed to simulate real
application data being read and written to the SSD.
Anvil’s Storage Utilities is still in beta at the moment,
but the application is currently solid enough to use in this article, and I have
already verified the results obtained using an SATA analyser.
I will include a screenshot of the review drive, and all
comparison results will be presented in the form of graphs. If you would like
to see screenshots of the test results obtained on the other SSDs in this
article, you can do so by following the link here.
I will also be testing three different compression profiles,
which are as follows.
- 0 fill (100% compressible data)
- Application simulation profile (46% compressed)
- 100% (incompressible data)
So let’s begin the tests.
0 fill

OCZ Vector 150 240GB SSD (0 fill)

In the 0 fill test, the OCZ Vector 150 has performed
extremely well and finishes this test in sixth place.
Application profile

OCZ Vector 150 240GB SSD (application profile)

The application test pattern is much more realistic in terms
of the type of data that real users will employ, and once again the OCZ Vector
150 finishes in sixth place.
100% incompressible

OCZ Vector 150 240GB SSD (100% incompressible)

With test data that can't be compressed at all, the OCZ
Vector 150 is still performing extremely well, and finishes this test in sixth
place.
Summary
One should keep in mind that although Anvil’s Storage
Utilities SSD benchmark is a very good benchmark, and tests many aspects of SSD
performance, ultimately it is demonstrating which SSD is technically the
fastest, and this may not be showing (for example) which drive will be fastest
in the real world with a home user's work pattern.
The OCZ Vector 150 240GB SSD has however performed very well
in Anvil's SSD benchmark tests.
Now let's head to the next page for some real world tests....
It has become clear that simply conducting endless
benchmarks on SSD drives is pointless. Real users may run a few benchmarks when
they first fit their SSD drive, but most users just want a drive that performs
well in the real world. They want their drive to work "out of the
box" and run fast and smoothly.
Most of the latest SSD drives can deliver very fast
sustained reading and writing speeds, but these alone tell you very little
about how the drive will perform in the real world.
If you intend to use your SSD as your primary system drive,
with an operating system and applications installed and running from the drive,
real world performance becomes much more important than just fast sequential
read and write speeds.
Real world copy
tests
I will now conduct a few real world copy tests. These tests
simulate what real people do with their drives. I will be conducting writing
tests, using a large single file, and I will then round off the tests by
copying a folder of MP3 audio files, and also a folder of JPG pictures.
In past reviews I simply used Windows copy and paste to copy
the files from one drive to the target drive, and then I measured the time
taken to complete the test with a stop watch. This method was flawed in a
couple of ways. Windows employs a cache, so even when the files had been
copied, some of the data was still in the Windows cache and hadn't yet been
written to the SSD. The other flaw was that a stop watch is not a very accurate
way of measuring the time taken to complete the test.
I had also noticed that copying the small file set had
become pointless, as most modern SSDs have a rather large cache, in fact large
enough to be able to take the complete file set in this cache without having to
commit that data to NAND before the test had completed. I could have increased
the amount of data in the test, but I felt this was moving away from the real
world. For example, who would copy 2GB of data containing only very small
files?
I concluded it was perhaps better just to drop this test
completely, and just focus on the large 8GB ISO file, the folder of MP3 audio
files, and the folder of JPG picture files. I also have taken the opportunity
to increase the amount of data to be copied in the MP3 and JPG tests, to make
sure the SSD's memory cache doesn't obtain an unfair advantage.
The other change is that I now use an application to copy
the data, which also times how long it takes to complete the test. This
application also supports "cache write-through". What this basically
means is, there is now no caching of the files, and instead the data being
copied must be committed to the target SSD as it's being copied.
Obviously making such changes to the methods of testing is
not taken lightly. To make changes means a lot of extra work, as all the
comparison drives have to be re-tested with the new method. However, here at
Myce.wiki, we believe we should always try to improve our reviews, and if that
means updating the testing methods and some initial extra work, then that benefits
the Myce community as a whole.
For the reading drive, I had to make sure that it was fast
enough not to be holding back the target drive. For the reading drive I have therefore
chosen the OCZ RevoDrive X2 PCIe SSD as the OCZ RevoDrive X2 is capable of
reading speeds of 740MB/s, and also sits on the low latency PCIe x16 system
bus.
For the tests themselves, I will show a screenshot of the
copy test for the SSD that I'm reviewing. All other results will be presented
in the form of a graph, so you can easily compare the results.
Single large file writing test (8144.6MB)
For this test I used a single DVD9 ISO file which had been
copied to the OCZ RevoDrive X2 240GB SSD. The file was then copied to the OCZ
Vector 150 SSD and our comparison drives.

OCZ Vector 150 240GB SSD

The OCZ Vector 150 has outstanding sequential writing
performance, so it's no surprise to see Vector 150 doing extremely well in this
test, where it finishes in second place.
Write a folder of JPG picture files.
For this test I copied a folder of JPG picture files from the
OCZ RevoDrive X2 SSD to the OCZ Vector 150 series 240GB SSD, and our other
comparison drives. The folder contained 7861 JPG pictures, with a total
capacity of 8410.3MB.

OCZ Vector 150 240GB SSD

This time the OCZ Vector 150 240GB finishes in the middle of
the pack.
Write a folder of MP3 audio files.
For this test I copied a folder of MP3 audio files from our
OCZ RevoDrive X2 SSD to the OCZ Vector 150 series SSD and our other comparison drives.
The folder contained 1691 MP3 audio files, with a total capacity of 9176.5MB.

OCZ Vector 150 240GB SSD

Once again the Vector 150 240GB is very impressive,
finishing in fourth spot in this test.
Single drive copy tests
These tests are to simulate a single drive in a PC or
laptop. In other words, I will copy a series of files from one folder on the
tested drive to another folder on the same drive. This means the drive is simultaneously
reading and writing during the tests. I also want to make this a realistic test,
so I have used a folder of MP3 music files, and then repeated the test with a
folder of JPG picture files.
Single drive copy tests – 1,691 MP3 song files (9176.5MB total)

OCZ Vector 150 240GB SSD

With this test the SSD has to read and write data, and we
already know that the OCZ Vector 150 has excellent reading and writing performance,
which allows the Vector 150 240GB to finish in third spot.
Single drive copy tests – 7,861 JPEG picture files (8410.3MB total)

OCZ Vector 150 240GB SSD

The OCZ Vector 150 240GB SSD finishes in sixth place in this
test.
Summary
The OCZ Vector 150 240GB has performed extremely well in the
copy tests. Its excellent reading and writing performance ensured it was always
near the top of the table in these copy tests.
Installing applications
Installing applications is possibly something you don't do
that often. But should you replace your system disk, then you will most likely
have to re-install your applications. Most of the SSD drives I have tested up
until now are quite slow at installing applications, most likely because their
I/O performance was quite limited.
For these tests, we picked some popular applications and
copied the entire contents of the CD or DVD media to an OCZ RevoDrive x2 240GB
SSD. We did this to make sure that the reading speed of our CD/DVD reader would
not hamper the performance of the target drive.
We then installed these applications onto our comparison drives,
which were all running mirror image installations of our Windows 8 Professional
64-bit installation, and timed the amount of time taken to install the
application with a stopwatch on each of the drives.
MS Office 2007 Professional (full install)
MS Office is one of those applications that make you cringe
at the thought of re-installing it.
Let's find out how our drives coped with the MS Office 2007
full install.

The OCZ Vector 150 showed an excellent turn of speed when
installing this large office suite, and finished the test in joint second place.
Adobe Fireworks CS3
Adobe Fireworks CS3 is another popular package. Let's find
out how our drives coped with installing this application.

There isn’t a huge margin in the amount of time taken to
install this application on our modern SSDs. However, the OCZ Vector 150 240GB
SSD finishes this test in joint first place.
Summary
Our real world tests, though not scientific in nature, I
feel are more realistic than simply running benchmarks. What is clear from these
tests is that the OCZ Vector 150 240GB SSD has excellent performance in the
real world.
Let’s check out application and game loading performance
on the next page of this article.....
These tests are very simple tests, but very important to
some users of SSD drives.
We simply started an application or game, and measured the
time taken for the application or game to fully load and start.
Application loading times
Adobe Fireworks CS3

These types of tests are becoming pretty pointless, as there
is so little difference in tangible performance between the modern SSDs.
However, the OCZ Vector 150 240GB SSD loads this large application in 3.39
seconds, and finishes the test in fourth place.
Corel PaintShop Pro 12

Again, I doubt anyone could tell difference from the fastest
to the slowest modern SATA 6Gbps SSD, as they are all very close.
Games loading times
FAR CRY 2

The OCZ Vector 150 posts the fastest time, along with five
other SSDs.
F.E.A.R. 2

The OCZ Vector 150 240GB SSD posts the third fastest time,
but is only a couple of milliseconds behind the fastest SSD in this test.
Summary
By now it's is becoming very clear that the OCZ Vector 150 240GB
SSD delivers excellent performance, and its excellent reading capabilities have
ensured that it's one of the fastest SSDs in these tests.
Now let's head to the next page where we will see how the
OCZ Vector 150 performs in PC Mark 8.....
PC Mark 8 - HDD Suite
Here at Myce.wiki, we only recently introduced PCMark Vantage
into our SSD testing. PCMark Vantage is a good test, but is now somewhat
outdated in the applications that it tests, even to the extent of including a
test trace on how Windows Vista booted. We could have course have opted for the
newer PCMark 7, but I personally had issues with the way it ran the HDD tests.
We have built quite a close relationship with FutureMark
software, the authors of the PCMark PC benchmarking software that we use in our
tests. I decided I would use PCMark Vantage as stopgap measure until the more
up-to-date PCMark 8 benchmarking suite became available. I'm pleased to say
that PCMark 8 is now available, and it gives me great pleasure to introduce you
all to the results obtained by this new 'real world' benchmarking suite.
I will describe the basic way that each test is carried out,
above the graph for each test.
PC Mark 8 HDD suite results

OCZ Vector 150 240GB
Now let’s look at the individual PC Mark 8 HDD suite scores,
in the form of tables and graphs.
PC Mark 8 HDD suite: World of Warcraft


The first thing that is very noticeable is that all the
tested SSDs are remarkably close performance wise when loading this game.
PC Mark 8 HDD suite: Battlefield 3


Once again, the results are very close between all the
competing SSDs.
PC Mark 8 HDD suite: Adobe Photoshop light


Yet again the results are all very close together, with the higher
writing performance SSDs out in front.
PC Mark 8 HDD suite: Adobe Photoshop heavy


Again, there isn't a large difference between any of the
competing SSDs, and the SSDs with the higher sustainable writing performance are
generally out in front.
PC Mark 8 HDD suite: Adobe InDesign


Once again, the SSDs with the higher writing performance
head the table.
PC Mark 8 HDD suite: Adobe After Effects


There is virtually no difference between the tested SSDs.
PC Mark 8 HDD suite: Adobe Illustrator


Once again, there is hardly any difference between the
tested SSDs.
PC Mark 8 HDD suite: Microsoft Word


With only 0.2 seconds between the fastest and the slowest
SSD in this test, I would doubt anyone could tell the difference.
PC Mark 8 HDD suite: Microsoft Excel


There is only 0.2 seconds between the slowest and the
fastest SSD in this test.
PC Mark 8 HDD suite: Microsoft PowerPoint


Once again, the results obtained from our test SSDs are
almost identical.
PC Mark 8 HDD suite: Overall Score
PC Mark 8 sums all the individual times taken to run each
storage benchmark, then comes up with an overall score for each of the tested
SSDs.

As we can see from the above graph, there isn't a large difference
between any of the tested SSDs, but the OCZ Vector 150 240GB SSD is the fourth
fastest SSD in these tests.
Summary
You may well ask, if the scores are so close between the
tested SSDs, then what is the point of running PC Mark 8 storage benchmark?
Basically, most of these individual tests are very low
demand as far as storage is concerned. More or less all the traces are
lightweight. But hang on a minute, this is how real applications work, and I
and many other reviewers have been saying for years that when we have
lightweight storage traces, it becomes almost impossible to tell SSDs apart
from a performance perspective. We now have a tool that can demonstrate this to
very good effect.
It's not until we start to push SSDs very hard that the
performance differences between SSDs start to become clearer, and for that we
need much heavier workloads, such as the tests run in the Myce Reality Suite.
PC Mark 8 is still very useful, as I'm quite sure that most of you will use at
least a couple of the applications used in these tests, and now you will be
able to compare one SSD to another.
Now let’s round off the performance tests with the Myce
Reality Suite on the next page.....
Myce Reality Suite (storage).
So what is the Myce Reality storage test?
The Myce Reality Suite of tests is made from real everyday
applications and real data, there are no simulated tests, and everything is in
the real world. The only thing that's synthetic is that everything is automated
to make the tests fair, no matter which drive the tests are run on.
Recorded user sessions, by means of a script, are used to
launch the applications, load data, edit data, and then finally write that data
back to the target drive. The scripts do load the system much more than a human
could with these tests, as the scripts do not make mistakes, or pause to think
about what has to be done next.
Measurement system (revision 2)
The measuring system is part hardware and part software. The
hardware is proprietary and under an NDA, but what I can tell you is: The
measuring system can now accommodate SATA2, SATA3, and USB3.
Testing method.
Once all the test data files were complete, they were then
copied to a single folder. I then fitted an old 80GB HDD into the PC and did a
clean install of Windows 7 Home Premium x64. The latest hardware drivers were
installed and Windows update was run to install any new updates that were
available up to 08/01/2012. At this point the applications that were to be used
in the tests were installed and updated with the latest patches.
The folder containing the application test data files was
then copied over to our fresh Windows 7 HDD. The drive was cleaned up and then
the four test scenarios were recorded, with the scenario playback data file
which will run each test scenario saved to the desktop. A drive snapshot was
then taken of the complete HDD and the drive snapshot image copied to a second
HDD for safe keeping.
The image is then simply restored to each of the SSDs on
test. After imaging the drive the partition is then realigned “on the fly” and the
free space is filled and then deleted to force TRIM. A 20 minute settling time
is allowed before the tests are run, then each of the 4 tests is run and the
results gathered. This process is repeated for each of the drives I am testing.
The test scenarios are as follows.
- Graphics content
- Video editing
- Audio import and compression
- Application multitasking
Let’s begin the tests.
Myce Reality Suite – Graphics content.
Using ACDSee Pro 3, 100 JPG pictures with an average size of
10MB are imported into the ACDSee library, and then 12 of these JPG files are
then selected for a batch process, of resize, compress the quality to 80%, and
finally write the edited pictures back to the drive. The test is approximately
78% read and 22% write, with an average queue depth of 1.98.

The OCZ Vector 150 240GB performs extremely well in this
test, and finishes in second place.
Myce Reality Suite – Video editing.
Using Vegas Pro, a 14GB HD MPEG2 video stream is loaded into
the editor, from which 2 segments are then cut and pasted into new segments. There
is a lot of disc caching going on in this test, which is approximately 55% read
and 45% write, with an average queue depth of 1.89.

Once again the OCZ Vector 150 takes second spot.
Myce Reality Suite – Audio import and compression.
Using Sony Sound Forge 10, a batch process is run consisting
of importing 30 24bit (192000 Hz sample rate) .wav files, and 100 16bit (44100
Hz sample rate) .wav files which are converted to MP3 audio files with a bit rate
of 128kbps, and the MP3s are then written back to the drive. The test is
approximately 72% read and 28% write, with an average queue depth of 2.62.

The OCZ Vector 150 240GB SSD finishes this test in third
place.
Myce Reality Suite – Application multitasking.
For this test I used several popular applications, Microsoft
Word 2007, Microsoft Access 2007, Microsoft Excel 2007, Microsoft Outlook 2007,
Adobe reader, Adobe Photoshop CS3, uTorrent, Windows media player, and Internet
Explorer 9.
This session runs for approximately 12 minutes. The test is
started by downloading a Linux distribution via uTorrent, Windows media player
is then opened, and a 1080p video file is opened and played for the duration of
the test. Microsoft Outlook is opened and any new emails are received, read,
then replied too, a document in Adobe reader is opened and scrolled from start
to finish, 3 Microsoft Word documents with graphics content are opened, browsed
and some sections of the documents are copied and pasted into a forth document
and then saved back to the drive. The same applies to Microsoft Access and
Excel. 100 MP3 files are imported into Windows media library. Six JPG images
are loaded into Adobe Photoshop and some minor editing is done and the files
saved back to the drive.
Finally, Internet Explorer 9 is opened with 10 tabs, and the
contents of the 10 tabs refreshed, and browsed while the other applications are
busy in the background.
I would describe the multitasking pattern as moderate to
heavy.
During this test there is approximately 85% reading and 15%
writing, with an average queue depth of 6.73.

With higher queue depths, in this test the OCZ Vector 150 240GB
SSD is able to show what it can really do when pushed hard, and performs well,
finishing the test in second spot.
Summary
I firmly believe that the Myce Reality Suite gives a very
good overall picture of how a drive can perform in the real world, and in this
case, the OCZ Vector 150 240GB SSD is clearly a very capable performer.
Now let’s head to the next page, and see how well the
drive performs after heavy use....
Speed degradation after heavy testing
On this page I will test how the SSD performs after heavy
testing and usage, and also how the SSDs perform when the amount of data stored
on the SSD increases.
I now have a new policy as to how I go about testing an SSD.
In the past I would deliberately try and get an SSD into a “used state”, by
filling the drive several times before starting the tests. This seemed to work
quite well up until the SandForce based SSDs appeared, but because of the way
the SandForce controller works, it was near impossible to tell if deliberately
trying to get a SandForce based SSD into a “used state” had actually worked or
not.
A new strategy was required. So now I begin the tests with
the SSD in a clean state and allow it to look after itself during the testing
period. I start off the tests by running AS SSD benchmark. This gives me the
“as new” reading and writing performance of the SSD.
Once all the tests have been completed, the drive is then
tested as a system drive, and just used normally for many days which will also
includes idle time (this is something I have always done with a review sample).
At the end of the period, the drive is filled to capacity and then all files
are deleted from the drive and then a “quick format” is performed.
The last test is a rerun of AS SSD benchmark, and the result
from the final test is compared with the first run when the SSD was in an “as
new” state.
Let's find out what happens.
New state 01/11/2013

Used state 04/11/2013
With 3.27 Terabytes of data already written to the drive
during a testing period of just four days, one would have expected the
performance to have dropped off slightly, but there isn't really a lot of
evidence to suggest this is the case. The overall score has gone down slightly,
but the sequential reading and writing speeds have actually increased.
Filling up the SSD with data
For obvious reasons, when an SSD is tested, the drive is
always tested as a spare drive, and is generally always empty (no data on the
drive) during the synthetic benchmarks. There is no other way of having a level
playing field for all the SSDs under test. This of course changes during the
real world tests we conduct here at Myce.wiki.
Real users of course don't buy an SSD for it to remain
empty, and how full the SSD will eventually become varies from one user to the
next. What I thought would be useful is to run tests on the SSDs with real data
on the drives, and at different levels regarding how full the drive is.
For these tests the SSD is connected as a spare, and I test
at three different levels.
- Level 1: There an operating system installed on the
SSD, and all the applications that I use are also installed. In my case that
amounts to approximately 44GB of data on the SSD. - Level 2: The SSD is filled to 60% of its formatted
capacity. - Level 3: The SSD is filled to 80% of its formatted
capacity.
For the 60% and 80% tests, the type of data varies from
compressible to incompressible data, and file sizes range from a few Kilobytes
to very large files of several Gigabytes, then a single run of Anvil's SSD
Benchmark is run (100% incompressible).
It is also worth noting that the larger capacity SSDs will
tend to slow down less than their smaller counterparts, as the larger SSDs will
have more free NAND available to work with, and this is only a quick burst test
that all members will be able to run for themselves. The real test is the Myce
Sustained Performance test, which you can find a little further down the page.
In the graph below, I present the results.

Filling up an SSD with data can certainly cause a slowdown
to occur on some SSDs. However, filling up the OCZ Vector 150 240GB SSD with
data had no real affect on the performance. Of course this is just a quick
burst test.
Myce Sustainable Performance Test
Over the last few months I have been studying countless
analyzer traces of real computing workloads, and also developing a test that
would accurately emulate and measure how performance is sustained over a period
of time. For obvious reasons, it is not possible to test an SSD review sample
over several months before publishing a review. The solution was to condense
this down to a manageable test, that doesn't take too long to run.
I will make it clear right from the outset that this is not
a torture test. Bringing any SSD to its knees is not helpful in the least, as I
for one would not use any SSD that had slowed down to crawl, just to prove a
point. The Myce Sustainable Performance test, I believe is a tough, but
sensible test pattern to use for measuring how an SSD will be behave once it's pushed
hard over a period of time.
The test pattern is "workstation" based, and
closely emulates a typical video or graphics workstation environment. The
results are measured using the same hardware I use for the Myce Reality Suite
tests, however, the test data and measuring system use a different method.
From the 80% full test listed above, I already have an SSD
with a lot of data on it. Adding to the data that is already there, the
"Sustainable Performance" test data is added. This test data is
approximately 20GB is size, so once this is added the SSD is pretty full.
The test is then run for a period of 20 minutes. 60
performance measurements are taken for every minute of the test, and an average
performance figure is generated after each minute. At the end of the test I
have 20 performance measurements which are then used to generate the graph
below.
The faster SSDs will obviously sustain more writes then the
slower SSDs. For the fastest SSD in this test, the test pattern generated 146GB
of writes, and 193GB of data was read from the SSD during the test.
When reading the graph, you should not pay too much
attention to which drive is the fastest, but instead look at the sustainable
performance curve of each SSD, as this is what this test is all about.
For the SSD that I am reviewing, I will also add a second
graph which looks at the result in more detail.
So let's look at the results.

Sustainable Performance test

Detailed results for the review drive
We knew from the previous Anvil's SSD benchmark tests that
the OCZ Vector 150 240GB SSD could maintain performance very well in a short
burst test, when it was pretty full of data. The Myce Sustained performance
test is a much tougher challenge for any SSD. The test pattern used for the
test is workstation based, and from the IOMeter workstation test run, we already
know that the OCZ Vector 150 240GB SSD is an outstanding performer in a simulated
workstation environment.
What this test does show, is that the OCZ Vector 150 has no
problem maintaining performance even when pretty full of data, and when it's subjected
to a heavy workload. There is little doubt in my mind that the 16GB of NAND
over-provisioning, pays handsome dividends with regard to an SSD being able to
maintain high reading and writing speeds, while being pushed very hard, even
when it's nearly full of data.
This concludes our review. To read the final thoughts and
conclusion, click the link below....
Final thoughts and the conclusion
User experience
A modern operating system such as Windows 8 rarely does one
thing at time; it processes hundreds of threads at once. Just take a look at
the processes and services that are running in task manager for an idea of how
much is going on, even with the PC idling at the desktop. When you start
running applications on top of this, the workload increases in line with the number
and type of applications you are running. It’s also fair to say that many of
these processes are already loaded into system RAM, but many are also loaded into
and unloaded from RAM to the system drive as and when they are required.
If we look at the 4 basic requirements for a really fast
SSD, they are as follows.
- Small file threaded performance needs to be high.
- Small random file performance needs to be high.
- Sequential read and write speeds need to be high.
- Fast access times.
The OCZ Vector 150 series SSD has all of these attributes in
abundance, and feels very snappy in use as a system drive.
Stability
I have only had the OCZ Vector 150 series SSD for a few days,
so it’s not possible to comment on the drive's long term reliability. What I
can say is that during the testing period, the OCZ Vector 150 240GB has been
100% stable, and has caused no problems whatsoever.
The OCZ Vector 150 series is as “plug n play” as it gets.
There are no special tweaks needed other than simply making sure that AHCI SATA
mode is enabled in the system UEFI (BIOS), and installing the latest Intel RST
SATA drivers, if you want to get the best performance and compatibility out of
this SSD.
Conclusion:
Let us summarise the most important positive and negative
points below:
Positive:
- Silky smooth operation as a system drive.
- Excellent sequential reading and writing performance, even
at very low queue depths. - Outstanding performance in a workstation environment.
- Outstanding sustainable performance curve.
- Excellent 4K random writing performance at low and high queue
depths. - TRIM support under Windows 7 and Windows 8.
- Completely silent operation.
- Fast operating system start-up and shutdown times.
- Limited 5 year warranty (50GB of data writes per day).
- Competitively priced.
- Excellent software bundle.
Negative:
- Nothing to mention.
To sum up, this is what I
would say:
As a system drive with the operating system and applications
running from the OCZ Vector 150 240GB, this SSD is impossible to fault. Its
excellent reading performance ensures that applications launch very quickly, and
writing performance is comprehensively outstanding.
The Indilinx BareFoot 3 controller is a strong performer, and
the performance profile of this SSD is geared towards computer enthusiasts, who
demand more from all the components in their system.
Whilst the downsizing in node size with regard to the NAND
has meant that improving performance over the original OCZ Vector was going to
prove to be an almost impossible task, OCZ has taken a slightly different
approach with the Vector 150. Instead of trying to improve upon the original
Vector performance, they have instead focused on sustainable performance,
durability, and adding AES-256 encryption.
So where does this place the OCZ Vector 150 240GB SSD?
The OCZ Vector 150 240GB joins the top flight of performers,
being as fast in the 'real world' as the original Vector series, and the
Samsung EVO. However, the OCZ Vector 150 is now the new king of endurance and
sustainable performance.
Price
The OCZ Vector 150 will be available soon, and is expected
to be priced similarly to the original Vector series SSD, with a suggested MSRP
of $239.99.
The parting sentence is:-
“The OCZ Vector 150 240GB is an outstanding SSD,
competitively priced, and during the testing period proved to be very stable”.
Rating system
The editor rating is based on the following key factors.
- Performance
- Stability (is the device stable?)
- Price
- Warranty
- Supplied accessories (what is included in the package)


Thanks to:
|
|
EFD Software for |
|
|
Alex |
|
|
|
|
|
FutureMark for |


You may comment on this review below.


")


