 |
Review: OCZ Vertex 3 |
OCZ Technology was kind enough to send me a retail version
of the Vertex 3 240GB SSD for review. The OCZ Vertex 3 is a native SATA 6Gbps
solution and sports the brand new SandForce SF-2281 SSD processor coupled with
25nm MLC NAND manufactured by Micron.
Back in March I previewed the Vertex 3 when the Vertex 3 was
at that stage an engineering sample. In this article I will run the full range
of tests on the retail version of Vertex 3, and we will see how this new SSD
performs in our range of tests.
SandForce came from nowhere last year and took the SSD
market by storm with their SF-1200 series SSD processor. In a single swoop they
managed to saturate SATA 3Gbps, and not only that, the SF-1200 series had
mighty impressive small random file writing performance, excellent durability,
and is still present in the review PC as I write this article. The question
that most of you will want answered now is, can the Vertex 3 and its SandForce
SF-2281 SSD processor surpass what is already an extremely high performance bar
set by the Vertex 2?
OCZ company information
I’m sure most MyCE members will be familiar with the OCZ
brand name. OCZ Technology has been manufacturing high performance, high
quality PC memory, PSU units, SSDs, and other PC related hardware for many
years.
If you would like to find out more about OCZ Technology, you
can visit the OCZ website.
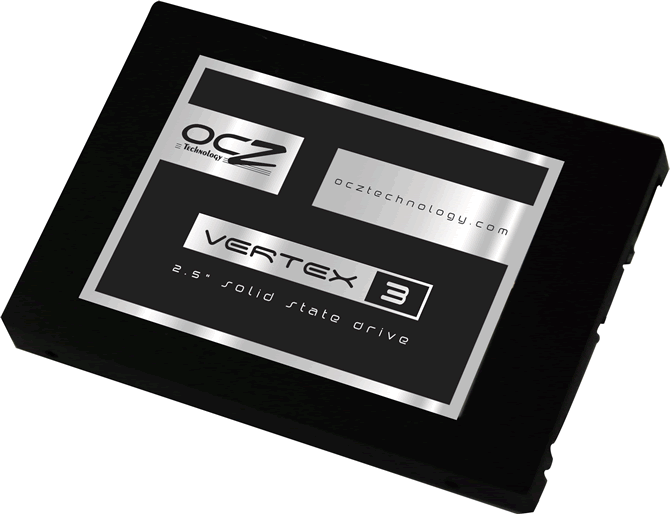
The OCZ Vertex 3 240GB SSD
Now it’s time to take a look at the drive itself and what
the drive came shipped with.
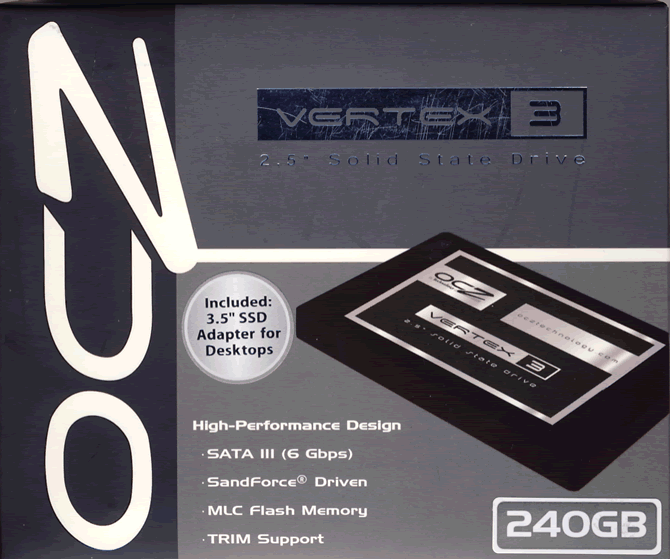
Box front
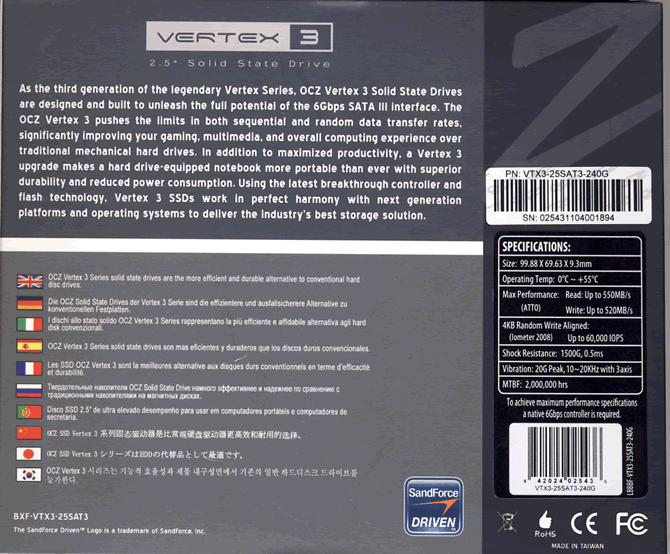
Box rear
The package contained the OCZ Vertex 3 240GB SSD itself,
which has a user capacity of 223GB under Windows 7.
The package also contained a 2.5 inch to 3.5 conversion
bracket with fixing screws, to allow the Vertex 3 to be housed in standard 3.5
inch HDD bay.
Now let's head to the next page, where we look in more
detail at the OCZ Vertex 3.
OCZ Vertex 3 hardware.
Now let’s take a look at the OCZ Vertex 3 hardware.
PCB

Near the centre of the above screenshot we can see the
SandForce SF-2281 SSD processor, and we can also see 8 25nm MLC NAND chips
manufactured by Micron, the other side of the PCB being populated by a further
8 NAND chips.
The SandForce SSD processor

The SSD processor used in the Vertex 3 is the brand new SandForce
SF-2281.
The SF-2281 is the high performance “enthusiast” client SSD
processor in the SF-2000 family. There is also a mainstream/budget SSD
processor, the SF-2100 series, and the upmarket high performance and endurance
2500/2600 series for the enterprise and industrial markets.
When the SandForce SF-1200 series SSD processor arrived last
year which was used in the Vertex 2, it brought a number of new technologies to
SSD, some designed to increase performance, others designed to improve durability
and increase the lifespan of the SSD.
Key changes from the SandForce SF-1200 family to the SF-2200 family of SSD
processors.

The new SandForce SF-2281 SSD processor builds on the
original design and has many improvements over the original SF-1200 series. The
SF-2281 still has 8 channels, but there are 16 byte data lanes to the NAND
array, and of course the SF-2281 communicates with the outside world using a
new SATA 6Gbps host controller. Other key changes include enhanced error
correction, enhanced NAND support, and enhanced security features.
Let’s take a brief look at a few of these technologies.

SandForce SF-2281 block diagram
What we can see is the new 55b BCH ECC error correction
engine, and a few other changes over the older SF-1200 series of SSD
processors, the most notable being a switch to a SATA 6Gbps host controller,
and support for toggle and ONFI 2 NAND. As NAND becomes forever smaller in its
fabrication process, more robust and faster error correction is required.
From the above screenshot we can see at least 2 unique
technologies that SandForce are using on this new SSD processor under a
technology they call DuraClass.
Let’s first take a brief look at NAND.
NAND
There are two fundamental things that cannot be ignored when
using flash memory for storage. That is, the flash memory type currently used
is NAND, which is (a) expensive and (b) has a limited amount of total write
cycles. I’m pretty sure that all SSD manufacturers would love to only use SLC
(single level cell) NAND on their SSDs: it’s faster and has approximately 10x
the total write cycles of multi-level cell (MLC) NAND. Unfortunately though,
the cost of SLC is enormous, and this is the main reason that SLC is generally
reserved for high end enterprise class SSDs.

It’s easy to see the good points of using commodity NAND,
it’s cheaper so costs can be kept down, with each new fabrication process the
cost is further reduced, and the NAND dies themselves can carry more capacity
and they can be faster.
The downside of using commodity NAND is endurance, and as
new fabrication processes shrink the die, endurance can become much more of a
problem.

If we look at the above screen shot, it is very obvious why
it is so desirable to use commodity NAND. We all want reliable SSDs, but we
must be able to afford to purchase them in the first place.
The NAND on our OCZ Vertex 3 was fitted with 16 high
bandwidth ONFI 2 MLC NAND chips manufactured by Micron using a 25nm fabrication
process.

DuraWrite
If we look at the OCZ Vertex 3, it uses MLC NAND, and on the
240GB model it uses sixteen MLC NAND chips to give the total user capacity. The
actual amount of NAND amounts to 256GB, but we will look at why only 240GB is
available for user storage a little later. Had the OCZ Vertex 3 used SLC NAND
of the same density, thirty-two NAND chips would have been required to have the
same 240GB capacity. The reason for this is that SLC can store a single bit of
data per NAND cell, while SSD grade MLC can store 2 bits of data per cell. In
other words, SSD grade MLC NAND can store twice the amount of data compared to
SLC NAND, and this in turn means the cost of MLC NAND is much less than half
the price of SLC NAND, and also the main reason why SLC NAND based SSDs are
generally lower capacity drives.
The other fundamental is MLC NAND is less durable compared
to SLC NAND. SLC NAND is reckoned to have 100,000 total write cycles, whereas 25nm
MLC NAND has a typical 3,500 to 5,000 total write cycles. The curse of NAND is
write amplification: put simply, this means that the more data that has to be
written, the faster those write cycles are used up. SandForce has looked at
write amplification in great detail, and come up with a new technology called
DuraWrite. The SandForce SSD processor is smart enough and fast enough to
compress data on the fly, and then write a compressed version of the data to
the NAND itself. By doing this, some writes can be 20 times smaller than they
would be if they remained uncompressed. This also has an added bonus, if you
have to write less of the data to NAND, then the write process also becomes
much faster.

So, as well as lowering write amplification you also
increase performance, which is very clever, allowing the much cheaper MLC NAND
to be used in an enterprise class environment. Of course, not all data can be
compressed in this fashion, ZIP, RAR, and MPEG files for example are already
heavily compressed so won’t benefit so much by this process, but overall
DuraWrite works extremely well as we will see later on in this article.
RAISE
Another technology found in the SandForce SF-2281 is RAISE (Redundant
Array of Independent Silicon Elements).

As I mentioned earlier, our OCZ Vertex 3 SSD review sample
has a user capacity of 240GB. The actual amount of NAND that the drive has is 256GB
of MLC NAND. So what is the other 16GB used for?
At some point during an SSD’s life a NAND cell or block of
NAND cells will fail, which is why all SSDs do not make the full amount of
onboard NAND available to the user for storage. All SSDs have a pool of
reserved NAND to map into use if a cell or block of cells fails. This can be as
low as 1GB or 2GB of NAND in reserve. RAISE sets aside a good deal more than
this in its pool of reserved NAND. In the case of the OCZ Vertex 3 240GB, the
amount of reserved NAND is approximately 16GB. By keeping so much NAND in
reserve, this should ensure the SSD can last for the expected minimum lifespan
of 5 years.

The RAISE area is where all your immediate writes to the SSD
end up in the short term. The RAISE area should always have fresh and clean
NAND to work with, providing you are not hammering the drive. Under normal
operation the 16GB of NAND should have enough clean NAND to make sure that
performance doesn’t take a hit. During idle time, the RAISE area is recycled,
and all writes in this area are committed to the normal NAND array.
Also, in combination with DuraWrite and RAISE, the SandForce
SF-2281 will monitor the amount of writes in a given time frame that the NAND
has to endure. If the writes are dangerously high in a small time frame, then
the SF-2281 is able to throttle down the SSD processor, slowing it down to
preserve durability. The same technique is also used to return the drive back
to full speed (see the section on TRIM for more details).
New to the SF-2xxx family, is the fact that RAISE can
actually be switched off, and this could come in handy to allow more of the
available NAND to be used for the user storage area.
Security features

As we can see from the above screen shot, the security and
encryption features are quite complex and beyond the scope of this article, and
I’m certainly not qualified to write any in depth material about the advanced
security technologies used on the Vertex 3.
Basically what happens is, data that is written to the Vertex
3 is encrypted on the fly, or to put it simply, any would be data thief is not
going to able to get hold of your private data.
OCZ Vertex 3 Specifications

Drive maintenance features
For Windows 7 users and some distributions of Linux, the OCZ
Vertex 3 supports ATA TRIM to keep the NAND clean. The Vertex 3 also has, as I
touched on above, DuraClass. The new technologies involved in DuraClass should
keep the OCZ Vertex 3 operating at peak performance levels under normal usage
patterns.
TRIM commands are acted upon on SandForce based SSD
processors in a totally different way to normal SSD controllers. To keep write
amplification low, when you delete data from the SSD these blocks are then
marked as discarded by TRIM in the normal way, but the NAND blocks are only
actually cleaned by DuraClass as and when they are required, and this will
normally only take place when NAND is gathered into the RAISE area of the NAND
array. I should stress that under normal operation of the SSD, this is
transparent to the user, and you will never be aware of this taking place at
all.
However, if you hammer the drives with benchmarks, for
example, you may notice the drive being throttled and slowing down slightly. At
least this was the case with the Vertex 2, I will find out in due course if
this is still the case with Vertex 3.
The OCZ Vertex 3 can also be “secure erased”, which will
return all NAND on the SSD to its factory default clean state. You can do this
via the DOS application “HDDErase” or as I prefer by using a Linux “live”
distribution called Parted Magic.
Test machine
For this review I will be using a computer with the
following configuration:
Hardware:
- Motherboard: AsRock Z68 Extreme 4 (Intel Z68 chipset)
- Processor: Intel 2nd generation Core i7 2600K
- RAM: 8GB G.Skill RipjawX DDR3 1600MHz (dual channel)
- GFX: Onboard Intel HD 3000
- Sound: Onboard Realtek ALC889 HD audio controller
- Hard disk OS: OCZ RevoDrive X2 240GB PCIe
SSD, and Crucial RealSSD C300 128GB - Hard disk storage: 1X 500GB Samsung Spinpoint F3, and 1X 1TB
Samsung Spinpoint F1. - Case: Antec 900
- PSU: Enermax Liberty 620W
- Display: Samsung Syncmaster 245B 24” widescreen LCD (HDCP
compliant) - Operating System: Windows 7 Home Premium 64bit with Service Pack 1
The OCZ Vertex 3 SSD was connected to the SATA 6Gbps (port 0)
on the Z68 motherboard of our review PC and all tests on the drive were carried
out with the drive connected to this port.
AHCI mode was also selected for all drives in the UEFI of
our test PC with “hot plugging” enabled, and all tests were carried out in this
mode.

The SATA 6Gbps drivers used on our review PC were the Intel
Rapid Storage Technology (RST) Version 10.5.0.1027.
The firmware on our review sample for the performance tests
was version 2.06. The firmware was later updated to version 2.09, when the MyCE
reality and stability tests were then carried out.
Test applications
To test the performance of the OCZ Vertex 3 240GB SSD, I
will be using the following test applications in this review.
- HD Tune Pro
- ATTO
- Iometer
- AS SSD
Benchmark - CrystalDiskMark
- MyCE Reality Suite
Test procedures
I will start off our testing procedures explanation by
stating that I did not run many basic benchmarks on the OCZ Vertex 3 series
drive. You may ask why I have run so few synthetic benchmarks?
SSD technology has moved so fast in the last couple of years,
that basic synthetic benchmarks alone are now of very limited use, as they don't
really tell us much about performance and how the drive will behave in the real
world. I have therefore decided to show some basic benchmarks of the OCZ Vertex
3 SSD, and will complement this with advanced benchmarks using IOMeter and AS SSD
benchmark. I will also show how the OCZ Vertex 3 performs in the real world
with our recently introduced MyCE Reality Suite test.
Small file random IOPS vs sequential performance
IOPS
This is a fairly complex subject, but I will do my best to
explain things in a manner that is easy to understand.
The term IOPS is the amount of input or output transactions
that can take place in a one second interval, so for example, if an SSD is
quoted as being able to cope with 20,000 4K random write IOPS, then the SSD
should be able to cope with 20,000 input transactions in a period of one
second. If the same SSD is said to be able to produce 20,000 4K random read
IOPS, then the same SSD should be able to produce 20,000 4K random read output
transactions in a one second interval.
Ok, now we have some figures to work with, the next question
is how many IOPS are actually required?
This will depend on your usage pattern. If you are a typical
desktop user who browses the internet, does some word processing or perhaps
some audio or video editing, and perhaps plays a few games, then in actual
fact, you don’t need to have massive 4K random read/write performance. The
actual amount of 4K random performance that is required for a fast and smooth
running system for a desktop user with a usage pattern similar to the above
will be well under 1,000 4K IOPS.
On the other hand, if the SSD is being used for running a
large and complex database server, then 4K random performance is the absolute
measurement of how fast that server will run, as this type of application does
most of its input and output transactions in the 4K domain.
So why would I need an SSD with 60,000 4K IOPS for a
desktop?
In fact you don’t need this type of performance for a
desktop, but an SSD which is capable of coping with 60,000 4K IOPS will be
faster than an SSD which can only cope with 20,000 4K IOPS.
OK, I just said if under 1,000 4K IOPS are actually required
for typical desktop usage, why is an SSD with 60,000 4K IOPS faster than an SSD
with only 20,000 4K IOPS, confused?
You may ask, if I only require 1,000 4K IOPS surely the rest
is wasted?
While you may never need 60,000 4K IOPS, IOPS is all about
latency. The reason that an SSD can cope with as much as 60,000 4K IOPS is
because latency in this domain is very low. With 4K files, even if you require
to process 500 of them at the same time, you are not talking about a huge
amount of data, it has far more to do with how long it takes the SSD to process
a single file, and the amount of time required to process a single 4K is all
about how long it takes for the SSD to access or store that data before it can
move on to the next transaction.
In other words an SSD with 60,000 4K IOPS performance will
handle those 500 files faster than the SSD with 20,000 IOPS.
So how will a desktop user even notice this faster speed if
so little 4K random IOPS and data are actually used?
Multitasking is a good example. The more tasks you run at
the same time, you more you will notice the speed difference.
Sequential performance
I have always maintained that sequential performance was
every bit as important as small random file performance for a desktop SSD. Some
highly regarded people on other sites found this statement quite funny a couple
of years ago when I made it, but my, how times have changed in the world of SSD
reviewing.
To me this was always so obvious for a desktop user. For
example, let’s say you want to launch an application or game. Both have some
fairly large files to load, and also a great many small files, but the point is,
even the smaller files are sequential in nature. Now let’s say you’re into
audio or video editing. Video files tend to be huge, and the files are written
or read sequentially. Isn’t this how many users are using their PCs these days?
Summary
So how does this shape up in the real world? Which is
better, massive 4K IOPS or massive sequential performance?
In an ideal world you want both, as an SSD with massive
random 4K IOPS and sequential performance will always be faster than an SSD
that has high sequential performance and moderate 4K random IOPS performance,
and the same applies to an SSD that has massive 4K random performance and
moderate sequential performance. The SSD which has high performance in both
patterns will always be the faster SSD.
However, you can still have an SSD that is very fast for
desktop use that has moderate random 4K performance and massive sequential
performance, the same can be said about a drive having massive random 4K
performance and moderate sequential performance, as it is about getting the
balance right if you have to compromise on one or the other.
Test drives
- 120GB OCZ Vertex SSD (firmware 1.5)
- 500GB Samsung SpinPoint F3 (HD502HJ)
- Seagate Momentus XT 500GB (Hybrid drive)
- OCZ Agility 120GB (firmware 1.5)
- Intel X25-M 80GB (series G1)
- OCZ Vertex 2 100GB
- Plextor PX-256M2S SSD
- Crucial RealSSD C300 128GB
- OCZ Vertex 3 240GB
The OCZ Vertex 3 SSD came supplied with firmware version 2.06.
Drive preparation for running the tests
All the SSDs used in this article were in a clean and fresh
state when the testing period started. From then on, each drive had to rely on
its own NAND cleaning effectiveness for the remainder of the tests.
- Both our spinning HDD drives were defragged before the
start of each test.
- All SSD and HDD used in this article had their partitions
aligned to the Windows 7 x64 defaults.
Where I use graphs in this article to display results, I
will use the following colours to make it easier, for our readers to see which drive
we are reviewing.
![]() OCZ Vertex 3 240GB SSD (SATA 3)
OCZ Vertex 3 240GB SSD (SATA 3)
![]() OCZ Vertex 3 240GB SSD (SATA 2)
OCZ Vertex 3 240GB SSD (SATA 2)
![]() Comparison SSD
Comparison SSD
![]() Comparison HDD
Comparison HDD
Now let's head to the next page, where I look at some
basic benchmarks...
Reading Benchmarks
HD Tune Pro

SATA 3

SATA 2
I present the graph below for comparison with other recently
tested drives.

From our limited number of test samples, we can clearly see that the OCZ Vertex 3 series SSD is very fast; in fact it’s the fastest reading drive in this test by a long way.
ATTO disk benchmark
ATTO has become a standard tool for measuring the data
throughput of HDD and SSD. It measures the performance of reading and writing,
using different file sizes and block sizes.

SATA 3

SATA 2
The reading speed results on the OCZ Vertex 3 are extremely
impressive, topping out at over 559 MB/s, writing speeds are equally impressive,
topping out at 525 MB/s when the SSD is connected to a native SATA 6Gbps
solution.
ATTO writes its test patterns in form that are easily
compressed by DuraWrite, so you are seeing the OCZ Vertex 3 in a best case
scenario, but it certainly shows what the SSD is capable of.
CrystalDiskMark 3.0
Crystal Disk Mark is quite a handy benchmarking application,
as it focuses on the file sizes that can cause a problem on a system drive.

SATA 3

SATA 2
With Crystal DiskMark writing mainly non-compressible data
using its default test patterns, we are really seeing Vertex 3 in a worst case
scenario. None the less, the test results are still mighty impressive.
AS SSD Benchmark
AS SSD benchmark is a benchmarking tool specifically
designed to test SSDs. The application tests sequential reading and writing
performance, 4K random reading and writing performance.
AS SSD benchmark also tests 4K threaded performance. This is
very exciting, as this test is the first available test that I am aware of,
that simulates how a PC operating system actually works. A modern PC and OS,
such as Windows Vista does not just run a single thread at a time, it runs many
threads. The AS SSD benchmark "4K 64Thrd" tests run 64 threads
simultaneously throughout the test. If this result is good, then you can be
pretty sure the drive will perform extremely well as a system drive.
After the tests complete, AS SSD benchmark derives a total
score for the drive being tested. This is based on all aspects of the test
results, and gives an indication of how the drive is performing overall.
Now let’s look at the result from the OCZ Vertex 3 in the
form of a screenshot. All our other comparison drives’ results are presented in
the form of a graph.

SATA 3

SATA 2
Once again, AS SSD creates its test data in a format that
cannot be easily compressed by DuraWrite, so again we are seeing Vertex 3 in a
worst case scenario. However, the OCZ Vertex 3 has still produced the best results
I have ever seen from a single SATA SSD.

AS SSD compression benchmark.
This test creates test patterns on the target drive which
are random and vary in the level of compression used in the test data. This
ranges from 0% compressible to 100% compressible. This test is ideal for
SandForce based drives, as it will show the relevant performance at different
levels of compression already applied to the test data.
I run this test on the OCZ Vertex 3, and I also run the same
test on two other SSDs.
- Crucial RealSSD C300 128GB
- OCZ Vertex 2 100GB
Below are the obtained results.

OCZ Vertex 3

Crucial RealSSD C300 128GB

OCZ Vertex 2
Even when faced with having to write data that is not
compressible at all by DuraWrite, the OCZ Vertex 3 is still by a huge margin
the fastest drive. In fact, the Vertex 2 also performs very well in this test.
Summary:
In every single area I have tested so far, the OCZ Vertex 3
is by far the fastest drive in these tests.
Let's head to the next page for our IOMeter test
results.....
I/O Performance
There is little point of having an SSD drive that has
blazing sustained reading and writing speeds, if the drive can't handle reading
and writing of small random files. If you intend to use your new SSD drive to
store and run your operating system, then the drive must be able to cope with
the many small random files that Windows will write to the drive continually.
So I feel it is very important to test how many of these random files that a
drive can handle in one second. I believe that anything over 1,000 I/O’s per
second would be enough for most users running a consumer grade mainstream PC,
and should provide a smooth running system. But obviously, the more I/O's that
a drive can handle, the faster the drive will feel and leave more headroom for
those huge multitasking sessions that users sometimes engage in.
The things that I will look at are the total I/O per second and
total MB/s.
Partition alignment and sector boundaries
Windows 7 will automatically align a partition to 4k
boundaries during partition creation, Windows XP won’t. It is imperative that
an SSD’s partition is aligned. Windows XP is also restricted to sector
boundaries, while Windows 7 will use 4k boundaries if it can. The Vertex 3 is 4k
boundary aware, and will use these boundaries when it can. Of course it will
also remap LBAs for compatibility with the sector boundaries so the drive can
be used with Windows XP.
IOMeter allows us to set the sector boundaries for
conducting the tests, and I have therefore set the sector boundaries at 4K,
which means the IOMeter tests are valid for Windows 7 and Windows Vista users.
XP users will not be able to obtain such results.
I will provide a screenshot of the tests on the review drive
for those of you who like to see the actual test result. All the comparison
drive results are represented in the form of graphs.
If any of you would like to see a screenshot from any
IOMeter test on a particular drive, please feel free to request one, and I’ll
post the screenshot in the forum thread.
All the IOMeter tests create a 10GB data set on the target
drive, and each test is run for a duration of 3 minutes.
IOMeter 4K random (outstanding I/Os = 4, 32) write test.
Our first test involves creating continual 4KB random files
on the target drive with IOMeter. I use a 4KB file size, as it is believed that
Windows will create and modify many of this size of file constantly in the
background during a typical Windows session. I will use queue depths of 4 and
32 for these tests on the OCZ Vertex 3, OCZ Vertex 2, Plextor PX-256M2S, and
Crucial RealSSD C300.
SATA 3

(Queue depth 4 SATA 3)

(Queue depth 32 SATA 3)
SATA 2

(Queue depth 4 SATA 2)

(Queue depth 4 SATA 2)
IOPS

MB/s

78878 4K random write IOPS is just outrageous performance
from a single SATA SSD, and probably more than any desktop user will ever
require. Nonetheless, it’s nice to have this much performance in reserve. The
key to high 4K random performance is low latency, so even if Vertex 3 will
never require queue depths of 32, its ultra low latency will also insure it’s
faster than the other SSDs in these tests, regardless of how low the queue
depth is.
4K random write queue depth profile
For this test I used various queue depths from 1 – 32 to
give you an idea how this SSD performs at different queue depths. For a normal
desktop user for lightweight multitasking, the queue depth will rarely rise
above 2. For heavy multitasking, the queue depth is unlikely to rise above a
value of 8.
Only two SSDs were tested here. The OCZ Vertex 3, and the
Crucial RealSSD C300 128GB which was only tested on SATA 6Gbps, while the
Vertex 3 was tested on SATA 3Gbps as well as SATA 6Gbps.
For this test I have also used completely random data,
pseudo random data, and the normal repetitive data IOMeter test patterns. This
has been done to show how the SandForce SF-2281 SSD processor deals with data
that isn’t so easily compressed.
The result is below.

What is very interesting here is the “queue depth 2” result.
With a queue depth 1 score of around 68MB/s even with perfect scaling, you
wouldn’t expect the queue depth 2 result to be more than twice that of queue
depth 1, and here we have a huge jump in performance at queue depth 2. You
would think that some sort of glitch happened while running the queue depth 2 tests.
This is what I first thought had happened, but the result is repeatable time
after time, and the result is no more than 2MB/s out with each run of the test.
Could IOMeter itself be to blame?
If so, then why doesn’t the Vertex 3 get a similar boost on SATA 2, and why
doesn’t the Crucial C300 get a similar boost on SATA 3?
Could AsRock or Intel have done something to tweak SATA 3 at queue depth 2?
Again, then why doesn’t the Crucial C300 get a similar hike in performance at
queue depth 2?
The only plausible explanation that I can come up with is,
SandForce have done some clever tweaking for 4K random write at a queue depth
of 2, knowing that this area is where some real world benefits can be achieved.
Below I present a table of the results in more detail.

IOMeter 4K random (outstanding I/Os = 4, 32) Read test.
If there are many 4k files created, then that must also mean
that many 4k files need to be read. This test measures 4k reading performance.
SATA 3

(Queue depth 4 SATA 3)

(Queue depth 32 SATA 3)
SATA 2

(Queue depth 4 SATA 2)

(Queue depth 32 SATA 2)
IOPS

MB/s

The Crucial RealSSD C300 was always mighty with 4K random
reading performance, and is two times faster than the SF-1200 based Vertex 2.
While the Vertex 3 still can’t match the performance of the RealSSD C300, it is
getting closer.
4K random read queue depth profile.
This test is much simpler than the 4K random write test, as
there is no need to include full random or pseudo random data.

Below I present a table of the results in more detail.

IOMeter 512KB (outstanding I/Os = 2) write test.
Sequential writing performance is also very important; in
this test sequential writing performance is measured.

SATA 3

SATA 2
IOPS

MB/s

The OCZ Vertex 3 slaughters the competition in this test. And
remember, the Vertex 3 is connected to a single SATA port here, so this isn’t
relying on PCIe or multiple SSDs in a RAID 0 array, this a single SATA drive.
IOMeter 512KB (outstanding I/Os = 2) read test.
This test measures 512k sequential reading performance.

SATA 3

SATA 2
IOPS

MB/s

Sequential reading performance is very impressive, and the Vertex
3 is the fastest reading drive.
IOMeter Workstation simulation (outstanding I/Os = 64).
When running applications you will find that there is a
mixture of small random files, and larger sequential files, being created and
read. Not only that, it isn’t just one file at a time. In this test I measure a
simulated workstation pattern, with a queue depth of 64 (threaded).

SATA 3

SATA 2
IOPS

MB/s

The OCZ Vertex 3 has done extremely well in the workstation
simulation, and is a good deal faster than any of the competition.
Summary
The OCZ Vertex 3 and its SandForce SF-2281 SSD processor is
really pretty much out on its own. In writing performance, be it small file
random, or large sequential performance, it’s simply miles ahead of the
competition. Reading performance is every bit as impressive, while it can't quite
manage to muster the might of the RealSSD C300 for small file random
performance, it’s miles ahead in sequential reading performance.
Now let's head to the next page for some real world tests....
It has become clear quite recently that simply conducting endless
benchmarks on SSD drives is pointless. Real users may run a few benchmarks when
they first fit their SSD drive, but most users just want a drive that performs
well in the real world. They want their drive to work "out of the
box" and work fast and smoothly.
Most of the latest SSD drives can deliver very fast
sustained reading and writing speeds, but these alone tell you very little
about how the drive will perform in the real world.
If you intend to use your SSD as your primary system drive,
with an operating system and applications installed and running from the drive,
real world performance becomes much more important than just fast sequential
read and write speeds.
Real world copy
tests
I will now conduct a few real world copy tests. These tests
simulate what real people do with their drives. I will be conducting writing
tests, using a large single file and a multiple file copy of various file
sizes. Then I will round off the tests by copying a folder of MP3 audio files,
and also a folder of JPG pictures.
I should point out that this is not a scientific way of
measuring performance. These timings were taken with a stop watch; we have
however ensured that the reading drive is well able to supply a data stream to
our writing drive, which is high enough not to be slowing down the performance
of the writing drive.
I will once again be comparing the obtained results with our
comparison drives, and will present the results in the form of graphs.
Multiple file copy writing test
For this test I copied the Nero Burning Rom install folder
from our review PC to the OCZ RevoDrive X2 240GB SSD, and then copied the
contents from the RevoDrive to the OCZ Vertex 3 SSD and our other comparison
drives.
Our test copy contained 1,772 files of various sizes with a
combined capacity of 307MB.

The OCZ Vertex 3 is quite a bit faster than any of our
comparison drives in this test.
Single large file writing test (7.95GB)
For this test I used a single DVD9 ISO file which had been
copied to the OCZ RevoDrive X2 240GB SSD. The file was then copied to the OCZ
Vertex 3 240GB SSD and our comparison drives.

The OCZ Vertex 3 with its massive sequential writing performance
is more than 5 seconds faster than its nearest rival.
Write a folder of JPG picture files.
For this test I copied a folder of JPG picture files from
our OCZ RevoDrive X2 SSD to the OCZ Vertex 3 SSD, and our other comparison
drives. The folder contained 3,714 JPG pictures, with a total capacity of
5.16GB.

Again the Vertex 3 is out in front when writing our folder
of JPG picture files.
Write a folder of MP3 audio files.
For this test I copied a folder of MP3 audio files from our
OCZ RevoDrive X2 SSD to the OCZ Vertex 3 SSD and our other comparison drives.
The folder contained 851 MP3 audio files, with a total capacity of 3.85GB.

The OCZ Vertex 3 was a good deal faster than its nearest
competitor in this test, and as we are dealing with data that is already
heavily compressed, the test shows how much SandForce has advanced when the SSD
has to deal with writing non-compressible data with the new SF-2281 SSD
processor.
Just for the fun of it, I grabbed a screenshot of the actual
copy taking place, and you can view it below.

MP3 file copy progress, showing the writing speed on the Vertex 3 at 381 MB/s
Summary
In the previous two pages of this article, it was clear that
according to our synthetic benchmarks and the IOMeter test results that the OCZ
Vertex 3 was performing extremely well, at least in the synthetic world. It is
very encouraging to see this excellent performance being carried over to the
real world with these copy tests.
Single drive copy tests
These tests are to simulate a single drive in a PC or
laptop. In other words, I will copy a series of files from one folder on the
tested drive to another folder on the same drive. This means the drive is simultaneously
reading and writing during the tests. I also want to make this a realistic
test. So I have used a folder or MP3 music files, and then repeated the test
with a folder of JPG picture files.
Single drive copy tests – 851 MP3 song files (3.85GB total)

The OCZ Vertex 3's excellent reading and writing performance
has made sure that it is by far the fastest drive in this test.
Single drive copy tests – 3,714 JPEG picture files (5.16GB total)

Once again, the OCZ Vertex 3 is the fastest drive by quite a
long way.
Windows start-up and closedown
For these tests, I simply used a stop watch and tested the
amount of time taken for a full installation of Windows 7 to boot to the
desktop, and then timed how long it took for Windows 7 to close down by the
normal start menu method.
The timing was started once the BIOS had initialised and
reached the “loading OS message”.

Windows 7 boot time

Windows 7 closedown
The OCZ Vertex 3 is marginally faster than the other comparison
SSDs in booting Windows 7 and then closing the PC down again.
Installing applications
Installing applications is possibly something you don't do
that often. But should you replace your system disk, then you will most likely
have to re-install your applications. Most of the SSD drives I have tested up
until now are quite slow at installing applications, most likely because their
I/O performance was quite limited.
For these tests, we picked some popular applications and
copied the entire contents of the CD or DVD media to an OCZ RevoDrive X2 240GB
SSD. We did this to make sure that the reading speed of our CD/DVD reader would
not hamper the performance of the target drive.
We then installed these applications onto our comparison HDD
drives, which were all running mirror image installations of our Windows 7 Home
Premium 64bit installation, and timed the amount of time taken to install the
application with a stopwatch on each of the drives.
MS Office 2007 Professional (full install)
MS Office is another of those applications that make you
cringe at the thought of re-installing it.
Let's find out how our drives coped with the MS Office 2007
full install.

The OCZ Vertex 3 is the fastest by a comfortable margin
Adobe Fireworks CS3
Adobe Fireworks CS3 is another popular package. Let's find
out how our drives coped with installing this application.

There isn’t a huge margin in the amount of time taken to
install this application with our modern SSDs. However, the OCZ Vertex 3 is the
fastest.
Summary
Our real world tests, though not scientific in nature, I
feel are more realistic than simply running benchmarks. What is clear from our
tests is that the OCZ Vertex 3 has phenomenal performance in the real world.
Whatever SandForce has done with the SF-2281 SSD processor to improve how the
SSD can handle data that isn’t easily compressible by DuraWrite has totally
transformed this new generation of SSD.
Let’s check out application and game loading performance
on the next page of this article.....
These tests are very simple tests, but very important to
some users of SSD drives.
We simply started an application or game, and measured the
time taken for the application or game to fully load and start.
Application loading times
Adobe Fireworks CS3

The OCZ Vertex 3 was slightly faster than the other modern
SSDs, but in fact, all the SSD drives performed well.
Corel PaintShop Pro 12

Again, the OCZ Vertex 2 is only marginally faster than our
other comparison SSDs.
Games loading times
FAR CRY 2

Once again, the OCZ Vertex 3 is marginally faster than the
other modern SSDs, but they really are very close indeed.
F.E.A.R. 2

The OCZ Vertex 3 is once again the winner, but the margin is
so very close, in fact so close as to make no appreciable difference.
Now let’s round of this article with the MyCE Reality
Suite tests on the next page.....
MyCE Reality Suite (storage).
So what is the MyCE Reality storage test?
The MyCE Reality Suite of tests is made from real everyday
applications and real data, there are no simulated tests, and everything is in
the real world. The only thing that's synthetic is that everything is automated
to make the tests fair, no matter which drive the tests are run on.
Recorded user sessions, by means of a script, are used to
launch the applications, load data, edit data, and then finally write that data
back to the target drive. The scripts do load the system much more than a human
could with these tests, as the scripts do not make mistakes, or pause to think
about what has to be done next.
Measurement system (revision 2)
The measuring system is part hardware and part software. The
hardware is proprietary and under an NDA, but what I can tell you is: The
measuring system can now accommodate SATA2, SATA3, USB3, PCIe, and DMI.
Testing method.
Once all the test data files were complete, they were then
copied to a single folder. I then fitted an old 80GB HDD into the PC and did a
clean install of Windows 7 Home Premium x64. The latest hardware drivers were
installed and Windows update was run to install any new updates that were
available up to 13/05/2010. At this point the applications that were to be used
in the tests were installed and updated with the latest patches.
The folder containing the application test data files was
then copied over to our fresh Windows 7 HDD. The drive was cleaned up and then
the four test scenarios were recorded, with the scenario playback data file
which will run each test scenario saved to the desktop. A drive snapshot was
then taken of the complete HDD and the drive snapshot image copied to a second
HDD for safe keeping.
The image is then simply restored to each of the drives on
test. In the case of SSD’s the partition is then realigned “on the fly” and for
SSDs that support TRIM, the free space is filled and then deleted to force
TRIM. All other HDDs and SSDs in the system are then disconnected to make sure
the complete test can only run on the drive I am testing.
A 20 minute settling time is allowed before the tests are run,
then each of the 4 tests is run and the results gathered. This process is
repeated for each of the drives I am testing.
The test scenarios are as follows.
- Graphics content
- Video editing
- Audio import and compression
- Application multitasking
Let’s begin the tests.
MyCE Reality Suite – Graphics content.
Using ACDSee Pro 3, 100 JPG pictures with an average size of
10MB are imported into the ACDSee library, and then 12 of these JPG files are
then selected for a batch process, of resize, compress the quality to 80%, and
finally write the edited pictures back to the drive. The test is approximately
78% read and 22% write.

The OCZ Vertex 3 has performed extremely well with the
graphics suite, and is a good deal faster than any of our comparison drives.
MyCE Reality Suite – Video editing.
Using Vegas Pro, a 14GB HD MPEG2 video stream is loaded into
the editor, from which 2 segments are then cut and pasted into new segments. There
is a lot of disc caching going on in this test, and the test is approximately
55% read and 45% write.

I had a hunch before running this test that the Vertex 3
would show its true colours. Not only does this test involve more writing than
our other Reality Suite tests, the data that it has to handle is already quite
heavily compressed. We can see quite clearly that the new SandForce SF-2281 SSD
processor is very strong, even when it has to handle content that is already
compressed.
MyCE Reality Suite – Audio import and compression.
Using Sony Soundforge 10, a batch process is run consisting
of 30 24bit (192000hz sample rate) .wav files, and 100 16bit (44100hz sample
rate) .wav files are imported and then converted to MP3 audio files with a bit rate
of 128kbps, and the converted files are written back to the drive. The test is
approximately 72% read and 28% write.

Once again, the OCZ Vertex 3 is well out in front, leaving
the other tested drives in its wake.
MyCE Reality Suite – Application multitasking.
For this I used several popular applications, Microsoft Word
2007, Microsoft Access 2007, Microsoft Excel 2007, Microsoft Outlook 2007,
Adobe reader, Adobe Photoshop CS3, uTorrent, Windows media player, and Internet
Explorer 8.
This session runs for approximately 12 minutes. The test is
started by downloading a Linux distribution via uTorrent, Windows media player
is then opened and a 1080p video file is opened and played for the duration of
the test. Microsoft Outlook is opened and any new emails are received, read,
then replied too, a document in Adobe reader is opened and scrolled from start
to finish, 3 Microsoft Word documents with graphics content are opened, browsed
and some sections of the documents are copied and pasted into a forth document
and then saved back to the drive. The same applies to Microsoft Access and
Excel. 100 MP3 files are imported into Windows media library. Six JPG images
are loaded into Adobe Photoshop and some minor editing is done and the files
saved back to the drive.
Finally, Internet Explorer 8 is opened with 10 tabs, and the
contents of the 10 tabs refreshed, and browsed while the other applications are
busy in the background.
I would describe the multitasking pattern as moderate to
heavy.
During this test there is approximately 85% reading and 15%
writing.

There were no surprises here, and the Vertex 3 is miles in
front of the other comparison drives when running this test.
Summary
I firmly believe that the MyCE Reality Suite gives a very
good overall picture of how a drive can perform in the real world, and in this
case, the OCZ Vertex 3 SSD is head and shoulders above our other tested drives.
Now let’s head to the next page, and see how well the
drive performs after heavy use....
Speed degradation after heavy testing
On this page I will test how the SSD performs after heavy
testing and usage.
I now have a new policy as to how I go about testing an SSD.
In the past I would deliberately try and get an SSD into a “used state”, by
filling the drive several times before starting the tests. This seemed to work
quite well up until the SandForce based SSDs appeared, but because of the way
the SandForce controller works, it was near impossible to tell if deliberately
trying to get a SandForce based SSD into a “used state” had actually worked on
not.
A new strategy was required. So now I begin the tests with
the SSD in a clean state and allow it to look after itself during the testing
period. I start off the tests by running AS SSD benchmark. This gives me the
“as new” reading and writing performance of the SSD.
Once all the tests have been completed, the drive is then
tested as a system drive, and just used normally for many days (which is
something I have always done with a review sample). At the end of the period,
the drive is filled to capacity and then all files are deleted from the drive
and then a “quick format” is performed.
The last test is a rerun of AS SSD benchmark, and the result
from the final test compared with the first run when the SSD was in an “as new”
state.
The results are below.
New state
New state 19/5/2011
Used state

Used state 29/6/2011
With 3.26 Terabytes of data already written to the drive
during the testing period, there is no real evidence of speed degradation after
some very heavy testing, in fact the random reading speeds are slightly higher,
and writing speeds have only dropped marginally at the end of the testing
period.
If this is an indication of how this SSD will perform in the
long term, then it would pretty safe to say that the OCZ Vertex 3 is very
effective indeed at keeping the drive operating at, or very near to its “as
new” state.
This concludes our review. To read the final thoughts and
conclusion, click the link below....
Final thoughts and the conclusion
User experience
A modern operating system such as Windows 7 rarely does one
thing at time; it processes hundreds of threads at once. Just take a look at
the processes and services that are running in task manager for an idea of how
much is going on, even with the PC idling at the desktop. When you start
running applications on top of this, the workload increases in line with the number
and type of applications you are running. It’s also fair to say that many of
these processes are already loaded into system RAM, but many are also loaded into
and unloaded from RAM from the system drive as and when they are required.
The fact of the matter is this. If you are running a mainstream
or high end modern PC with a powerful CPU and graphics card, and are still
running a traditional HDD as a system drive, regardless of how fast that HDD
is, it is still bogging the system down substantially. It has long since passed
the stage where one can meaningfully debate if an SSD is really faster than a
traditional HDD. The fact is they are, and not just by a little bit: they are
much faster.
If we look at the 3 basic requirements for a fast SSD, they
are as follows.
- Small file threaded performance needs to be high
- Small random file performance needs to be high
- Sequential read and write speeds needs to be high
The OCZ Vertex 3 240GB has all of the above in abundance.
Stability
During the synthetic benchmarking phase of this article, the
OCZ Vertex 3 was connected as a spare on the Intel Z68 SATA 6Gbps connector,
and the benchmarks ran without any issues whatsoever. The drive was completely
stable during this phase of testing.
After the synthetic benchmarks were completed, the Vertex 3
was removed from the PC and connected to an SATA analyzer. The analyzer is able
to run a complete “soak test” for a duration of 60 hours, when all my review
samples are put through their paces. The OCZ Vertex 3 passed this test without
any issues, and results were all “green flagged”.
The next phase of testing is the real world and Reality
Suite tests. For these tests a pre-configured Windows 7 installation with all
the required test files is cloned onto the review drive. From then on the
review drive becomes the system drive, and is running the operating system, and
all the applications.
At this point things started to go wrong. After running the
system for around 30 minutes, the system froze, and was followed sometime later
by a BSOD. At the time I didn’t think much of it, the Z68 motherboard was only
a few days old, and had a fairly early UEFI. I recycled the power to the PC and
restarted the system, and a few minutes later, the PC froze once more followed
by another BSOD. This time I was a little more concerned, and decided to check
the UEFI settings. All seemed well and the system was once again restarted, but
again another BSOD soon followed.
A quick visit over to OCZ’s support forum confirmed that a
few users were having the same problem. OCZ were doing their best to help
customers, but the problem was SandForce (at that time) could not re-create the
problem in their labs. The staff at the support forum had found a workaround
that seemed to cure the problem for most people. It involved a CMOS reset,
secure erasing the SSD, then doing a clean install of Windows 7, followed by
forcing sleep and hibernation states.
I informed one of my contacts at OCZ that I was having a
problem, and would try their workaround. A few hours later the system was up
and running, updates were done, drivers installed etc etc. After a couple days
of use, I was very much more optimistic. The system was stable with no freezes
or BSOD. A full week later and still stable I resumed testing of the Vertex 3,
running the reality and real world tests. Once again the system was completely
stable, and remained so for a further 2 or 3 weeks, and in fact is still stable
as I write this article.
So what had caused my problem? Clearly in my case it wasn’t
the Vertex 3 itself.
At around this time, SandForce had finally re-created the
problem for themselves, and had promised a firmware update to improve stability.
They had found that some platform chipsets were on the margin, or just over the
edge regarding SATA 3 specs, and what was happening on some systems was that the
chipset didn’t respond to the SSD in good time, which caused a fatal system
error. So with the release of firmware 2.09, SandForce have slowed down the SSD
a little bit to give the motherboards SATA controller a little longer to
respond. Ok, that seems to have that covered, but my own SSD was no longer
causing a problem, even without this firmware update.
Being the inquisitive type, I wanted to know which part of
OCZ’s original workaround had cured the stability problem I was having. The
problem was eventually tracked down to the CMOS of the motherboard. For some
reason, the IME table which stores many parameters, including power states had
become corrupted. I was able to confirm this by reloading the CMOS snapshot
that had caused the problem back into CMOS and retesting.
In conclusion, I have some concerns about the stability of
the P67/Z68/H67 platform. There appears to be issues with the SATA 3
controller, and appears to centre around LPM (link power management), where
the transitions from “partial” to “slumber”, “sleep”, then back to “full power”
are causing an issue, and this is not restricted to SandForce based SSDs,
Crucial have found some problems with their C300 and M4 SSDs, and even some
Intel SSD owners are experiencing similar problems. A tech support rep for one
motherboard manufacturer has even suggested that users having a problem should
use the SATA 2 ports instead, as SATA 3 “may” have a problem.
Intel are apparently aware and working on it with various
partners, but it seems to be taking Intel a very long time to come up with a
firmware update for the option ROM. Let’s hope when this becomes available in
the shape of a UEFI update, it fixes the issues that some users are having with
this platform, as God forbid, the last thing we need is another P67/Z68
platform recall.
On the OCZ and SandForce side, perhaps they were a little bit
too ambitious with their firmware tweaking to get the most out of the SF-2281. In
any case, firmware 2.09 seems to have cured the problem for most of the few
users who were experiencing a problem. Unfortunately, for the few who still
have a problem after updating to firmware 2.09, replacing the SSD is unlikely
to fix it, as the platform chipset that the SSD is running on may simply not be
stable on their particular motherboard.
According to OCZ, this instability issue has affected around
0.75% of all SandForce SF-2281 based SSDs sold. If OCZs sales figure are
correct, then this 0.75% figure seems to add up, basing this assumption on the
amount of customers reporting a problem.
So to sum up the OCZ Vertex 3 stability.
After a CMOS reset to clear my corrupted IME table, the
Vertex 3 has been completely stable, and has remained so for the past few
weeks. Of course this is something I will be keeping an eye on.
Conclusion:
Let us summarise the most important positive and negative
points below:
The main positive points:
Positive:
- Silky smooth operation as a system drive (during the test
period). - Phenomenal reading and writing performance.
- Incredible 4K random I/O performance.
- SATA 6Gbps support.
- Outstanding multitasking potential.
- TRIM support under Windows 7.
- Lightning fast access times.
- Completely silent operation.
- Fast operating system start-up and shutdown times.
- 3 years warranty.
Negative:
- Slight possibility of stability issues on some Intel
chipset motherboards.
The OCZ Vertex 3 240GB SSD has the fastest reading and
writing speeds from a single SATA drive that we have ever tested here at MyCE.com.
4K random IOP performance is incredible and small file threaded
performance is phenomenal.
Non-compressible data is handled with ease on the Vertex 3;
with the new SandForce SF-2281 SSD processor showing far better performance in
this area than compared to the older SF-1200 based Vertex 2.
With TRIM support in Windows 7, the OCZ Vertex 3 should
remain at near peak performance during the expected life cycle of the drive.
Noise levels from the drive are nil; there are no moving
parts so the drive is completely silent.
The main negative points:
The only negative with the Vertex 3 is the slight
possibility that you may run into some stability problems with a few (mainly)
Intel chipset based motherboards. The chances are that with less than 1% of
users affected, this won't be an issue at all.
To sum up, this is what I
would say:
As I write this article, the OCZ Vertex 3 still has no
serious rivals regarding performance from non SandForce based SSDs, as it is simply
head and shoulders above anything else that is available at this moment in time
with regard to a single drive SATA solution.
Price
As I write this article, I found the OCZ Vertex 3 240GB SSD
at Scan
UK for £393.89 Inc VAT, which translates to €438.48 at the current
exchange rate.
|
Model |
User capacity |
Price |
Cost per GB |
|
OCZ Vertex 3 240GB |
223GB |
£393.89 |
£1.77 |
Our parting sentence is
“The OCZ Vertex 3 is an incredible SSD, and the fastest SATA
SSD we have ever tested here at MyCE.com”.


You may comment on this review below.
Thanks to:
|
|
EFD Software for |
|
|
Alex |


")


