 |
Review: Samsung 840 Pro 512GB SSD |
It's only a few short weeks ago that I reviewed the Samsung
830 series SSD. The 830 series SSD proved to be a strong performer, and a very
reliable SSD. My review of the 830 series was late, and I published that review
just days before Samsung released the new 840 series of SSDs.
In this review I will be taking a look at the new Samsung 840
Pro series SSD, in fact the 512GB version. Samsung are in a very strong
position when it comes to sourcing components for their SSDs. They don't have
to look far as they make all the major components in-house, and that includes
the SSD controller, the NAND, and even the cache.
The Samsung 840 Pro is aimed at the consumer and enterprise
market segment. Let's find out how this SSD performs in our range of tests.
Samsung company information
Samsung should need no introduction, but those of you who
would like to find out more about Samsung, can do so at their website.
The Samsung 840 Pro - 512GB SSD
Now it’s time to take a look at the drive itself and what it
came shipped with.
Packaging
The SSD I received was a bare drive, and arrived in a
cardboard box, with no markings.
Inside the box

Drive top
The top of the unit is made of plastic with a metal
shielding.
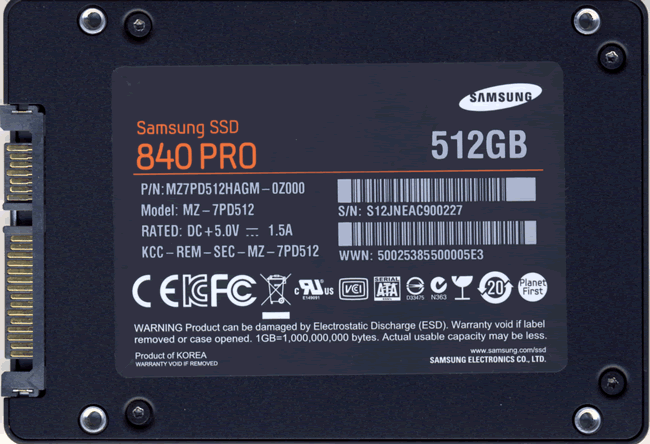
Drive underside
On the underside of the SSD, I found a label which displays
the SSD model number, storage capacity, and indicating that the SSD was
manufactured in the Korea.
The case itself is 7mm thick and designed to be housed in a
standard 2.5 inch drive bay, or a 3.5 inch drive bay using a converter bracket.
Now let's head to the next page, where we look in more
detail at the Samsung 840 Pro SSD.....
A closer look at the Samsung 840 Pro hardware.
Let's take a look at the hardware found inside the Samsung
840 Pro SSD.
At this point I would normally open up the drive and take
some screenshots of the components found inside. Unfortunately this was not
possible with the Samsung 840 Pro. The screws holding the drive together have
tiny hex type heads, and I didn't have a tool small enough to fit the screw heads.
This normally wouldn't stop me, but the 840 Pro is on loan, and I didn't want
to risk damaging an SSD that had to be returned.
However, I can write some text about the components.
The SSD controller
The SSD controller is the new Samsung MDX. This controller
is based on an ARM Cortex R4 and has three cores, with a clock frequency of
300MHz. The MDX controller also supports an AES-256 encryption engine, by means
of password protection in the system UEFI/BIOS.
The firmware onboard the review sample is DXM02B0Q which is
a pre-production firmware. The firmware used in the production units is a later
version (DXM03B0Q), with a bug-fix which could cause the pre-production
firmware to lock the 840 Pro after a secure erase had been initiated on the
drive. I had no such problems with the review sample I received.
The NAND
The NAND is 21nm toggle DDR2 MLC NAND, with 400Mbps
bandwidth per die.
The cache
There is 512MB of LPDDR2 (Low power DDR2) onboard the 840
Pro, which is clocked at 1066MHz.
Specifications
I found the following specifications at Samsung's website.


Drive maintenance features
For Windows 7 and Windows 8 users and some distributions of
Linux, the Samsung 840 Pro series SSD supports ATA TRIM to keep the NAND clean.
The Samsung 830 series also has advanced garbage collection to clean the NAND
during drive idle periods.

Samsung SSD Magician
The SSD Magician software allows the user to maintain the
SSD, and has the following features.
- System: Allows the user to see system and drive
properties. - Performance Benchmark: Performs a very basic
benchmark on the SSD. - Performance optimization: Performs a manual TRIM of
the SSD. - OS Optimization: Allows operating system features
which can affect SSD performance to be switched on or off. - Firmware Update: Allows the Samsung 840 Pro
firmware to be updated. - Secure Erase: Sends a Secure Erase command to the
SSD, clearing all NAND and returning the SSD back to its factory default
state. - Over Provisioning: Allows the user to set aside a
given amount of NAND as a manual over provisioning area. - Disk Clone: Launches Norton Ghost 15, if the
application has been installed.

Let’s head to the next page where we take a look at our
testing methods and the review PC.
Test machine
For this review I will be using a computer with the
following configuration:
Hardware:
- Motherboard: Asus P8Z77 V Deluxe (Intel Z77 chipset)
- Processor: Intel 3rd generation Core i7 3770K
- RAM: 16GB Samsung Green DDR3 1600MHz (dual channel)
- GFX: Onboard Intel HD 4000
- Sound: Onboard Realtek ALC898 HD audio controller
- Hard disk OS: OCZ Vector 256GB SSD
- Hard disk storage: 1X 500GB Samsung Spinpoint F3, and 1X 1TB
Samsung Spinpoint F1. - Case: Antec Performance One P280
- PSU: Antec True Power modular 550W
- Display: Dell UltraSharp U2412M 24” widescreen IPS LCD (HDCP
compliant) - Operating System: Windows 8 Professional 64bit
The Samsung 840 Pro SSD was connected to the Intel native SATA
6Gbps (port 0) on the Z77 motherboard of our review PC and all tests on the drive
were carried out with the drive connected to this port.
AHCI mode was also selected for all drives in the UEFI of
our test PC, and all tests were carried out in this mode. The SATA 6Gbps drivers
used on our review PC were the Intel Rapid Storage Technology (RST) Version
11.6.0.1030
Test applications
To test the performance of the Samsung 840 Pro series 512GB
SSD, I will be using the following test applications in this review.
- HD-Tune Pro
- ATTO
- Iometer
- AS SSD
Benchmark - CrystalDiskMark
- MyCE Reality Suite
- Anvil’s
Storage Utilities
Test procedures
I will start off our testing procedures explanation by
stating that I did not run many synthetic benchmarks on the Samsung 840 Pro SSD.
You may ask why I have run so few synthetic benchmarks?
SSD technology has moved so fast in the last couple of years,
that basic synthetic benchmarks alone are now of very limited use, as they don't
really tell us much about performance and how the drive will behave in the real
world. I have therefore decided to show some basic benchmarks of the Samsung
840 Pro series SSD, and will complement this with advanced benchmarks using
IOMeter and AS SSD benchmark. I will also show how the Samsung 840 Pro series SSD
performs in the real world with our MyCE Reality Suite test.
The reality of SSD performance
While I can easily show you which SSD is technically the
faster, when you use one of these modern SSDs as an operating system drive it
becomes very difficult to tell them apart as far as performance is concerned.
A typical use of a small capacity SSD at the moment is to
have your operating system and applications installed onto the SSD. The
performance difference compared to a traditional HDD is enormous, however when
you start to compare SSD to SSD the difference becomes almost impossible to
detect.
Let’s look at why this is the case.
Drive A can boot to the desktop in 8.11 seconds, and drive B
can boot to the desktop in 8.12 seconds, the difference in time is
milliseconds, and can one really tell the difference?
The fact is, all modern SSDs are only ticking over when they
are only running the OS and launching applications, it’s only when you get to
some of the larger capacity SSDs, with enough free space to be able to hold the
actual data that you’re going to be working with, be that video, audio or
pictures, for example, that you actually get a tangible difference in
performance. This is where the SSDs with the better sequential performance start
to pull well ahead of the SSDs which have lower sequential read/write
performance.
Small file random IOPS vs sequential performance
IOPS
This is a fairly complex subject, but I will do my best to
explain things in a manner that is easy to understand.
The term IOPS is the amount of input or output transactions
that can take place in a one second interval, so for example, if an SSD is
quoted as being able to cope with 20,000 4K random write IOPS, then the SSD
should be able to cope with 20,000 input transactions in a period of one
second. If the same SSD is said to be able to produce 20,000 4K random read
IOPS, then the same SSD should be able to produce 20,000 4K random read output
transactions in a one second interval.
Ok, now we have some figures to work with, the next question
is how many IOPS are actually required?
This will depend on your usage pattern. If you are a typical
desktop user who browses the internet, does some word processing or perhaps
some audio or video editing, and perhaps plays a few games, then in actual
fact, you don’t need to have massive 4K random read/write performance. The
actual amount of 4K random performance that is required for a fast and smooth
running system for a desktop user with a usage pattern similar to the above
will be well under 1,000 4K IOPS.
On the other hand, if the SSD is being used for running a
large and complex database server, then 4K random performance is the absolute
measurement of how fast that server will run, as this type of application does
most of its input and output transactions in the 4K domain.
So why would I need an SSD with 80,000 4K IOPS for a
desktop?
In fact you don’t need this type of performance for a
desktop, but an SSD which is capable of coping with 80,000 4K IOPS will be
faster than an SSD which can only cope with 20,000 4K IOPS.
OK, I just said if under 1,000 4K IOPS are actually required
for typical desktop usage, why is an SSD with 80,000 4K IOPS faster than an SSD
with only 20,000 4K IOPS, confused?
You may ask, if I only require 1,000 4K IOPS surely the rest
is wasted?
While you may never need 80,000 4K IOPS, IOPS is all about
latency. The reason that an SSD can cope with as much as 80,000 4K IOPS is
because latency in this domain is very low. With 4K files, even if you require
to process 500 of them at the same time, you are not talking about a huge
amount of data, it has far more to do with how long it takes the SSD to process
a single file, and the amount of time required to process a single 4K is all
about how long it takes for the SSD to access or store that data before it can
move on to the next transaction.
In other words an SSD with 80,000 4K IOPS performance will
handle those 500 files faster than the SSD with 20,000 IOPS.
So how will a desktop user even notice this faster speed if
so little 4K random IOPS and data are actually used?
Multitasking is a good example. The more tasks you run at
the same time, you more you will notice the speed difference.
Sequential performance
I have always maintained that sequential performance was
every bit as important as small random file performance for a desktop SSD. To
me this was always so obvious for a desktop user. For example, let’s say you
want to launch an application or game. Both have some fairly large files to
load, and also a great many small files, but the point is, even the smaller
files are sequential in nature. Now let’s say you’re into audio or video
editing. Video files tend to be huge, and the files are written or read
sequentially. Isn’t this how many users are using their PCs these days?
Summary
So how does this shape up in the real world? Which is
better, massive 4K IOPS or massive sequential performance?
In an ideal world you want both, as an SSD with massive
random 4K IOPS and sequential performance will always be faster than an SSD
that has high sequential performance and moderate 4K random IOPS performance,
and the same applies to an SSD that has massive 4K random performance and
moderate sequential performance. The SSD which has high performance in both
patterns will always be the faster SSD.
However, you can still have an SSD that is very fast for
desktop use that has moderate random 4K performance and massive sequential
performance, the same can be said about a drive having massive random 4K
performance and moderate sequential performance, as it is about getting the
balance right if you have to compromise on one or the other.
Test drives
- Plextor PX-256M2S SSD
- Crucial RealSSD C300 128GB SSD
- OCZ Vertex 3 240GB SSD
- Intel 510 series 120GB SSD
- Crucial M4 256GB SSD
- OCZ Octane 512GB SSD
- Plextor PX-256M3 256GB SSD
- OCZ Vertex 4 512GB SSD
- Kingston Hyper X 3K 240GB SSD
- SanDisk Extreme 120GB SSD
- OCZ Agility 4 256GB SSD
- Corsair Neutron GTX 240GB SSD
- Samsung 830 256GB SSD
- OCZ Vector 256GB SSD
- Toshiba THNSNF512GCSS
512GB SSD - Samsung 840 Pro 512GB SSD
Drive preparation for running the tests
All the SSDs used in this article were in a clean and fresh
state when the testing period started. From then on, each drive had to rely on
its own NAND cleaning effectiveness for the remainder of the tests.
For the sake of clarity, I now only include SATA 6Gbps SSDs
in these tests, and all were connected to the native Intel SATA 6Gbps (port 0)
of my motherboard for these tests.
- All SSDs used in this article had their partitions aligned
to the Windows 8 x64 defaults.
Where I use graphs in this article to display results, I
will use the following colours to make it easier, for our readers to see which drive
we are reviewing.
![]() Samsung 840 Pro 512GB SSD
Samsung 840 Pro 512GB SSD
![]() Comparison SSD
Comparison SSD
Now let's head to the next page, where I look at some
basic benchmarks...
Synthetic Benchmarks
HD Tune Pro
In this benchmark I am checking sequential reading speed.

With an average sequential reading speed of 529.7 MB/s the Samsung
840 Pro is showing an excellent turn of speed.
Let's see how this compares to other recently tested SSDs in
the table below.

The Samsung 840 Pro has done extremely well in the HD Tune
Pro 5 reading test, and is the fastest drive.
ATTO disk benchmark
ATTO has become a standard tool for measuring the data
throughput of HDD and SSD. It measures the performance of reading and writing,
using different file sizes and block sizes.

The reading speed results on the Samsung 840 Pro are
extremely impressive, topping out at over 559 MB/s, and writing speed is also excellent
topping out at over 535 MB/s.
CrystalDiskMark 3.0
Crystal Disk Mark is quite a handy benchmarking application,
as it focuses on the file sizes that can cause a problem on a system drive.

As we can see from the above screenshot, sequential reading
and writing speeds are excellent, and random read and write speeds are very
impressive.
AS SSD Benchmark
AS SSD benchmark is a benchmarking tool specifically
designed to test SSDs. The application tests sequential reading and writing
performance, 4K random reading and writing performance.
AS SSD benchmark also tests 4K threaded performance. This is
very exciting, as this test is the first available test that I am aware of,
that simulates how a PC operating system actually works. A modern PC and OS,
such as Windows 7/8 does not just run a single thread at a time, it runs many
threads. The AS SSD benchmark "4K 64Thrd" tests run 64 threads
simultaneously throughout the test. If this result is good, then you can be
pretty sure the drive will perform extremely well as a system drive.
After the tests complete, AS SSD benchmark derives a total
score for the drive being tested. This is based on all aspects of the test
results, and gives an indication of how the drive is performing overall.
Now let’s look at the result from the Samsung 840 Pro SSD in
the form of a screenshot. All our other comparison drives’ results are
presented in the form of a graph.


The Samsung 840 Pro is showing excellent performance in the
AS SSD test run, and finishes the test in second place.
Summary:
The Samsung 840 Pro 512GB SSD has performed well in the
basic synthetic benchmarks. Random reading and writing performance is very impressive,
and not to be outdone, sequential reading and writing speed is excellent.
However, as we have learnt over the years, synthetic benchmarks don't really
tell us much about how an SSD will perform in the real world. So let's wait and
see how the Samsung 840 Pro performs in the real world a little later in this
article.
Let's head to the next page for our IOMeter test
results.....
I/O Performance
There is little point of having an SSD drive that has
blazing sustained reading and writing speeds, if the drive can't handle reading
and writing of small random files. If you intend to use your new SSD drive to
store and run your operating system, then the drive must be able to cope with
the many small random files that Windows will write to the drive continually.
So I feel it is very important to test how many of these random files that a
drive can handle in one second. I believe that anything over 1,000 I/O’s per
second would be enough for most users running a consumer grade mainstream PC,
and should provide a smooth running system. But obviously, the more I/O's that
a drive can handle, the faster the drive will feel and leave more headroom for
those huge multitasking sessions that users sometimes engage in.
The things that I will look at are the total I/O per second and
total MB/s.
Partition alignment and sector boundaries
Windows 8, Windows 7, and Windows Vista will automatically
align a partition to 4k boundaries during partition creation, Windows XP won’t.
It is imperative that an SSD’s partition is aligned. Windows XP is also
restricted to sector boundaries, while Windows 7 and 8 will use 4k boundaries
if they can. The Samsung 840 Pro series is 4k boundary aware, and will use
these boundaries if possible. Of course it will also remap LBAs for compatibility
with the sector boundaries so that the drive can be used with Windows XP.
IOMeter allows us to set the sector boundaries for
conducting the tests, and I have therefore set the sector boundaries at 4K,
which means the IOMeter tests are valid for Windows 7, Windows 8 and Windows
Vista users. XP users will not be able to obtain such results.
I will provide a screenshot of the tests on the review drive
for those of you who like to see the actual test result. All the comparison
drive results are represented in the form of graphs.
If any of you would like to see a screenshot from any
IOMeter test on a particular drive, please feel free to request one, and I’ll
post the screenshot in the forum thread.
All the IOMeter tests create a 10GB data set on the target
drive, and each test is run for a duration of 3 minutes.
IOMeter 4K random write test with repeating data.
The first test involves creating continual 4KB random files
on the target drive with IOMeter. I use a 4KB file size, as it is believed that
Windows will create and modify many of this size of file constantly in the
background during a typical Windows session. It is said that most 4K random
writes take place at a queue depth of only one, and I have been requested to include
this test in my reviews.
Queue depth 1

Samsung 840 Pro 512GB SSD – 4K random write (QD1)

At 130.19 MB/s the Samsung 840 Pro is performing extremely
well, and finishes this test in fourth place.
Our next test involves creating continual 4KB random files
on the target drive with IOMeter. I use a 4KB file size, as it is believed that
Windows will create and modify many of this size of file constantly in the
background during a typical Windows session. I will use queue depths of 4 and
32 for these tests.
Queue depth 4

Samsung 840 Pro 512GB SSD (Queue depth 4)

At a queue depth of 4, the Samsung 840 Pro is showing
excellent performance, and finishes this test in second place.
Queue depth 32

Samsung 840 Pro 512GB SSD (Queue depth 32)

Once again the Samsung 840 Pro is performing extremely well,
finishing this test in third place, with a very impressive 357.7 MB/s.
IOMeter 4K random write test with fully random data.
This test is exactly the same as the test above except that
the test data is fully random and is therefore much more difficult to compress.
This test was requested as SandForce based SSDs gain a lot of performance by
being able to compress data on the fly. While the above test shows the
SandForce based SSDs in a best case scenario, the following test will show the
SandForce based SSDs in a much more realistic scenario.
Queue depth 4

Samsung 840 Pro 512GB SSD – 4K random write (QD4 with fully random data)

The Samsung 840 Pro pays no penalty when writing data which
is incompressible, and with 339.25 MB/s it finishes the test in second place.
4K random write queue depth profile
For this test I used various queue depths from 1 – 32 to
give you an idea how this SSD performs at different queue depths. For a normal
desktop user for lightweight multitasking, the queue depth will rarely rise
above 2. For heavy multitasking, the queue depth is unlikely to rise above a
value of 8.
The results are shown below.

As we can see, the Samsung 840 Pro scales well with
increasing queue depths, and reaches peak performance at a queue depth of
eight, where it is the fastest SSD at that queue depth.
Below I present a table of the results in more detail.

IOMeter 4K random read test.
If there are many 4k files created, then that must also mean
that many 4k files need to be read. This test measures 4k reading performance.
It is said that most 4K random reads take place at a queue
depth of only one, and readers have requested that I include this test in my
reviews.
Queue depth 1

Samsung 840 Pro 512GB SSD - 4K random read (Queue depth 1)

The Samsung 840 Pro is showing exceptional performance at
this queue depth, and is by a large margin the fastest SSD in this test.
Queue depth 4

Samsung 840 Pro 512GB SSD - 4K random read (Queue depth 4)

Once again the Samsung 840 Pro is showing exceptional
performance at a queue depth of four, and is again the fastest SSD by quite a
significant margin.
Queue depth 32

Samsung 840 Pro 512GB SSD - random read (Queue depth 32)

The Samsung 840 Pro is again the fastest SSD in this test,
and comes so very close to hitting that magical 100,000 IOPS.
4K random read queue depth profile.
This test shows how the review drive scales with increasing
queue depths.

Below I present a table of the results in more detail.

If we look at the Samsung 840 Pro 4K random read performance
in detail, we can see that it scales exceptionally well with increasing queue
depths.
IOMeter 512KB write test with repeating data.
Sequential writing performance is also very important; in
this test sequential writing performance is measured.

Samsung 840 Pro 512GB
SSD - 512K Sequential write with repeating data

The Samsung 840 Pro SSD has very good sequential writing
speed, but is ultimately outgunned by quite few SSDs in this test.
IOMeter 512KB sequential write test with fully random data.
This test is exactly the same as the test above except that
the test data is fully random in nature. This test was requested as SandForce
based SSDs gain a lot of performance by being able to compress data on the fly.
While the above test shows the SandForce based SSDs in a best case scenario,
the following test will show the SandForce based SSDs in a more realistic light.
In the real world, the data is neither 100% incompressible nor 100%
compressible, it is somewhere in between. So please keep this in mind.

Samsung 840 Pro 512GB SSD – 512K sequential write with fully random data

With data that is not so easy to compress, the SandForce SF-2281
based SSDs take a big hit in performance. On the other hand, the Samsung 840
Pro 512GB SSD is performing extremely well, and is the second fastest SSD in
this test. Rather oddly though, the Samsung 840 Pro writes incompressible data
faster than compressible data.
IOMeter 512KB sequential read test QD1.
This test measures 512k sequential reading performance at
very low queue depths.

Samsung 840 Pro 512GB SSD – 512K sequential reading test (Queue depth 1)

The Samsung 840 Pro 512GB SSD has exceptional sequential
reading performance at very low queue depths, and is the fastest SSD in this
test.
IOMeter 512KB sequential read test (dual threaded).
This test measures 512k sequential reading performance QD2.

Samsung 840 Pro 512GB SSD – 512K sequential reading test (Queue depth 2)

At a more realistic queue depth the Samsung 840 Pro 512GB is
still showing excellent sequential reading performance, and just nudges ahead
of the OCZ Vector.
IOMeter Workstation simulation (outstanding I/Os = 64).
When running applications you will find that there is a
mixture of small random files, and larger sequential files, being created and
read. Not only that, it isn’t just one file at a time. In this test I measure a
simulated workstation pattern, with a queue depth of 64 (threaded).

Samsung 840 Pro 512GB SSD – Workstation simulation

The Samsung 840 Pro 512GB SSD is performing well in the
workstation simulation, but I think it would be fair to say that its
performance profile is not optimised for a workstation environment, and the 840
Pro finishes this test in the middle of the pack.
Summary
There is no doubt about it, the Samsung 840 Pro has very
impressive performance. It is without doubt the fastest SSD when reading data
that I have tested so far. Writing performance is also of a very high standard,
but the Samsung 840 Pro is ultimately outgunned by a few SSDs when it comes to
writing performance.
Now let’s head to the next page where we will look at how
the Samsung 840 Pro SSD performs using a brand new benchmarking application....
Anvil’s Storage Utilities
As well as performing SSD endurance tests. Anvil’s Storage
Utilities has a very nice SSD benchmarking application. The SSD benchmark tests
many different aspects of SSD performance, including 4K random at different
queue depths, and also sequential performance, but more importantly than this,
all using real test data.
Another very nice feature of Anvil’s SSD benchmark is the
fact that you can change the compression levels of the test data. The
compression levels of the datasets used for the tests can be varied from 0%
compression right up to 100% compressed data, and there are even a few data
profiles already included, such as database (8%) compression, and also an
application profile (46%) compression, which is designed to simulate real application
data being read and written to the SSD.
Anvil’s Storage Utilities is still in beta at the moment,
but the application is currently solid enough to use in this article, and I have
already verified the results obtained using an SATA analyser.
I will include a screenshot of the review drive, and all
comparison results will be presented in the form of graphs. If you would like
to see screenshots of the test results obtained on the other SSDs in this
article, you can do so by following the link here.
I will also be testing three different compression profiles,
which are as follows.
- 0 fill (100% compressible data)
- Application simulation profile (46% compressed)
- 100% (non compressible data)
So let’s begin the tests.
0 fill

Samsung 840 Pro 512GB SSD 0 fill)

Writing score

Reading score

Total score
In the 0 fill test, the Samsung 840 Pro has performed
extremely well, and has the highest overall score in this test.
Application profile

Samsung 840 Pro 512GB SSD (application profile)

Writing score

Reading score

Total score
The application test pattern is much more realistic in terms
of the type of data that real users will use, and once again the Samsung 840
Pro is the fastest SSD in this test.
100% incompressible

Samsung 840 Pro 512GB SSD (100% incompressible)

Writing score

Reading score

Total score
With test data that can't be compressed at all, the Samsung
840 Pro has still finished in first place.
Summary
One should keep in mind that although Anvil’s Storage
Utilities SSD benchmark is a very good benchmark, and tests many aspects of SSD
performance, ultimately it is demonstrating which SSD is technically the
fastest, and this may not be showing (for example) which drive will be fastest
in the real world with a home user's work pattern.
The Samsung 840 Pro 512GB SSD has performed exceptionally
well in the Anvil's SSD benchmark tests, and has the highest score overall. This
really shouldn't be a surprise, as Anvil's SSD benchmark focuses on reading
performance, and the Samsung 840 Pro, as we have already discovered is the
fastest SSD when reading data.
Now let's head to the next page for some real world tests....
It has become clear that simply conducting endless
benchmarks on SSD drives is pointless. Real users may run a few benchmarks when
they first fit their SSD drive, but most users just want a drive that performs
well in the real world. They want their drive to work "out of the
box" and run fast and smoothly.
Most of the latest SSD drives can deliver very fast
sustained reading and writing speeds, but these alone tell you very little
about how the drive will perform in the real world.
If you intend to use your SSD as your primary system drive,
with an operating system and applications installed and running from the drive,
real world performance becomes much more important than just fast sequential
read and write speeds.
Real world copy
tests
I will now conduct a few real world copy tests. These tests
simulate what real people do with their drives. I will be conducting writing
tests, using a large single file, and I will then round off the tests by
copying a folder of MP3 audio files, and also a folder of JPG pictures.
In past reviews I simply used Windows copy and paste to copy
the files from one drive to the target drive, and then I measured the time
taken to complete the test with a stop watch. This method was flawed in a
couple of ways. Windows employs a cache, so even when the files had been
copied, some of the data was still in the Windows cache and hadn't yet been
written to the SSD. The other flaw was that a stop watch is not a very accurate
way of measuring the time taken to complete the test.
I had also noticed that copying the small file set had
become pointless, as most modern SSDs have a rather large cache, in fact large
enough to be able to take the complete file set in this cache without having to
commit that data to NAND before the test had completed. I could have increased
the amount of data in the test, but I felt this was moving away from the real
world. For example, who would copy 2GB of data containing only very small
files?
I concluded it was perhaps better just to drop this test
completely, and just focus on the large 8GB ISO file, the folder of MP3 audio
files, and the folder of JPG picture files. I also have taken the opportunity
to increase the amount of data to be copied in the MP3 and JPG tests, to make
sure the SSD's memory cache can't obtain an unfair advantage.
The other change is, I now use an application to copy the
data, which also times how long it take to complete the test. This application
also supports "cache write-through". What this basically means is, there
is now no caching of the files, and instead the data being copied must be
committed to the target SSD as its being copied.
Obviously making such changes to the methods of testing is
not taken lightly. To make changes means a lot of extra work, as all the
comparison drives have to be re-tested with the new method. However, here at
Myce.wiki, we believe we should always try to improve our reviews, and if that
means updating the testing methods and some initial extra work, then that benefits
the whole Myce community.
For the reading drive, I had to make sure that it was fast
enough not to be holding back the target drive. For the reading drive I have
chosen the OCZ RevoDrive X2 PCIe SSD. The OCZ RevoDrive X2 is capable of
reading speeds of 740MB/s, and also sits on the low latency PCIe x16 system
bus.
For the tests themselves, I will show a screenshot of the
copy test for the SSD that I'm reviewing. All other results will be presented
in the form of a graph, so you can easily compare the results.
Single large file writing test (8144.6MB)
For this test I used a single DVD9 ISO file which had been
copied to the OCZ RevoDrive X2 240GB SSD. The file was then copied to the Samsung
840 Pro SSD and our comparison drives.

Samsung 840 Pro 512GB SSD

The large ISO file contains quite a lot of incompressible
data which is detrimental to the SF-2281 based SSDs. Incompressible data is no
problem for the Samsung 840 Pro, and which is showing excellent performance,
finishing this test in fourth place.
Write a folder of JPG picture files.
For this test I copied a folder of JPG picture files from
the OCZ RevoDrive X2 SSD to the Samsung 840 Pro 512GB SSD, and our other
comparison drives. The folder contained 7861 JPG pictures, with a total
capacity of 8410.3MB.

Samsung 840 Pro 512GB SSD

Once again, the Samsung 840 Pro 512GB SSD is showing excellent
performance, and finishes this test in fourth place.
Write a folder of MP3 audio files.
For this test I copied a folder of MP3 audio files from our
OCZ RevoDrive X2 SSD to the Samsung 840 Pro SSD and our other comparison drives.
The folder contained 1691 MP3 audio files, with a total capacity of 9176.5MB.

Samsung 840 Pro 512GB SSD

Once again the Samsung 840 Pro is showing very good
performance and finishes this test in fifth place.
Summary
We already know the Samsung 840 Pro has excellent writing
performance, and essentially these tests are based on writing performance. What
these tests do show is that in the real world, the Samsung 840 Pro is very
capable of excellent writing performance.
Single drive copy tests
These tests are to simulate a single drive in a PC or
laptop. In other words, I will copy a series of files from one folder on the
tested drive to another folder on the same drive. This means the drive is simultaneously
reading and writing during the tests. I also want to make this a realistic test,
so I have used a folder of MP3 music files, and then repeated the test with a
folder of JPG picture files.
Single drive copy tests – 1,691 MP3 song files (9176.5MB total)

Samsung 840 Pro 512GB SSD

With this test the SSD has to read and write data, and what
this test does show is that the Samsung 840 Pro has excellent performance,
finishing the test in second place.
Single drive copy tests – 7,861 JPEG picture files (8410.3MB total)

Samsung 840 Pro 512GB SSD

Once again, the Samsung 840 Pro is showing excellent
performance, and is again finishes the test in second place.
Windows start-up and closedown
For these tests, I simply used a stop watch and tested the
amount of time taken for a full installation of Windows 8 to boot to the
desktop, and then timed how long it took for Windows 8 to close down by the
normal Start Menu method.
The timing was started once the BIOS had initialised and
reached the “loading OS message”.

Windows 8 boot time

Windows 7 closedown
There is very little difference in the time taken to boot
Windows 8 between the modern SATA 6Gbps SSDs, and the same applies to the time
taken to shut the PC down.
Installing applications
Installing applications is possibly something you don't do
that often. But should you replace your system disk, then you will most likely
have to re-install your applications. Most of the SSD drives I have tested up
until now are quite slow at installing applications, most likely because their
I/O performance was quite limited.
For these tests, we picked some popular applications and
copied the entire contents of the CD or DVD media to an OCZ RevoDrive x2 240GB
SSD. We did this to make sure that the reading speed of our CD/DVD reader would
not hamper the performance of the target drive.
We then installed these applications onto our comparison drives,
which were all running mirror image installations of our Windows 8 Professional
64-bit installation, and timed the amount of time taken to install the
application with a stopwatch on each of the drives.
MS Office 2007 Professional (full install)
MS Office is one of those applications that make you cringe
at the thought of re-installing it.
Let's find out how our drives coped with the MS Office 2007
full install.

The Samsung 840 Pro showed an excellent turn of speed when
installing this large office suite, and finished the test in third place.
Adobe Fireworks CS3
Adobe Fireworks CS3 is another popular package. Let's find
out how our drives coped with installing this application.

There isn’t a huge margin in the amount of time taken to
install this application with our modern SSDs. However, the Samsung 840 Pro
finishes in fifth place in this test.
Summary
Our real world tests, though not scientific in nature, I
feel are more realistic than simply running benchmarks. What is clear from these
tests is that the Samsung 840 Pro 512GB SSD has excellent performance in the
real world.
Let’s check out application and game loading performance
on the next page of this article.....
These tests are very simple tests, but very important to
some users of SSD drives.
We simply started an application or game, and measured the
time taken for the application or game to fully load and start.
Application loading times
Adobe Fireworks CS3

These types of tests are becoming pretty pointless, as there
is so little difference in tangible performance between the modern SSDs.
However, the Samsung 840 Pro loads this large application in 3.36 seconds, and
finishes the test in first place.
Corel PaintShop Pro 12

Again, I doubt anyone could tell difference from the fastest
to the slowest modern SATA 6Gbps SSD, as they are all very close, but for
posterity the Samsung 840 Pro tops the table.
Games loading times
FAR CRY 2
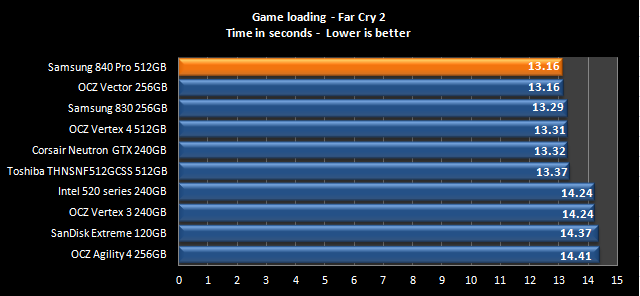
This time the Samsung 840 Pro shares the top spot with the
OCZ Vector, although I would doubt anyone could really notice the difference
when compared to any of these SSDs.
F.E.A.R. 2
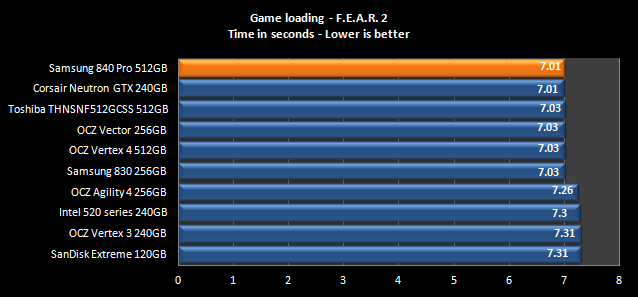
This time the Samsung 840 Pro shares the top spot with the
Corsair Neutron GTX.
Summary
By now it's is becoming very clear that the Samsung 840 Pro
SSD delivers excellent performance, and its top of class reading performance
has ensured that it's either fastest, or very close to being the fastest SSD in
these tests.
Now let’s round off this article with the Myce Reality
Suite tests on the next page.....
MyCE Reality Suite (storage).
So what is the Myce Reality storage test?
The Myce Reality Suite of tests is made from real everyday
applications and real data, there are no simulated tests, and everything is in
the real world. The only thing that's synthetic is that everything is automated
to make the tests fair, no matter which drive the tests are run on.
Recorded user sessions, by means of a script, are used to
launch the applications, load data, edit data, and then finally write that data
back to the target drive. The scripts do load the system much more than a human
could with these tests, as the scripts do not make mistakes, or pause to think
about what has to be done next.
Measurement system (revision 2)
The measuring system is part hardware and part software. The
hardware is proprietary and under an NDA, but what I can tell you is: The
measuring system can now accommodate SATA2, SATA3, and USB3.
Testing method.
Once all the test data files were complete, they were then
copied to a single folder. I then fitted an old 80GB HDD into the PC and did a
clean install of Windows 7 Home Premium x64. The latest hardware drivers were
installed and Windows update was run to install any new updates that were
available up to 08/01/2012. At this point the applications that were to be used
in the tests were installed and updated with the latest patches.
The folder containing the application test data files was
then copied over to our fresh Windows 7 HDD. The drive was cleaned up and then
the four test scenarios were recorded, with the scenario playback data file
which will run each test scenario saved to the desktop. A drive snapshot was
then taken of the complete HDD and the drive snapshot image copied to a second
HDD for safe keeping.
The image is then simply restored to each of the SSDs on
test. After imaging the drive the partition is then realigned “on the fly” and the
free space is filled and then deleted to force TRIM. A 20 minute settling time
is allowed before the tests are run, then each of the 4 tests is run and the
results gathered. This process is repeated for each of the drives I am testing.
The test scenarios are as follows.
- Graphics content
- Video editing
- Audio import and compression
- Application multitasking
Let’s begin the tests.
Myce Reality Suite – Graphics content.
Using ACDSee Pro 3, 100 JPG pictures with an average size of
10MB are imported into the ACDSee library, and then 12 of these JPG files are
then selected for a batch process, of resize, compress the quality to 80%, and
finally write the edited pictures back to the drive. The test is approximately
78% read and 22% write.
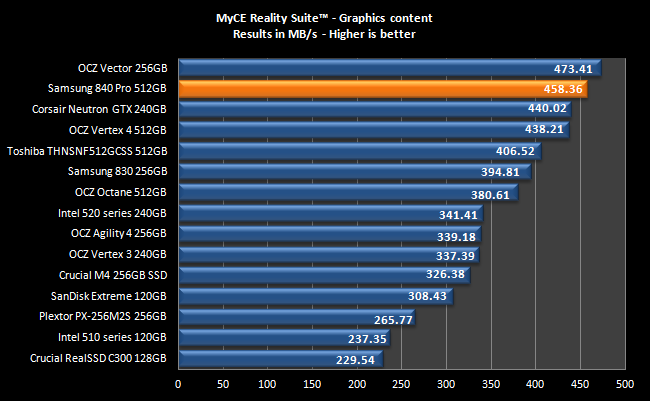
This result threw up a little bit of a surprise. The test is
78% reading and 22% writing, and one would have expected the Samsung 840 Pro,
with its outstanding reading performance to have been the fastest SSD. It does
come close, but the OCZ Vector proved to be a little bit faster.
Myce Reality Suite – Video editing.
Using Vegas Pro, a 14GB HD MPEG2 video stream is loaded into
the editor, from which 2 segments are then cut and pasted into new segments. There
is a lot of disc caching going on in this test, and the test is approximately
55% read and 45% write.
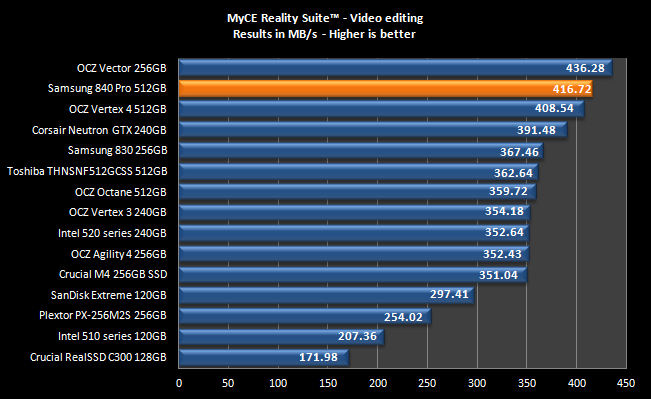
Once again the Samsung 840 Pro is showing excellent
performance, and finishes this test in second place.
Myce Reality Suite – Audio import and compression.
Using Sony Sound Forge 10, a batch process is run consisting
of 30 24bit (192000 Hz sample rate) .wav files, and 100 16bit (44100 Hz sample
rate) .wav files are imported and then converted to MP3 audio files with a bit rate
of 128kbps, and the converted files are written back to the drive. The test is
approximately 72% read and 28% write.
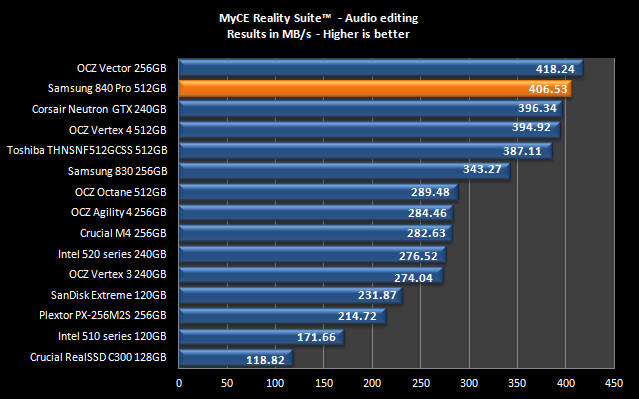
Once again we have a test that favours reading performance,
but again the OCZ Vector is a bit faster than the Samsung 840 Pro. We shall
find out why in the summary.
MyCE Reality Suite – Application multitasking.
For this test I used several popular applications, Microsoft
Word 2007, Microsoft Access 2007, Microsoft Excel 2007, Microsoft Outlook 2007,
Adobe reader, Adobe Photoshop CS3, uTorrent, Windows media player, and Internet
Explorer 9.
This session runs for approximately 12 minutes. The test is
started by downloading a Linux distribution via uTorrent, Windows media player
is then opened, and a 1080p video file is opened and played for the duration of
the test. Microsoft Outlook is opened and any new emails are received, read,
then replied too, a document in Adobe reader is opened and scrolled from start
to finish, 3 Microsoft Word documents with graphics content are opened, browsed
and some sections of the documents are copied and pasted into a forth document
and then saved back to the drive. The same applies to Microsoft Access and
Excel. 100 MP3 files are imported into Windows media library. Six JPG images
are loaded into Adobe Photoshop and some minor editing is done and the files
saved back to the drive.
Finally, Internet Explorer 9 is opened with 10 tabs, and the
contents of the 10 tabs refreshed, and browsed while the other applications are
busy in the background.
I would describe the multitasking pattern as moderate to
heavy.
During this test there is approximately 85% reading and 15%
writing.

With queue depths higher, in this test the Samsung 840 Pro is
able to show what it can really do when pushed hard, and is performing
extremely well, finishing the test in top spot.
Summary
I firmly believe that the Myce Reality Suite gives a very
good overall picture of how a drive can perform in the real world, and in this
case, the Samsung 840 Pro 512GB SSD is clearly an extremely fast SSD.
Let's go back to the two "reality" tests that gave
us a little surprise when the Samsung 840 Pro finished just behind the OCZ
Vector. Having examined the test data more closely, I believe I have found the
reason why. Sequential reading queue depth average for the test is 2.62. If we
go back to the IOMeter results (Sequential reading test QD2) then we can see
that the Samsung 840 Pro and the OCZ Vector are very close in that test. Given
the OCZ Vector's superior writing performance, then I believe this is why the
OCZ Vector had a slight advantage in those two tests.
Now let’s head to the next page, and see how well the
drive performs after heavy use....
Speed degradation after heavy testing
On this page I will test how the SSD performs after heavy
testing and usage, and also how the SSDs perform when the amount of data stored
on the SSD increases.
I now have a new policy as to how I go about testing an SSD.
In the past I would deliberately try and get an SSD into a “used state”, by
filling the drive several times before starting the tests. This seemed to work
quite well up until the SandForce based SSDs appeared, but because of the way
the SandForce controller works, it was near impossible to tell if deliberately
trying to get a SandForce based SSD into a “used state” had actually worked or not.
A new strategy was required. So now I begin the tests with
the SSD in a clean state and allow it to look after itself during the testing
period. I start off the tests by running AS SSD benchmark. This gives me the
“as new” reading and writing performance of the SSD.
Once all the tests have been completed, the drive is then
tested as a system drive, and just used normally for many days which will also
includes idle time (this is something I have always done with a review sample).
At the end of the period, the drive is filled to capacity and then all files
are deleted from the drive and then a “quick format” is performed.
The last test is a rerun of AS SSD benchmark, and the result
from the final test is compared with the first run when the SSD was in an “as
new” state.
Let's find out what happens.
New state 02/12/2012

Used state 13/12/2012
With 5.18 Terabytes of data already written to the drive
during a testing period of 11 days, one would have expected the performance to
have dropped off slightly, and this is the case, but the drop in performance is
marginal, and the Samsung 840 Pro is still performing extremely well.
Filling up the SSD with data
For obvious reasons, when an SSD is tested, the drive is
always tested as a spare drive, and is generally always empty (no data on the
drive) during the synthetic benchmarks. There is no other way of having a level
playing field for all the SSDs under test. This of course changes during the
real world tests we conduct here at Myce.wiki.
Real users of course don't buy an SSD for it to remain
empty, and how full the SSD will eventually become varies from one user to the
next. What I thought would be useful is to run tests on the SSDs with real data
on the drives, and at different levels regarding how full the drive is.
For these tests the SSD is connected as a spare, and I test
at three different levels.
- Level 1: There an operating system installed on the
SSD, and all the applications that I use are also installed. In my case
that amounts to approximately 44GB of data on the SSD. - Level 2: The SSD is filled to 60% of its formatted
capacity. - Level 3: The SSD is filled to 80% of its formatted
capacity.
For the 60% and 80% tests, the type of data varies from
compressible to incompressible data, and file sizes range from a few Kilobytes
to very large files of several Gigabytes, then a single run of Anvil's SSD
Benchmark is run (100% incompressible).
It is also worth noting that the larger capacity SSDs will
tend to slow down less than their smaller counterparts, as the larger SSDs will
have more free NAND available to work with.
Level 1: Operating system and applications installed.

Samsung 840 Pro 512GB SSD - Operating system and applications installed.
Level 2: SSD filled to 60% of its formatted capacity.

Samsung 840 Pro 512GB SSD - Filled to 60% of the drive's formatted capacity.
Level 3: SSD filled to 80% of its formatted capacity.

Samsung 840 Pro 512GB SSD - Filled to 80% of the drive's formatted capacity
In the graph below, I present the results.

Filling up an SSD with data can certainly cause a slowdown
to occur on some SSDs, as we can see from the table above. Filling up the
Samsung 840 Pro with data caused no such problems, and it is still maintaining
its performance extremely well.
Myce Sustainable Performance Test
Over the last four months I have been studying countless
analyzer traces of real computing workloads, and also developing a test that
would accurately emulate and measure how performance is sustained over a period
of time. For obvious reasons, it is not possible to test an SSD review sample
over several months before publishing a review. The solution was to condense
this down to a manageable test, that doesn't take too long to run.
I will make it clear right from the outset that this is not a
torture test. Bringing any SSD to its knees is not helpful in the least, as I
for one would not use any SSD that had slowed down to crawl, just to prove a
point. The Myce Sustainable Performance test, I believe is a tough, but
sensible test pattern to use for measuring how an SSD will be behave once it's pushed
hard over a period of time.
The test pattern is "workstation" based, and
closely emulates a typical video or graphics workstation environment. The
results are measured using the same hardware I use for the Myce Reality Suite
tests, however, the test data and measuring system use a different method.
From the 80% full test listed above, I already have an SSD
with a lot of data on it. Adding to the data that is already there, the
"Sustainable Performance" test data is added. This test data is
approximately 20GB is size, so once this is added the SSD is pretty full.
The test is then run for a period of 20 minutes. 60
performance measurements are taken for every minute of the test, and an average
performance figure is generated after each minute. At the end of the test I
have 20 performance measurements which are then used to generate the graph
below.
The faster SSDs will obviously sustain more writes then the
slower SSDs. For the fastest SSD in this test, the test pattern generated 146GB
of writes, and 193GB of data was read from the SSD during the test.
When reading the graph, you should not pay too much
attention to which drive is the fastest, but instead look at the sustainable
performance curve of each SSD, as this is what this test is all about.
For the SSD that I am reviewing, I will also add a second
graph which looks at the result in more detail.
So let's look at the results.

Sustainable Performance test

Detailed results of the review drive
We knew from the previous Anvil's SSD benchmark tests that
the Samsung 840 Pro could maintain performance with a short burst test when it
was pretty full of data. The Myce Sustained performance test is a much tougher
challenge for any SSD. The test pattern used for the test is workstation based,
and we already know that a workstation environment is not a strong point of the
840 Pro from the IOMeter workstation test run.
What this test does show is, that garbage collection on the
Samsung 840 Pro is not as efficient as the garbage collection on the OCZ
Vector, and the Samsung does slow down a bit when it runs out of clean NAND to
work with. The slowdown isn't huge, and as we can see from the table above, is
that it only drops by 25 MB/s by the time it reaches the end of the test.
This concludes our review. To read the final thoughts and
conclusion, click the link below....
Final thoughts and the conclusion
User experience
A modern operating system such as Windows 8 rarely does one
thing at time; it processes hundreds of threads at once. Just take a look at
the processes and services that are running in task manager for an idea of how
much is going on, even with the PC idling at the desktop. When you start
running applications on top of this, the workload increases in line with the number
and type of applications you are running. It’s also fair to say that many of
these processes are already loaded into system RAM, but many are also loaded into
and unloaded from RAM to the system drive as and when they are required.
If we look at the 4 basic requirements for a really fast
SSD, they are as follows.
- Small file threaded performance needs to be high.
- Small random file performance needs to be high.
- Sequential read and write speeds needs to be high.
- Fast access times.
The Samsung 840 Pro SSD has all of the above attributes and
then some, and feels very snappy in use as a system drive.
Stability
I have only had the Samsung 840 Pro SSD for a few days, so
it’s not possible to comment on the drive's long term reliability, and
unfortunately it's on short term loan so I will not be able to do any long term
testing. What I can say is that during the testing period, the Samsung 840 Pro
has been 100% stable, and has caused no problems whatsoever.
The Samsung 840 Pro is as “plug n play” as it gets. There
are no special tweaks needed other than simply making sure that AHCI SATA mode
is enabled in the system UEFI (BIOS), and installing the latest Intel RST SATA
drivers if you want to get the best performance and compatibility out of this
SSD.
Conclusion:
Let us summarise the most important positive and negative
points below:
Positive:
- Silky smooth operation as a system drive.
- Outstanding sequential reading performance, even at very
low queue depths. - Outstanding 4K random reading performance at low and high queue
depths. - Excellent writing performance.
- SATA 6Gbps support.
- TRIM support under Windows 7 and Windows 8.
- Fast access times.
- Completely silent operation.
- Excellent Magician software.
- Fast operating system start-up and shutdown times.
- 5 year warranty
Negative:
- Nothing to mention.
To sum up, this is what I
would say:
The Samsung 840 Pro is an exceptionally good SSD, it's fast
and stable, and has an excellent performance profile for a desktop PC. Had I
got hold of this SSD a couple of months ago and conducted this review then, the
Samsung would have been head and shoulders above every other SATA SSD I have
tested. As things worked out, I received the 840 Pro review sample only a
couple of weeks ago, and by that time, I had already started to test the OCZ
Vector.
The Samsung 840 Pro no longer has it all its own way. The
Samsung 840 Pro is without doubt the fastest SSD when it comes to reading
performance, but the OCZ Vector is a good deal faster when writing data, and
can also maintain its writing performance better when under heavy load.
We have seen throughout this review that these two SSDs have
slogged it out in the tests. In some cases the Samsung 840 Pro is faster, and
in other cases the OCZ Vector was the fastest. However, something is very clear
in my mind. Both the Samsung 840 Pro and the OCZ Vector stand head and
shoulders above the rest of the SSDs featured in this article. That is not to
say that the other SSDs in this article are not good SSDs, as in fact, they are
all very good SSDs.
I actually wrote the above paragraphs yesterday, and I
couldn't make a call on which SSD I would prefer myself, the Samsung 840 Pro or
the OCZ Vector. I decided to sleep on it, but having slept on it I still can't
pick a winner today, as they are both astounding SSDs, and to say one of these
SSDs was to play second best would be doing that SSD a big injustice. So let's
call it a draw.
Stop press
A new firmware has just been released by Samsung for the 840 Pro. The firmware
DXM04B0Q, is said to improve writing performance when the NAND is in a dirty
state. Unfortunately, the review sample has already been returned to Samsung,
so I can't test the new DXM04B0Q firmware, although I hope to receive a smaller
capacity 840 Pro sometime soon for review, and I will of course test how the new
firmware handles writes when the NAND is in a dirty state.
Price
I found the Samsung 840 Pro 512GB SSD at Overclockers
UK for £449.99 including VAT.
For our USA members, I found the Samsung 840 Pro 512GB SSD
at Newegg
for $599.99.
The parting sentence is
“The Samsung 840 Pro is an exceptionally good SSD, it's
astonishingly fast, and it's also very stable”.


You may comment on this review below.
Thanks to:
|
|
EFD Software for |
|
|
Alex |
|
|


")


