 |
Review: Reviewed Provided Firmware
|
Introduction and Market Positioning
Welcome to Myce’s review of the Samsung PM863 Enterprise
SSD.
The PM863 is available in capacities of 120, 240, 480, 960,
1,920, and 3,840GB. The 960 GB drive is the subject of this review.
Logically, the PM863 replaces the 845DC EVO in Samsung’s
product portfolio. The PM863 introduces the use of 32 Layer, 3D TLC
V-NAND (another first for Samsung) whereas the 845DC EVO used 2D TLC NAND.
Will the PM863 improve upon the 845DC EVO which we awarded
our ‘Outstanding’ rating? Please read on to find out.
Market Positioning and Specification
Market Positioning
This is how Samsung positions the PM863 –
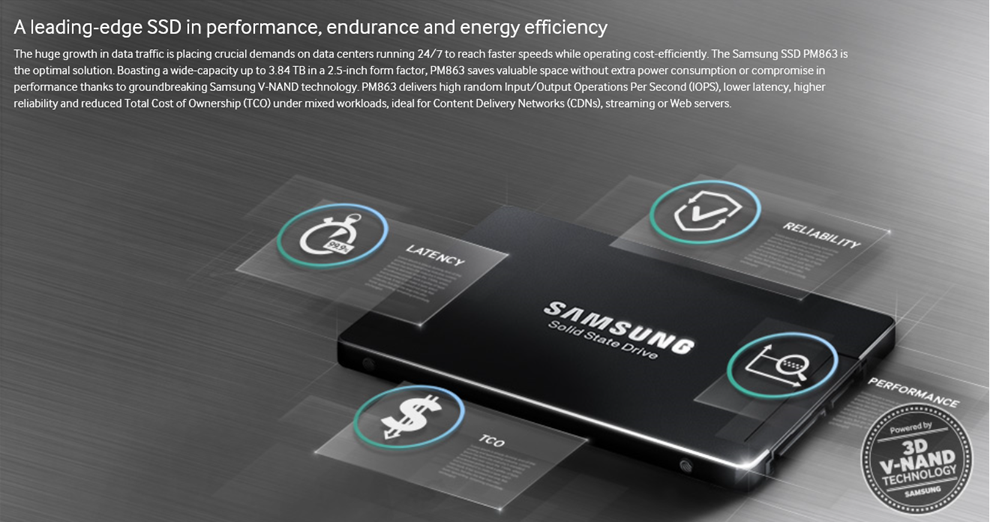

The PM863 targets read intensive applications and warrants
endurance at 1,400 TBW (Terrabytes Written) over 3 years (which is equivalent
to 1.33 DWPD). Samsung has also introduced the SM863 (which succeeds the
outstanding 845DC PR0) to target higher endurance requirements. The SM863 uses
32 Layer, 3D MLC V-NAND and we will be reviewing this drive in the near future.
Samsung is also asserting that the PM863 achieves a higher
level of consistency (a better Quality of Service) than their previous
generation of drives. We shall look at this aspect closely in this review.
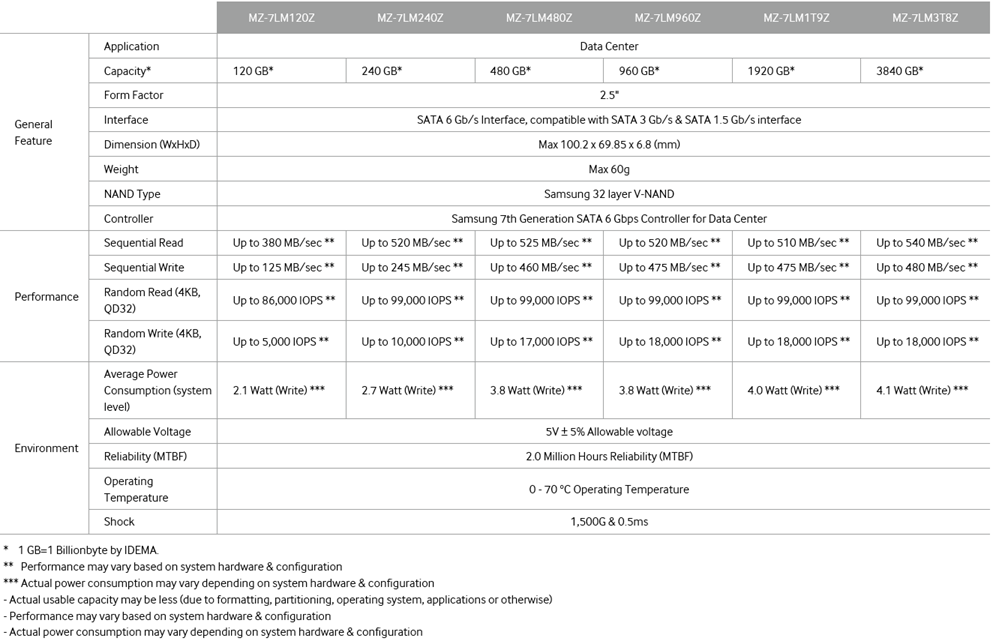
Specification
Here is Samsung's specification for the PM863 –
Here is a picture of the PM863 -
I understand that the PM863 uses Samsung’s proprietary
Mercury controller.
You can see that the PM863 has the, now familiar, Samsung
black plastic case.
Now let's head to the next page, to look at Myce’s
Enterprise Testing Methodology.....
Testing Methodology
Please click
here
to view or download a detailed introduction to Myce’s Enterprise Class Solid
State Storage (‘SSS’) Testing Methodology as a PDF.
Put briefly:
All testing is performed on an OakGate Technology test unit
We perform two sets of Performance Tests:
1.
A full set of the Storage Network Industry Association’s (‘SNIA’) tests
with mandatory parameters, as specified in their Solid State Storage
Performance Test Specification Enterprise V1.0.
2.
A set of tests, known as the ‘Myce/OakGate Full Characterisation Test
Set’, that provides readers with a fuller characterisation of the solution.
Comprehensive power consumption testing is performed using
Quarch hardware as documented here.
We also review other important factors such as Data
Reliability and Failover features.
A word about SNIA testing – before striking a partnership
with OakGate Technology I spent some time researching how I might implement
SNIA testing using freely available tools such as IOMeter and FIO. I arrived
at the conclusion that whilst it was theoretically possible it was
impractical. The reason for this is as without the automation offered by a
test bench, such as the OakGate Unit, the only way to meet the SSS PTS
requirements is to run the maximum number of test cycles and then to manually
look back at the results to determine when/if steady state has been achieved in
the workload specific test cycle, and then harvest the data from the qualifying
Measurement Window. This means that the test runs would always take a maximum
elapsed time, and there would be a great deal of human effort required to
review, gather, and report upon the data. I empathise with, acknowledge, and
respect the efforts of other reviewers who endeavour to meet the SNIA’s
principles in their testing - I am privileged and thankful to be able to use a
superb test bench which automates the whole process and allows me to meet the
SNIA’s specification in full.
Before we move on, let’s remind ourselves of some basics –
When reviewing the performance of an SSS solution there are
three basic metrics that we look at:
1.
IOPS – the number of Input/Output Operations per Second
2.
Bandwidth – the number of bytes transferred per second (usually measured
in Megabytes per second, ‘MB/s’)
3.
Latency – the amount of time each IO request will take to complete
(usually, in the context of SSS solutions, measured in Microseconds, which are
millionths of a second).
It is true to say that IOPS and Bandwidth had all been
growing rapidly before the advent of SSS solutions, but Latency can only be significantly
decreased by eliminating mechanical devices, and thus Latency is the single
most important aspect that SSS solutions deliver to enhance performance.
Latency in a technical environment is synonymous with delay.
In the context of an SSS solution it is the amount of time between an IO
request being made, and when the request is serviced.
Bandwidth, also commonly referred to as ‘Throughput’, is the
amount of data that can be transferred from a storage device to a host, in a
given amount of time. In the context of SSS solutions it is typically measured
in Megabytes per second (MB/s).
A great enterprise SSS solution offers an effective balance
of all three metrics. High IOPS and Bandwidth is simply not enough if Latency
(the delay in an IO operation) is too high. As we will see in the test results
presented below, as Latency increases IOPS will inevitably decrease.
Queue Depth is the average amount of IO requests outstanding.
If you are running an application and the Average Queue Depth is one or higher
and CPU utilisation is low, then the application’s performance is most probably
suffering from a ‘Storage Bottleneck’.
Another important factor to remember is that SSS performance
is influenced by previous workloads, not just the current workload, and
especially by what has previously been written to the drive. As specified in
the SNIA SSS PTS the goal of all good Enterprise level testing is to provide
consistent circumstances, so that results can be compared fairly across
different SSS solutions – it is for this reason that all of our tests start
with a purge of the drive, so that it starts in a ‘Fresh Out of the Box’ (FOB)
state. Most tests then have a pre-conditioning phase where the drive is put
into a ‘Steady State’ before the test phase begins. Put briefly, a ‘Steady
State’ is achieved when the performance of the drive no longer varies over time
and settles into a consistent level of performance for the workload in hand. You
can find a detailed explanation of ‘Steady State’ and how it is determined in
the SNIA tests in our Enterprise Testing Methodology paper, which can be viewed
or downloaded as a PDF by clicking here.
For interest, here are some
generally accepted assumptions that differentiate the use and therefore the
approach to testing Enterprise/Server and Consumer/Client SSS solutions:
Enterprise/Server SSS
assumptions:
1.
The drive is always full
2.
The drive is being accessed 100% of the time (i.e. the drive gets no
idle time)
3.
Failure is catastrophic for many users
4.
The Enterprise market chooses SSS solutions based on their performance in
steady state, and that steady state, full, and worst case are not the same
thing
Consumer/Client SSS
assumptions:
1.
The drive typically has less than 50% of its user space occupied
2.
The drive is accessed around 8 hours per day, 5 days per week, and
typically data is written far less frequently
3.
Failure is catastrophic for a single user
4.
The consumer/client market generally chooses SSS solutions based on
their performance in the FOB state
Esther Spanjer, Director, Enterprise
Business Development EMEA at Sandisk, said, 'I am happy to commend Myce for
their high level of professionalism and cooperation during the review process',
Ms. Spanjer added, 'I wish them every success in their partnership with OakGate
Technology and their initiative to provide authoritative performance reviews
for the Enterprise Solid State Storage market'
Now let's head to the next page, to look at the results
of our SNIA IOPS (Input/Output Operations per Second) Test.....
SNIA IOPS Test
IOPS performance will typically vary greatly depending on
the nature of the IO traffic, including the mixture of Read and Write
operations, and the mixture of Block Sizes (the size of the IO operation’s data
packet, also referred to as IO Size). This test is designed to benchmark the
IOPS performance profile for random IO operations for 56 different combinations
of Read/Write mix % and Block Sizes when in a Steady State, which are of
interest to most users.
All of the SNIA’s test specifications define a ‘required’
set of parameters that must be run for the test and then allow the operator to
elect to run additional tests with different parameters of their choice. It is
the mandatory test with the required parameters that we run. Note that all of
the mandatory SNIA tests must be conducted with fully random data
As previously mentioned, a key principle of SNIA testing is
to provide a consistent basis for comparing different solutions from different
manufacturers.
Here are the results –
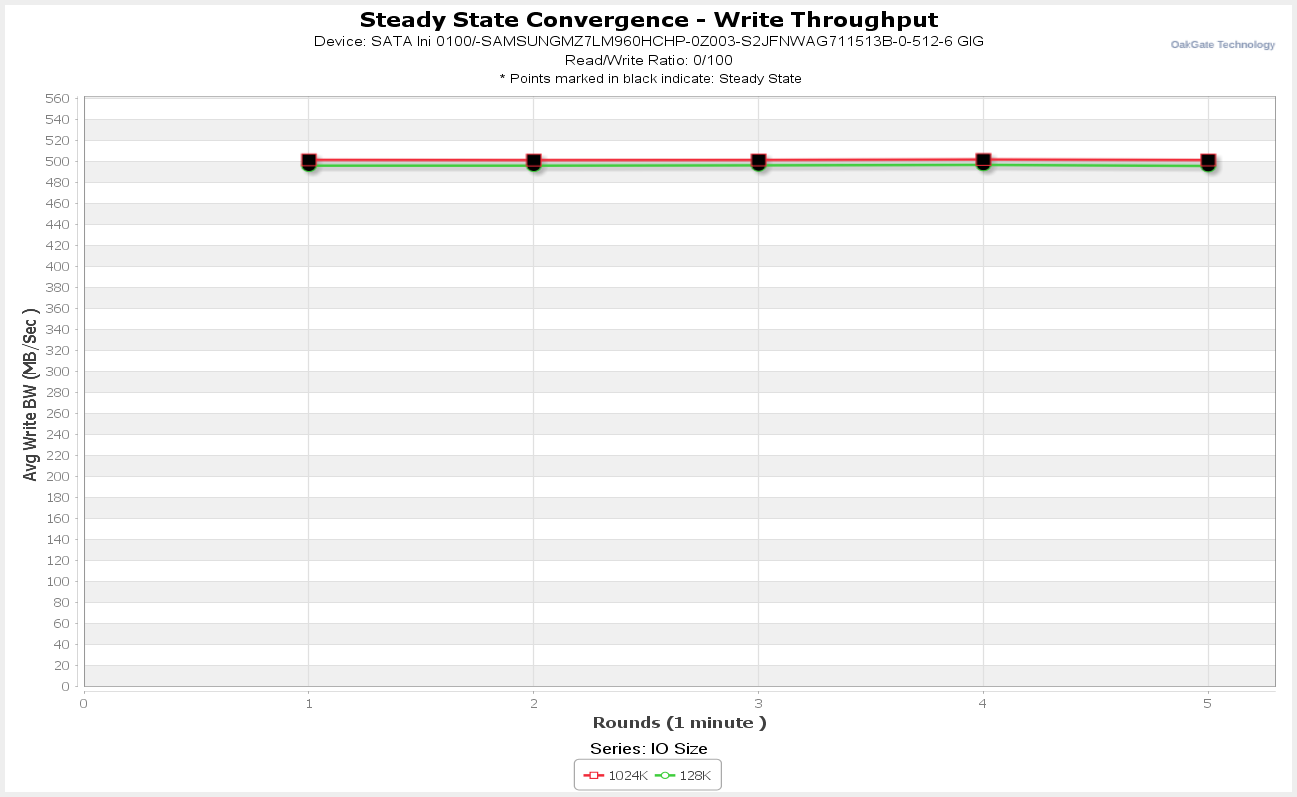
SNIA IOPS Test
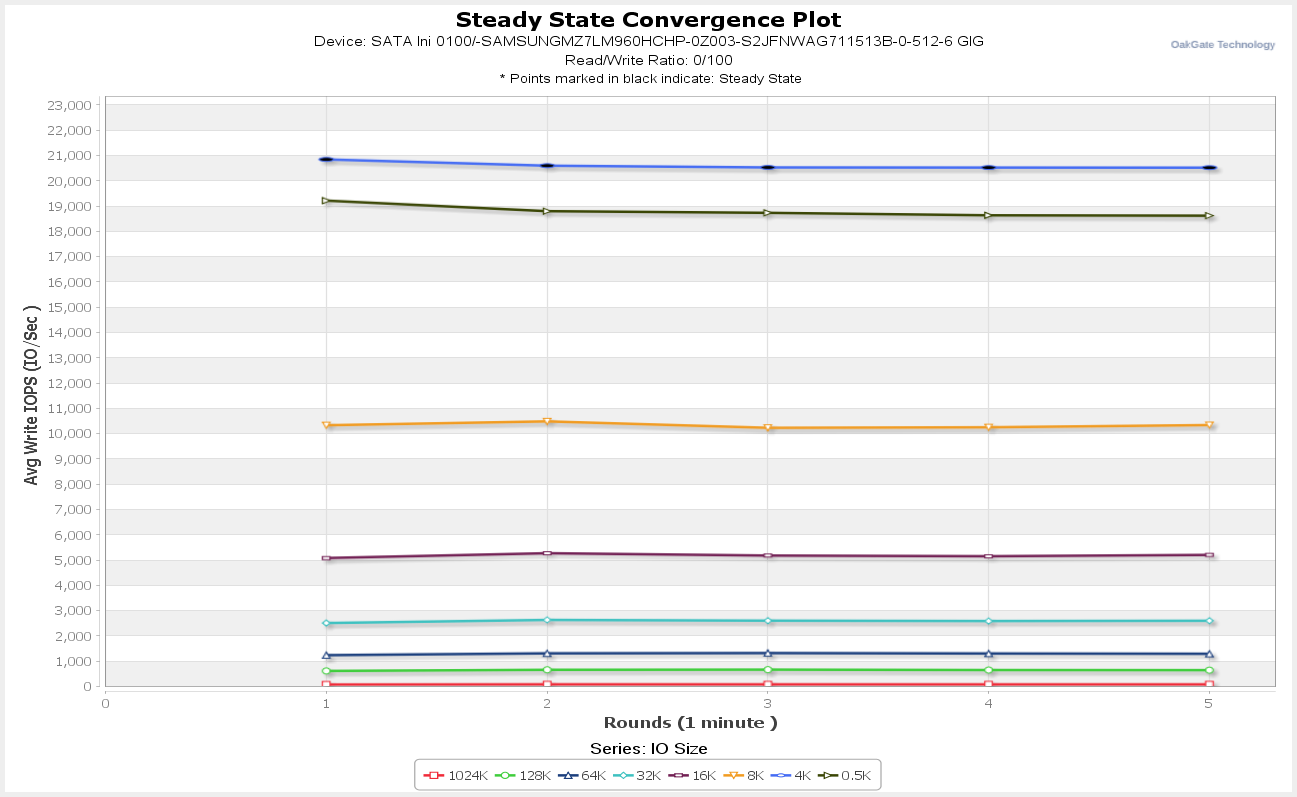
Here you can see a visual confirmation that Steady State
Convergence was determined at the end of Round 5 (note that steady state
convergence is calculated from the 4K line).
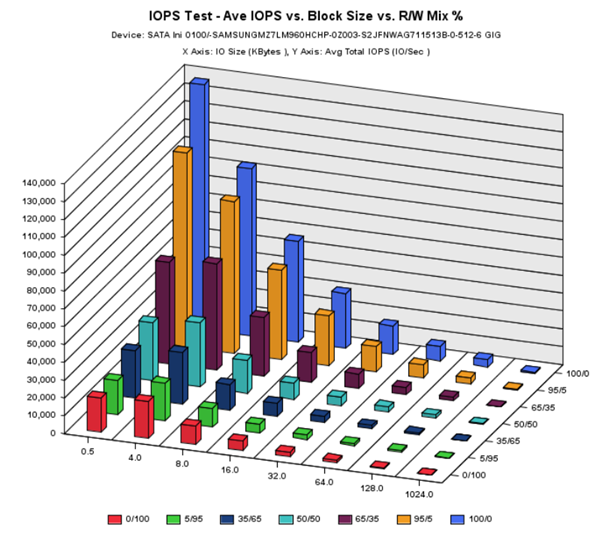
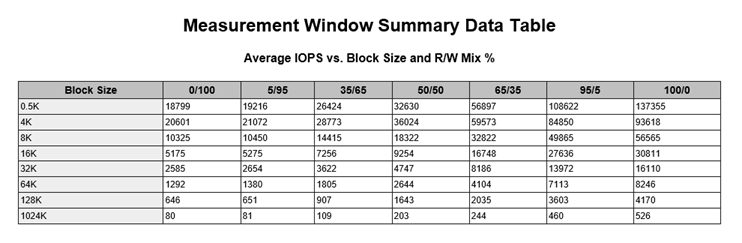
Here is a 3D and tabular presentation of the results. Users
can simply refer to the grid to obtain the R/W mix and Block Size value of
interest. For example, Online Transaction Processing applications
typically run at a Block Size of 8K and a Read/Write Mix of 65/35, and users
can quickly understand how the device might perform under Steady State for
these access characteristics.
You can see that the 4K 100% Read IOPS result is 93,618,
which is somewhat less than Samsung’s specification of 99,000 but nevertheless
impressive. The 4K 100% Write IOPS result is 20,601, which is somewhat more
than Samsung’s specification of 18,000.
SNIA IOPS Test - Product Comparison
For interest we present a comparison of the 4K 100% Writes
and Reads results with those of the other Enterprise SSDs we have tested –
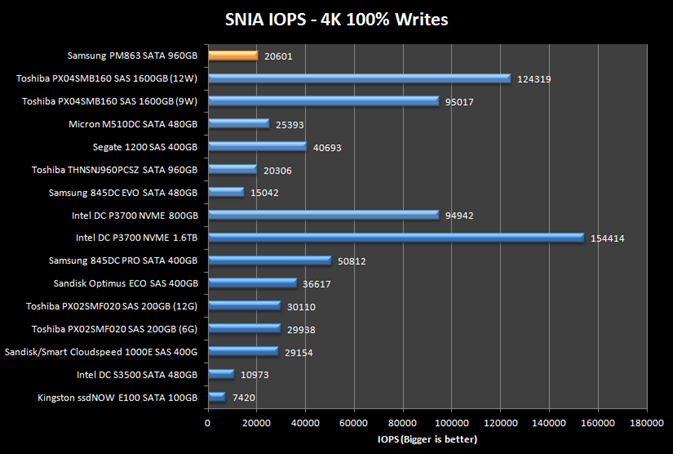
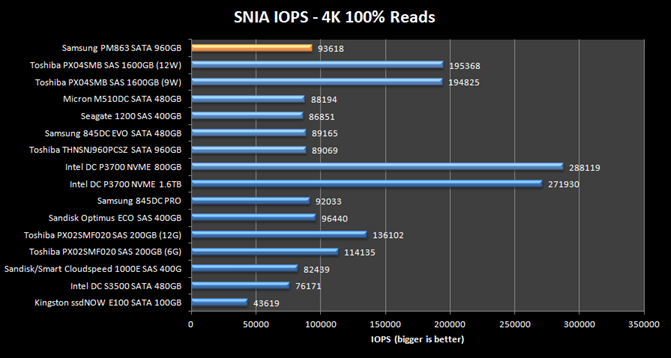
Random Read performance is excellent, especially for an SATA
drive.
Now let's head to the next page, where we look at the
results of the SNIA Write Saturation Test.....
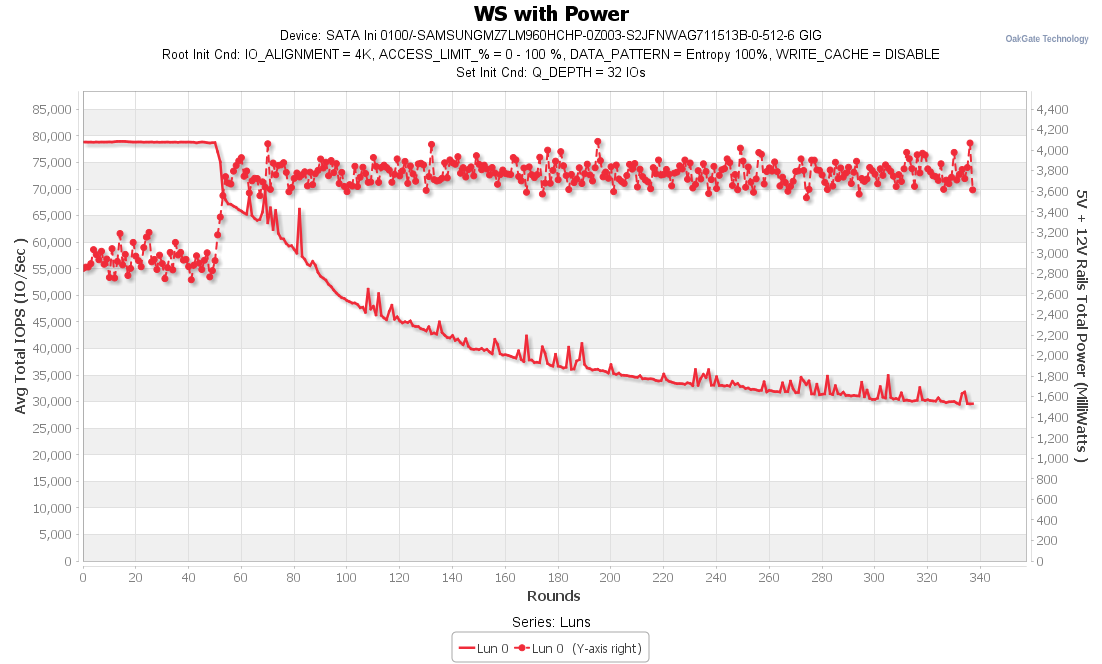
SNIA Write Saturation Test
This test performs random 4K writes.
The objective of this test is to observe the time evolution of
the drive’s performance, as a function of time, from a ‘factory fresh’, ‘fresh
out of the box’ (‘FOB’) state. When a drive is in a FOB state (e.g. after it
has been purged by, for example a SATA Secure Erase or SCSI Format), we can
expect an initial period of time when writes can easily be accommodated by
clean/empty blocks, but once all of the clean blocks have been written to once
and the drive’s controller must first clean blocks (with erase write
operations) before it can write new data, then we can expect a slow down. The
slow-down is usually quite dramatic and is commonly referred to as the ‘write
cliff’.
The Write Saturation Test is
easy to run as it requires no steady state determination – it can be easily run
in freely available software, such as IOMeter.
Here are the results –
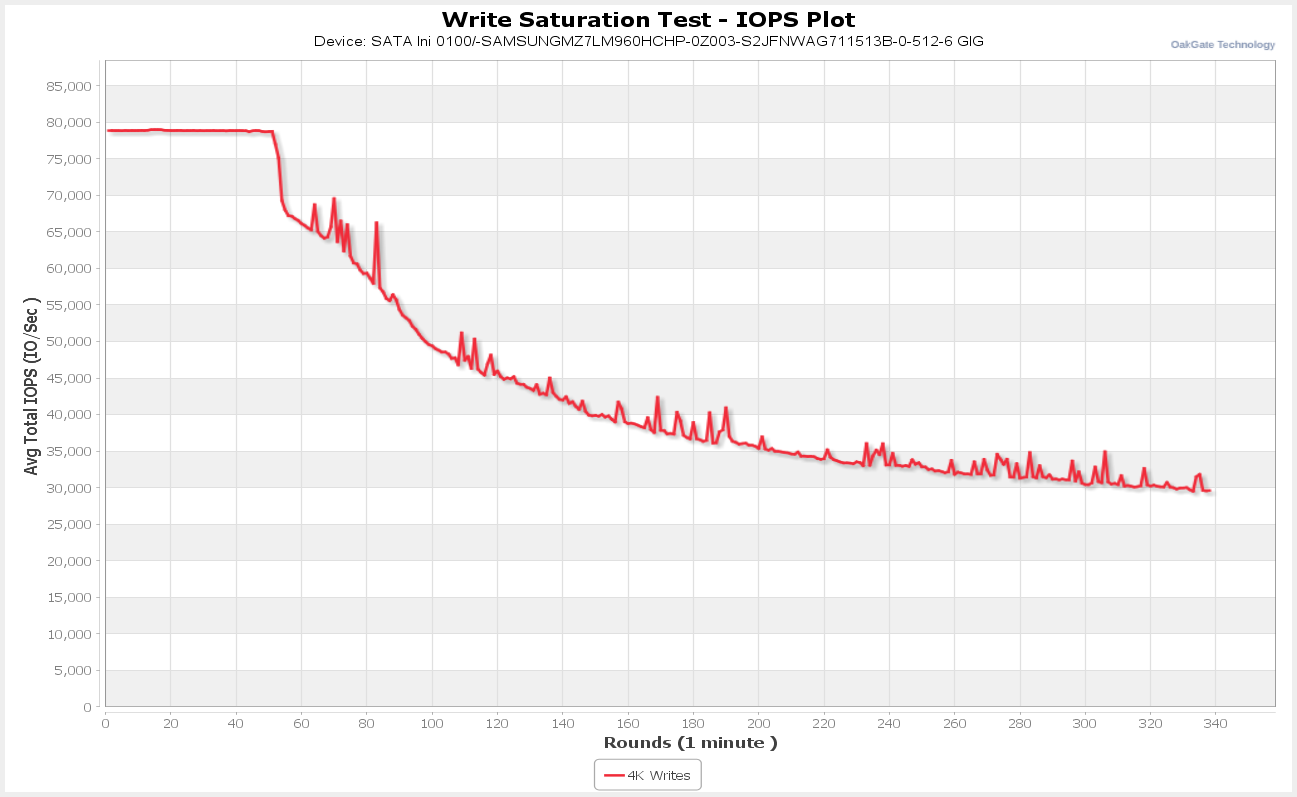
Interestingly, a typical ‘write cliff’ isn’t apparent and a
gradual decline towards a steady state begins at round 46. It’s also apparent
that a steady state hasn’t been achieved at the time the test was halted.
We’ll take a closer look at this behaviour in the Myce/Oakgate 4K Latency Tests
later in this review.
Note that the test was halted, as specified in the SNIA SSS
PTS, when 4 x the User Capacity had been written to the drive.
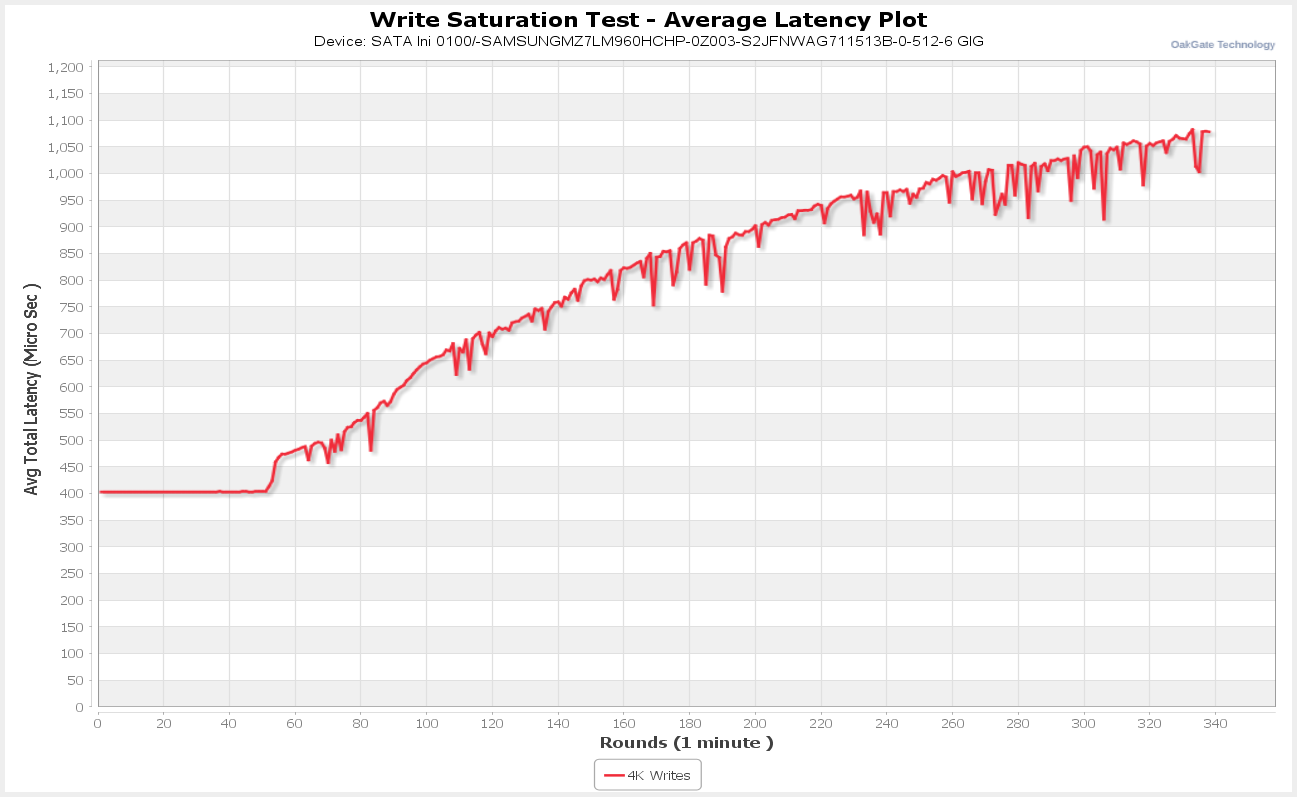
You can also see that the latency graph line is a mirror
image of the IOPS graph line.
Now let's head to the next page, to look at the SNIA
Throughput Test.....
SNIA Throughput Test
The test is designed to measure the Sequential Read and
Write IO performance for two Block Sizes, when under Steady State conditions.
One can easily compare the results produced by this test with box-top numbers,
which are usually stated as “Up to xxx MB/S”.
Here are the results –
You can see here a visual confirmation that Steady State was
achieved for both Write IO sizes by the end of Round 5.
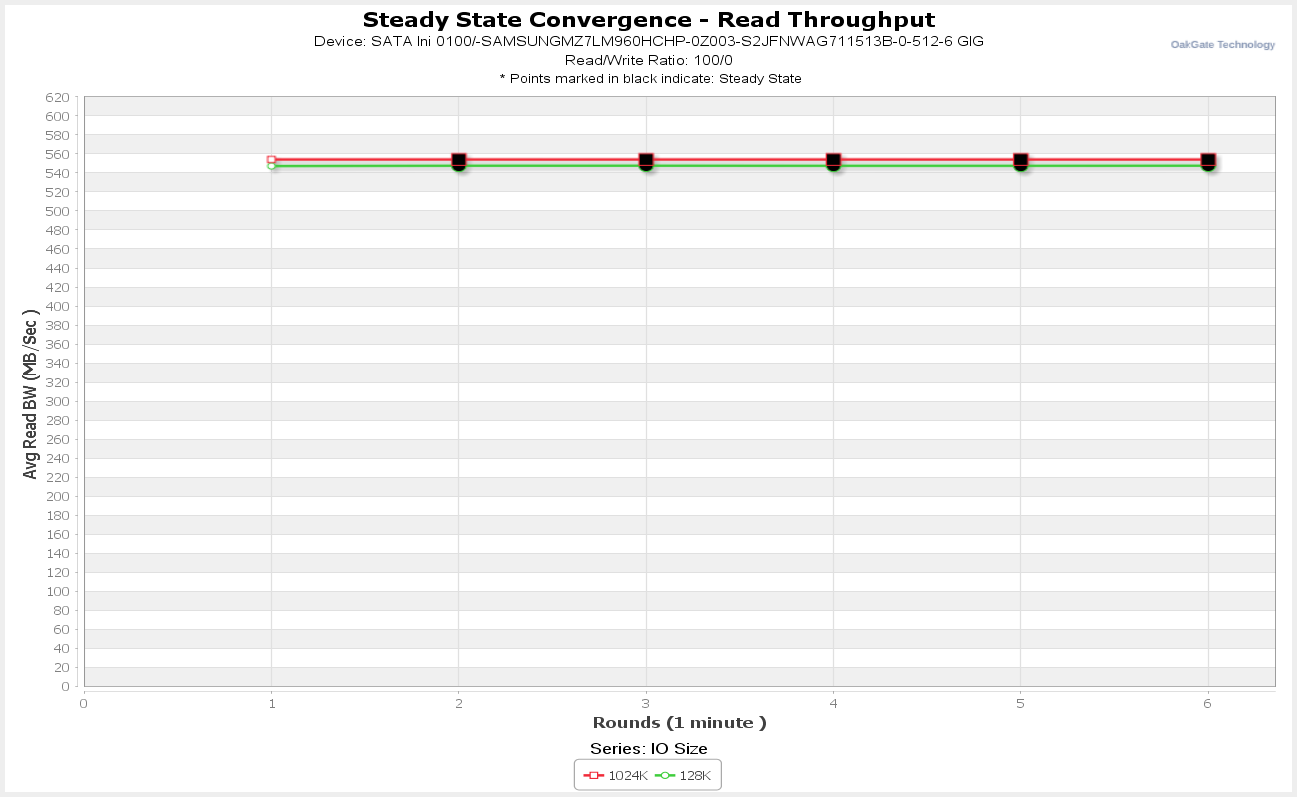
You can see here a visual confirmation that Steady State for
both Read IO sizes was achieved by the end of Round 6.
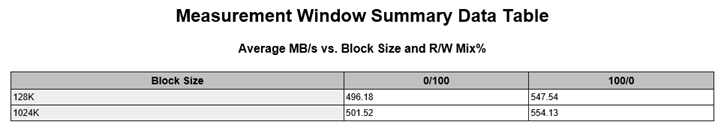
Here are the average values recorded in the measurement
window –
SNIA Throughput Test - Product Comparison
For interest we present a comparison of the 1024K sequential
reads and writes (single port) performance in comparison with those of the
other Enterprise SSDs we have tested –
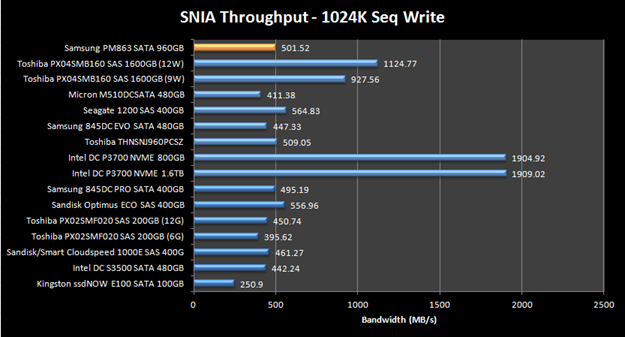
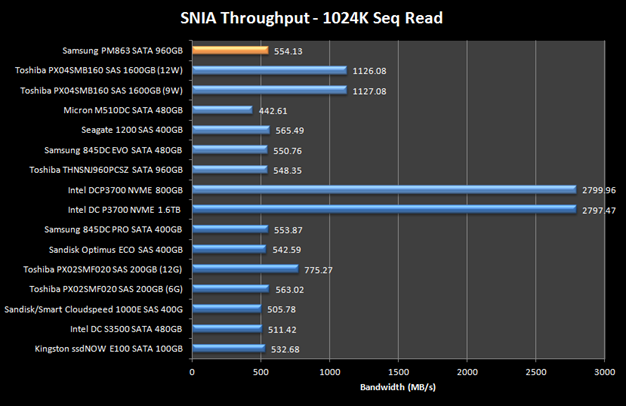
These are
excellent results.
Now let's head to the next page, to look at the results
of the SNIA Latency Test.....
NEW PAGE
NEW PAGE NEW PAGE NEW PAGE
The Latency Test measures average and maximum response times
using random IOs at specified Block Sizes and Read/Write mixes, taken under
steady state conditions. The test runs at a Queue Depth of 1 (1 outstanding
IO), thus the results give the baseline response time for a single IO request.
The test also reports maximum latency values, which can be
helpful to see if there might be processes within the drive that may cause max
Latency values to become larger.
Here are the results –
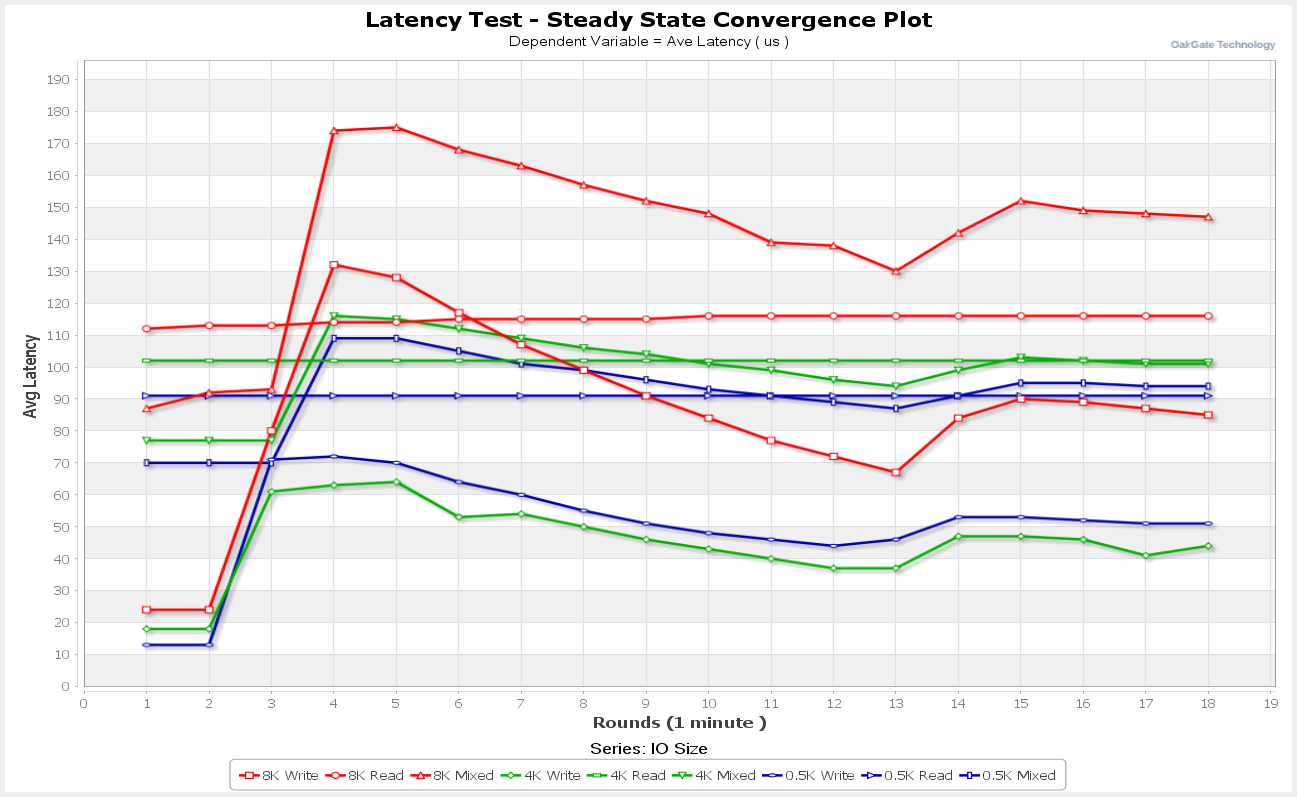
You can see here that Steady State was achieved in Round 14
through Round 18 (the ‘Measurement Window’). Note that the 4K Write line is
used to determine the achievement of steady state.
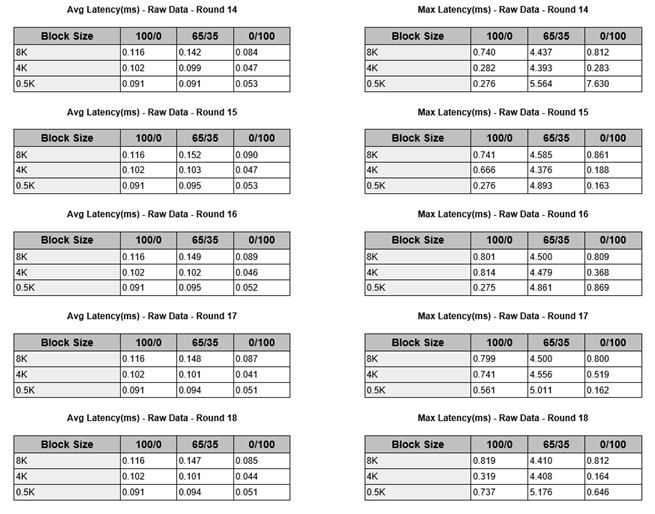
These are the Average and Maximum Latency Values observed in
each round of the Measurement Window (measured in Milliseconds).
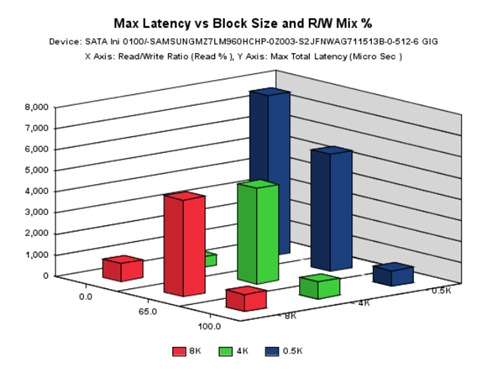
Here is a 3D graph showing, at a glance, the Maximum Latency
values for each combination of Read/Write Mix and IO Size.
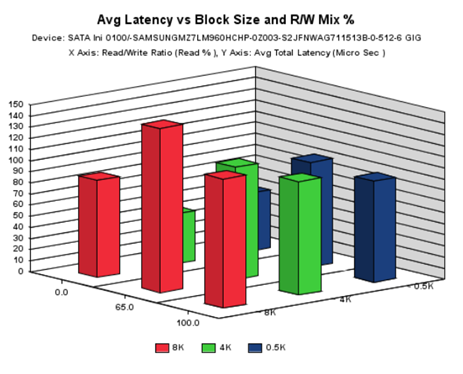
Here is a 3D graph showing, at a glance, the Average Latency
values for each combination of Read/Write Mix and IO Size.
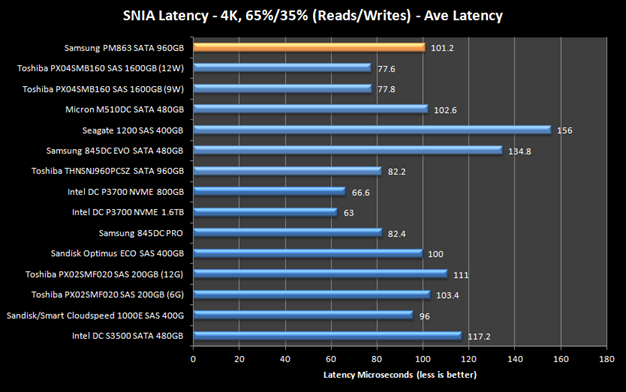
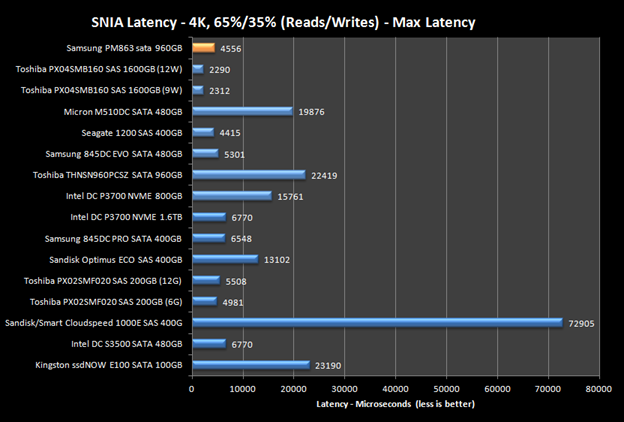
SNIA Throughput Test - Product Comparison
For interest we present a comparison of the 4K 65% Reads 35%
Writes latency results in comparison with those of the other Enterprise SSDs we
have tested –
Now let's head to the next page, to look at the results
for the Myce/OakGate 4K Read and Write Latency Tests......
Myce/OakGate 4K Read and Write Latency Tests
These tests steadily increase the random 4K IO demand in
terms of IOPS, and report the drive's response in terms of Average IOPS, Average
Latency and Maximum Latency. It is designed to show a drive’s maximum IOPS
capability and report the all important Latency numbers for each level of IOPS
demanded. The Maximum latency numbers give us an insight into the occurrence
of Latency peaks that could cause an unexpected response from time to time.
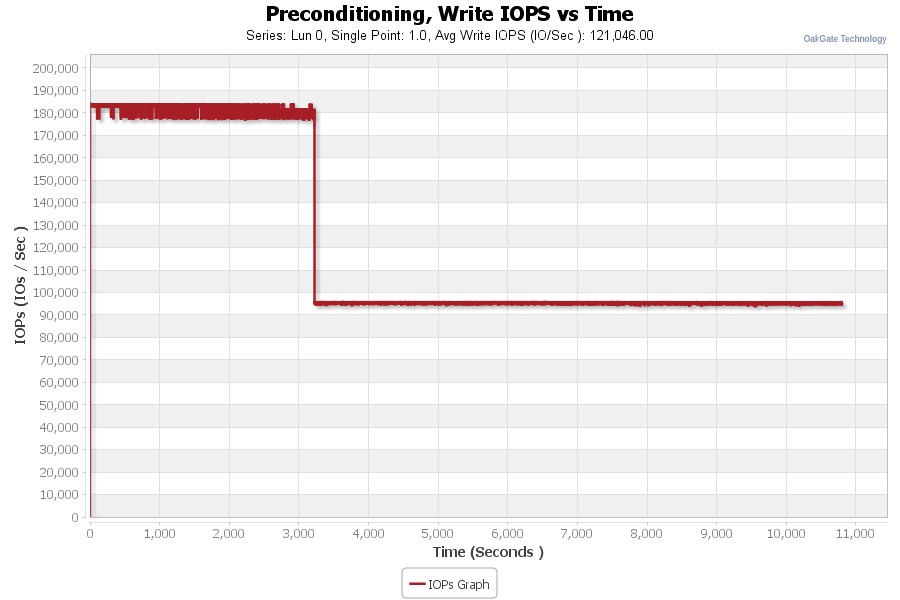
Firstly, here are the results for the initial
Pre-Conditioning step (4K Random Writes) –
Myce/OakGate 4K Read and Write Latency Tests
Preconditioning -
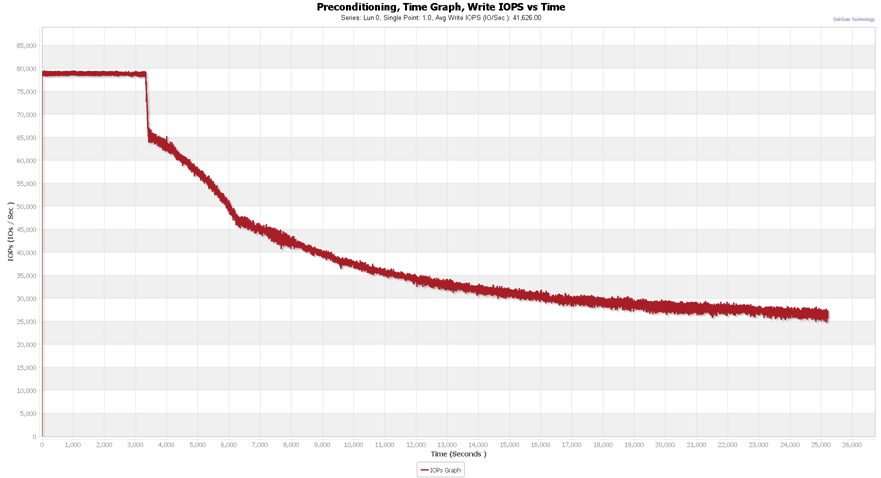
Here we can
see that even after just under 7 hours the PM863 still hasn’t settled into a
steady state. So, I decided to see what difference an initial pre-fill step,
of performing sequential writes would make -
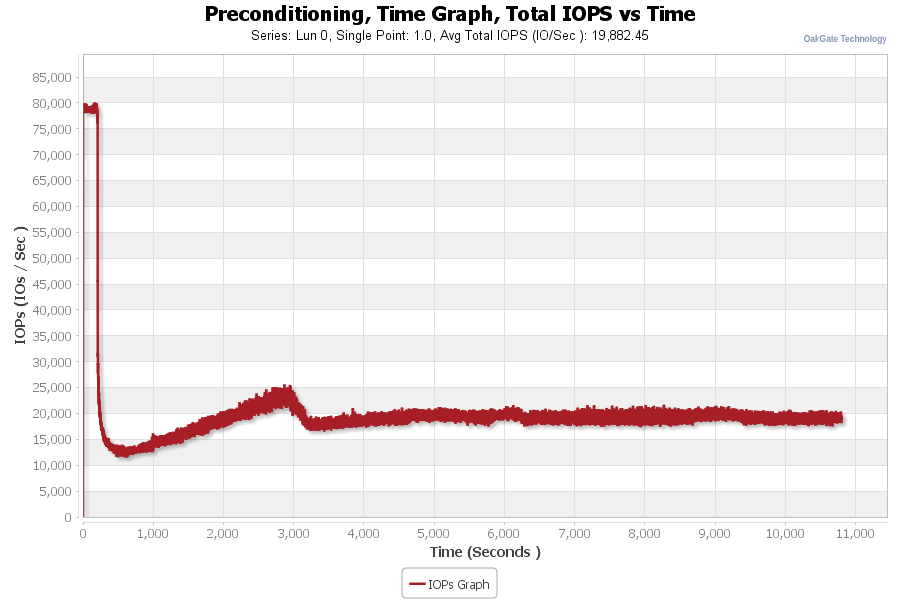
In this preconditioning phase performing 4K Random Writes
has been preceded by performing 128K Sequential Writes to 200% of the PM863’s
total capacity. I understand that the key difference this makes is to ensure
that all of the PM863’s LBA’s (Logical Block Addresses) have been written to as
well as every physical block. You can see that following the pre-fill step the
drive has settled into a Steady State (of around 18,000 IOPS – bang on
Samsung’s specification) relatively quickly. The difference must be down to
the way in which the PM863’s controller/firmware works and it is apparent that
the drive remains faster when all of the LBAs (Logical Block Addresses) have
not been written to.
For interest, this can be compared to the preconditioning
result that we observed recently for the Toshiba PX04SMB160, which did not have
a pre-fill step, and where there is a marked write cliff directly followed by
the immediate achievement of a Steady State once each physical block has been
written to -
The preconditioning phase with a pre-fill step was then used
to precede all of the following Myce/Oakgate Tests.
I must admit that I don’t know why drives should present
such a difference, depending on whether each LBA has been written to, but it is
clear why the SNIA tests specify a pre-fill step as a way to facilitate the
achievement of a Steady State.
4K Latency Read Test
Myce/OakGate 4K Read Latency Test
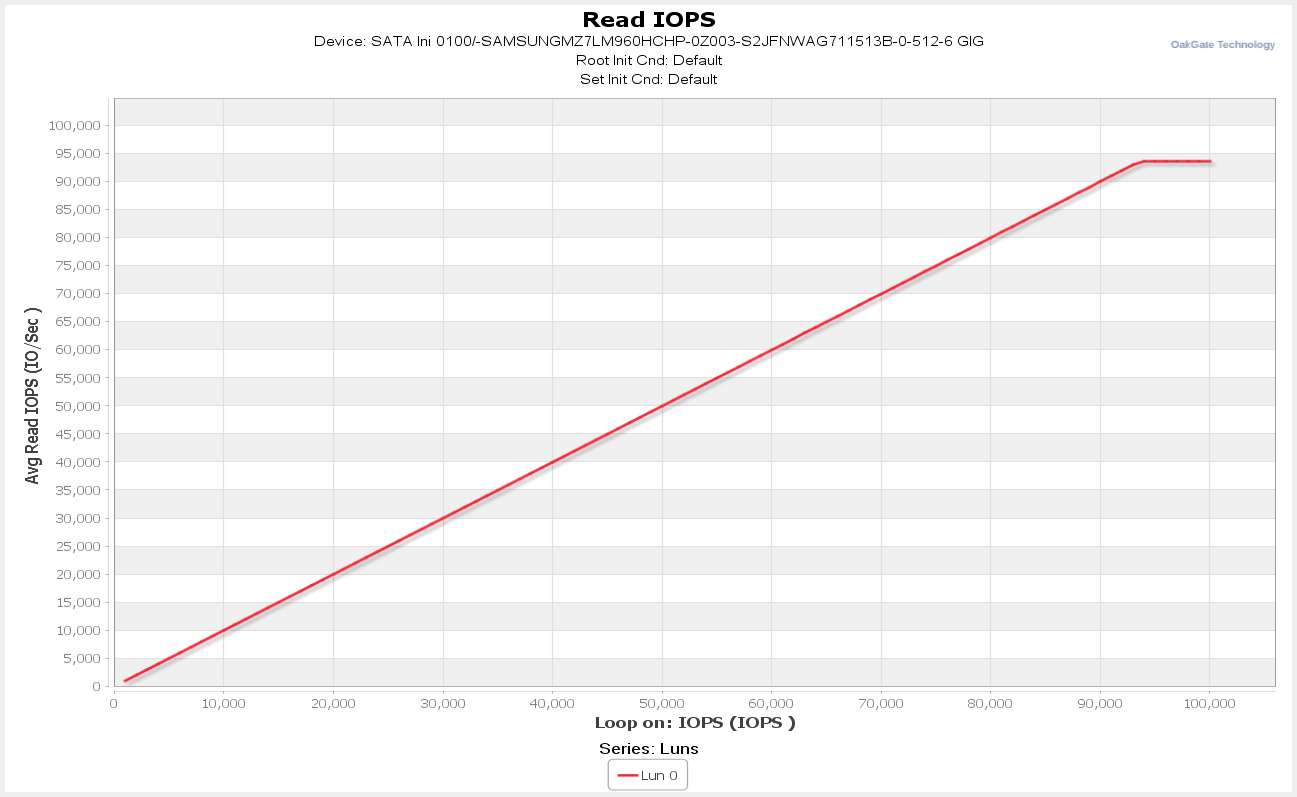
We can see that the drive can no longer meet the increase in
IOPS demand beyond 93,000 IOPS.
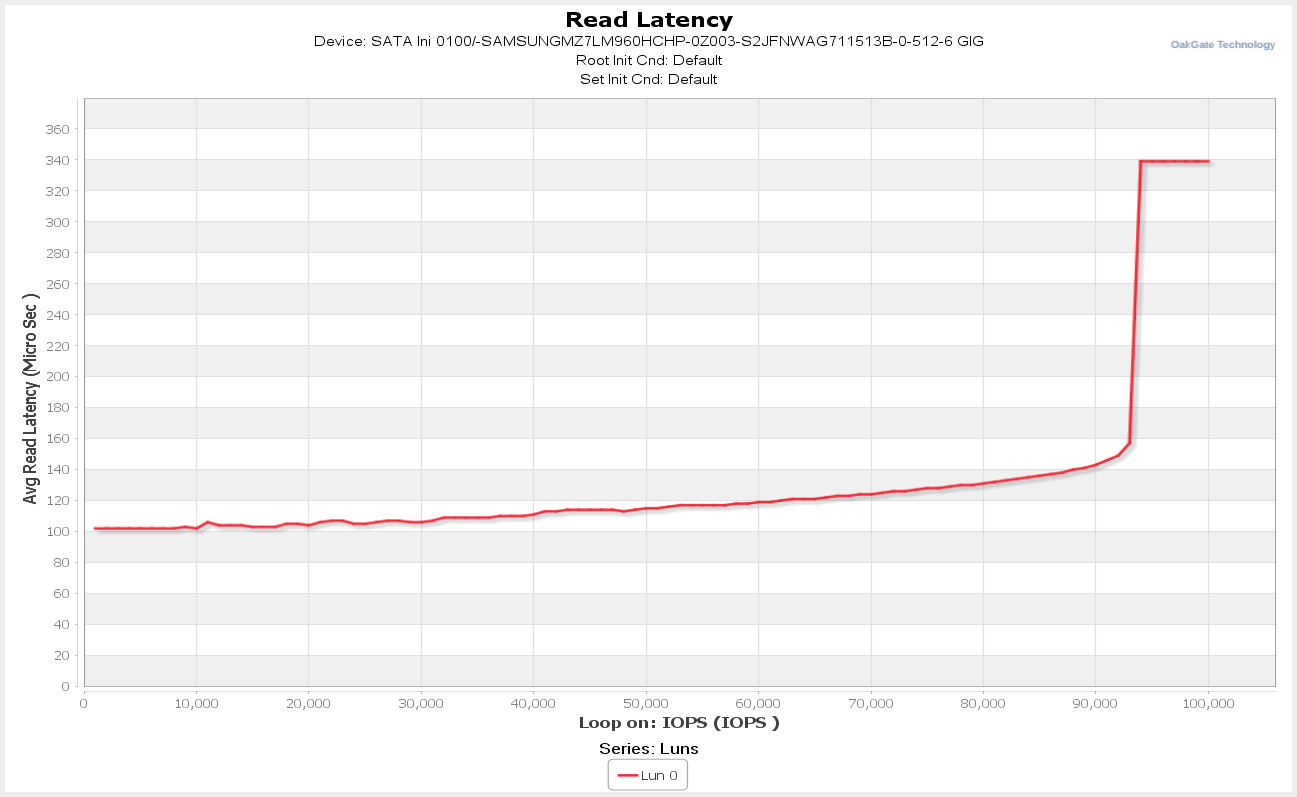
We can see that read latency remains below 160 microseconds
all the way up to its maximum IOPS level. This is an outstanding result.
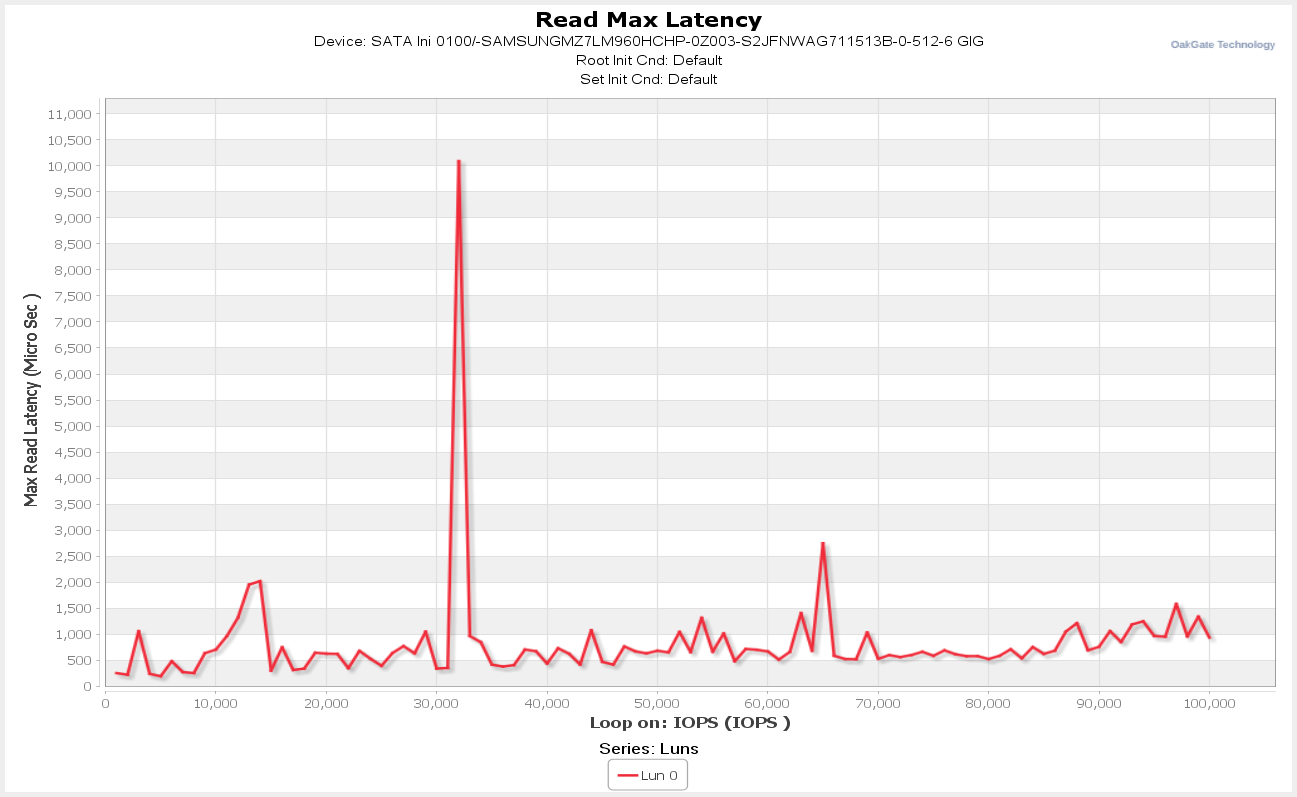
We can see a clear Maximum Latency spike at the 32,000 IOPS
level.
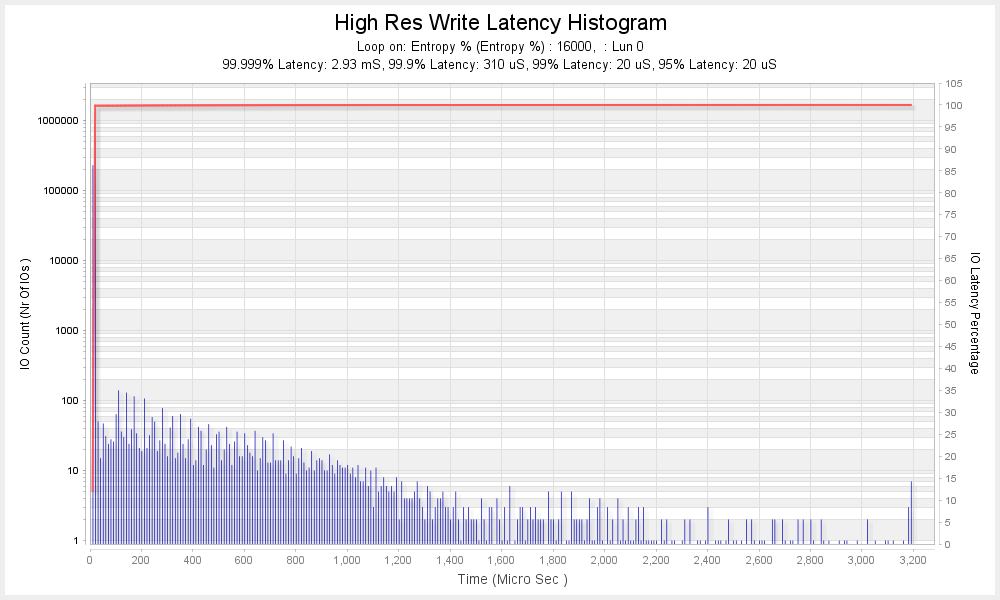
Let’s have a close look at the distribution of the Latency
results at the 32,000 IOPS level –
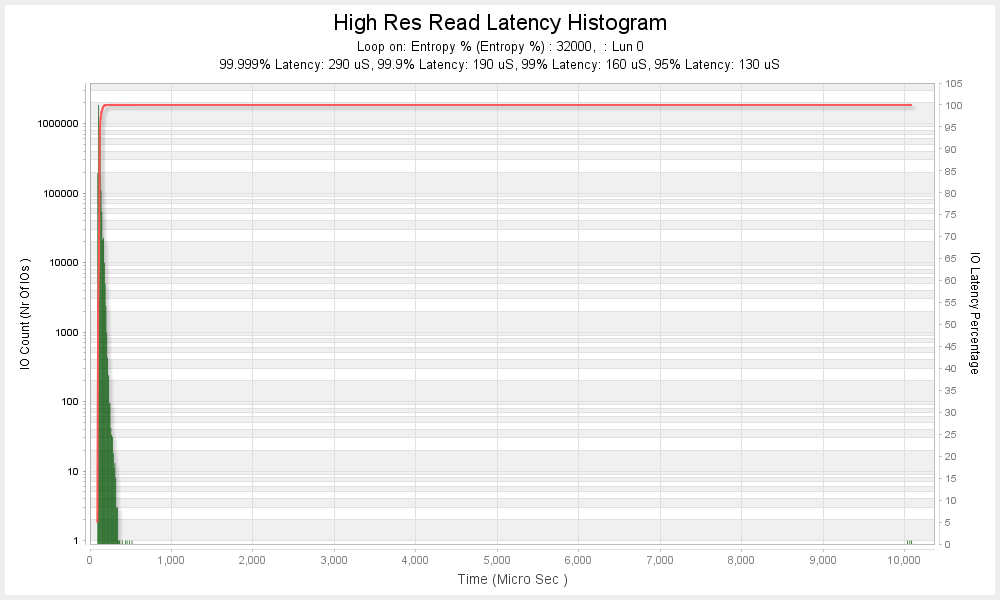
As this is the first time in this review, that we are
looking at a High Resolution Latency Histogram, here’s an explanation – The X
axis to the left is the count of the IOs in the observation period (in a Round)
that had a Latency of the value along the Y axis (please note that the X axis
is logarithmic to allow the low order counts of the huge number of IOs that
have been measured to be visible); the Y axis is the Latency value measured in
Microseconds; The X axis to the right is the % of the Total IOs observed that
have a Latency <= to a given Latency value; the rate of getting to 100% is
highlighted by the red graph line.
We can see that 99.9% of the Latency values are <= 190 Microseconds
and there are remarkably few outliers - the Quality of Service as measured in
this test is excellent.
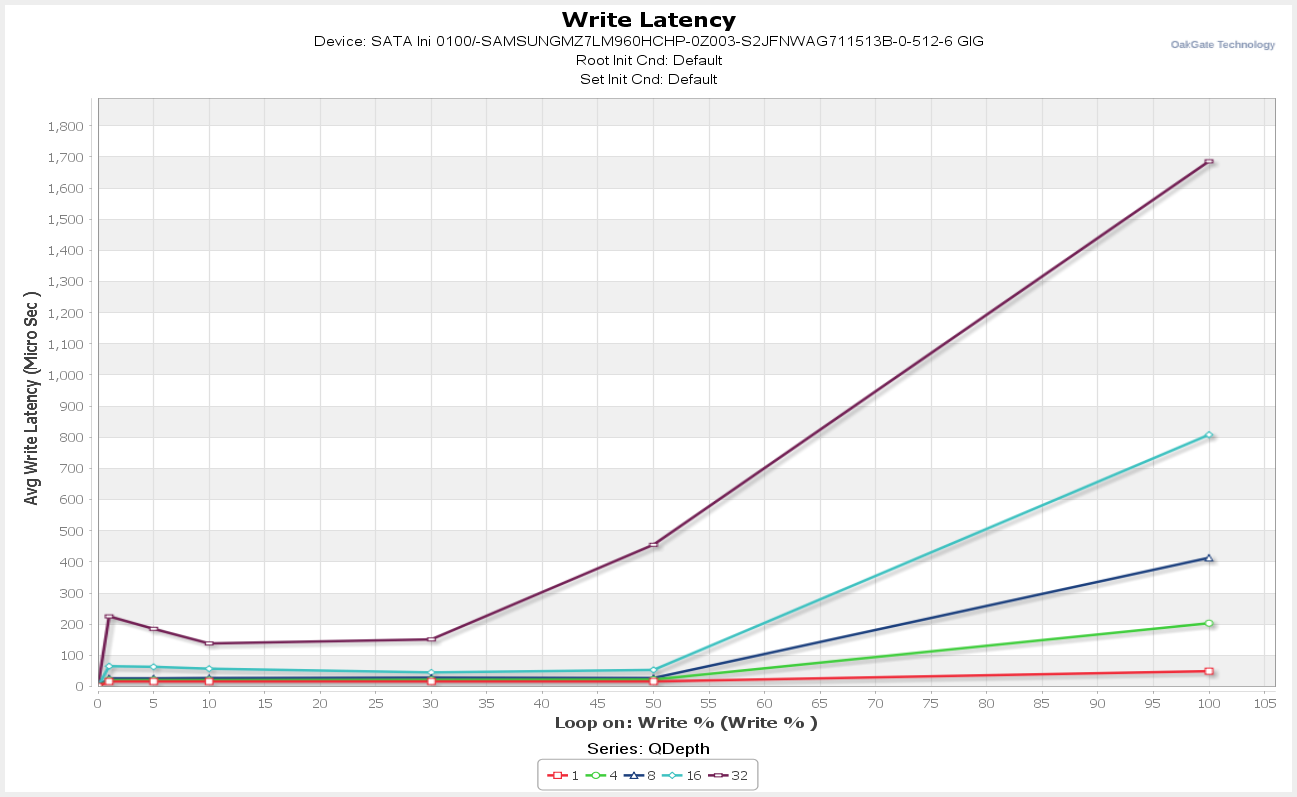
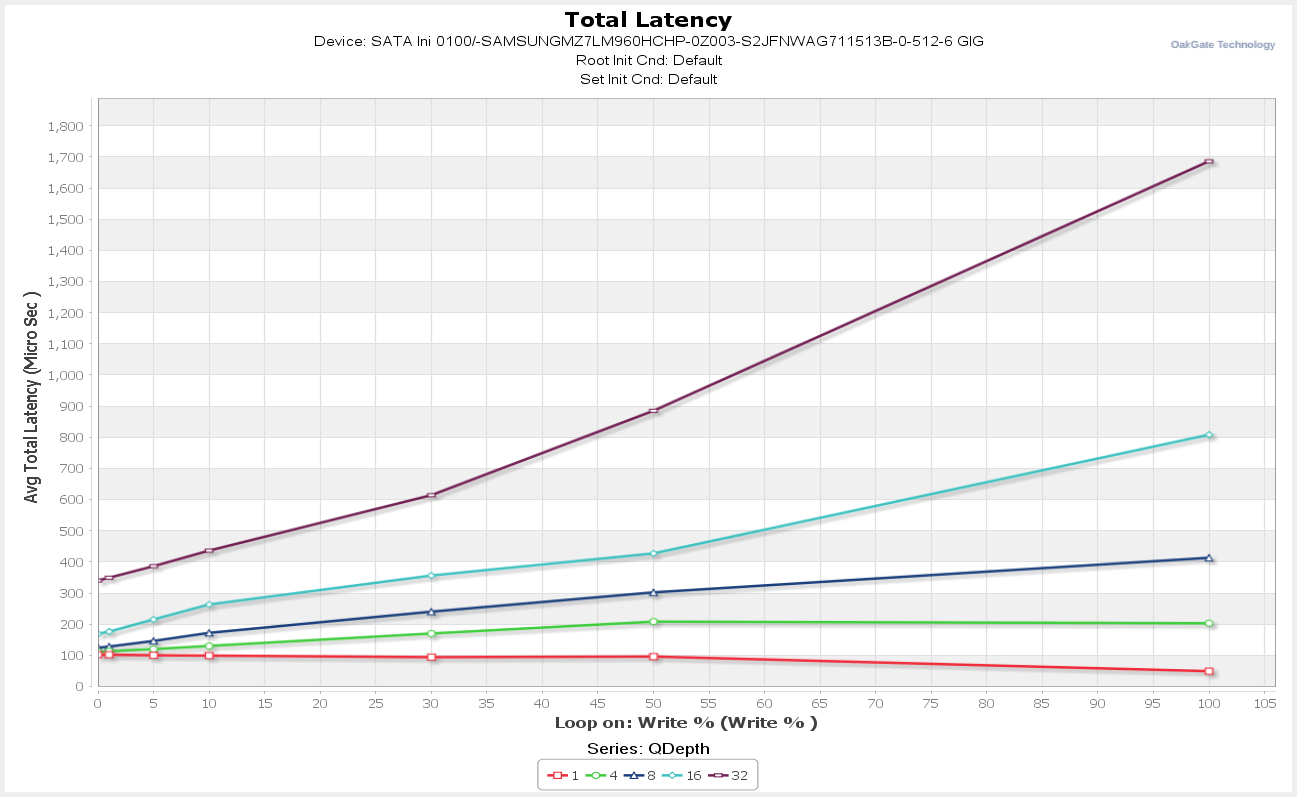
4K Latency Write Test
Myce/OakGate 4K Write Latency Test
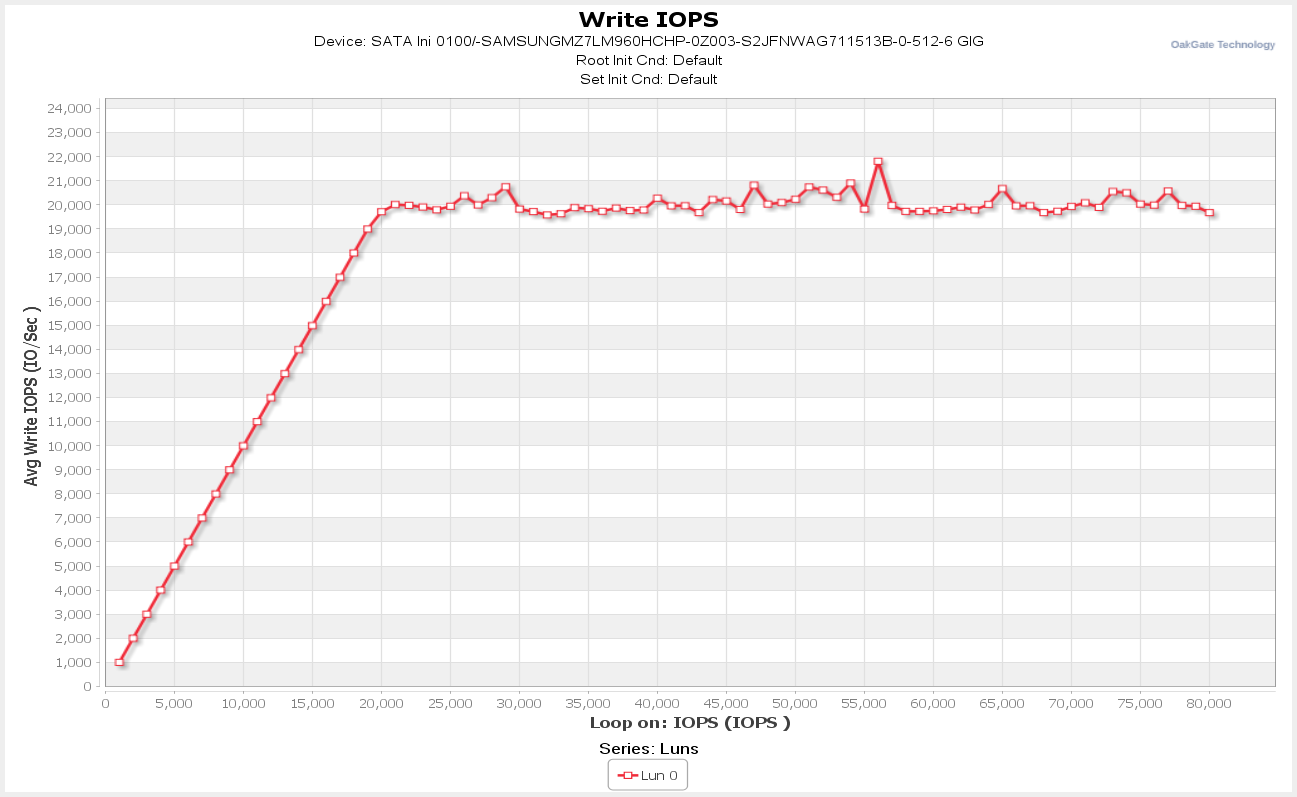
We can see that in this test the drive continues to meet the
increase in demand up to a level of 19,000 IOPS.
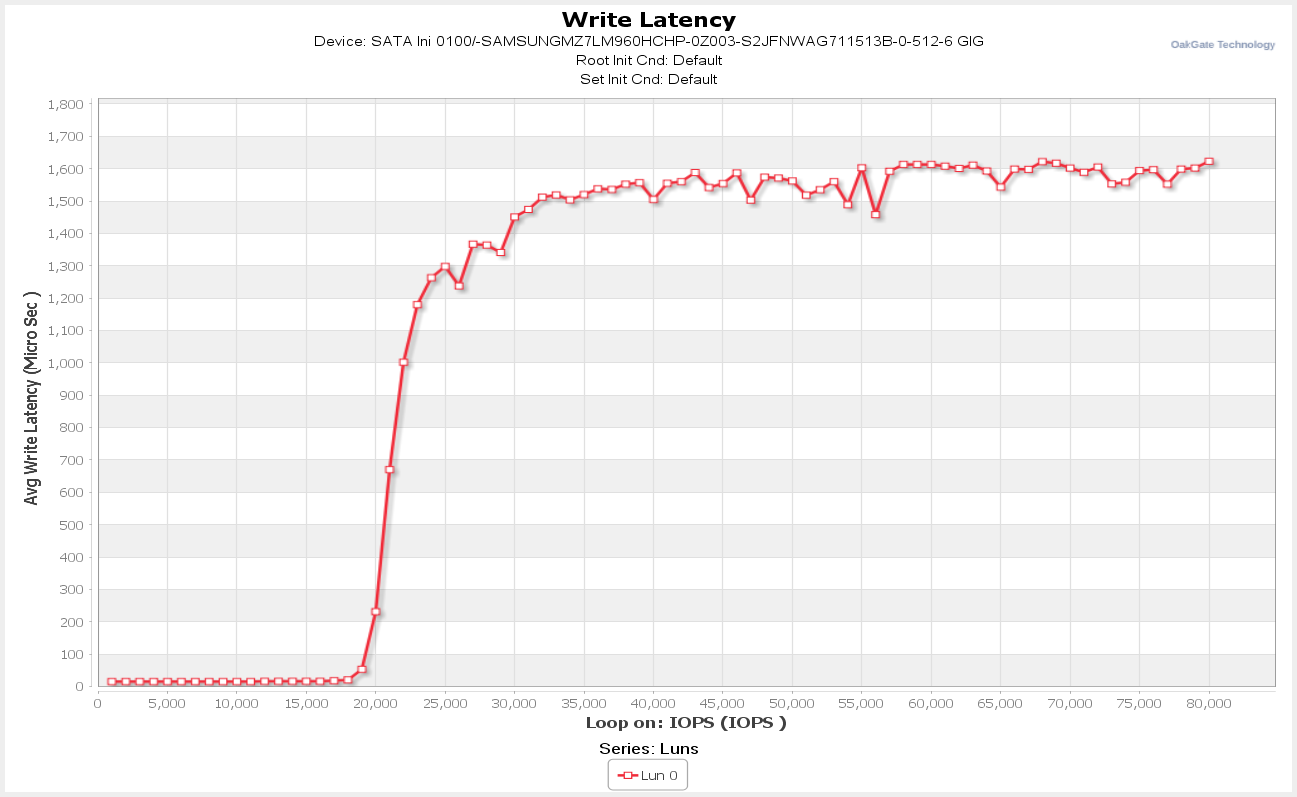
Here we can see that Average Write Latency stays below 50 microseconds
all the way up to a demand of 19,000 IOPS – an outstanding result.
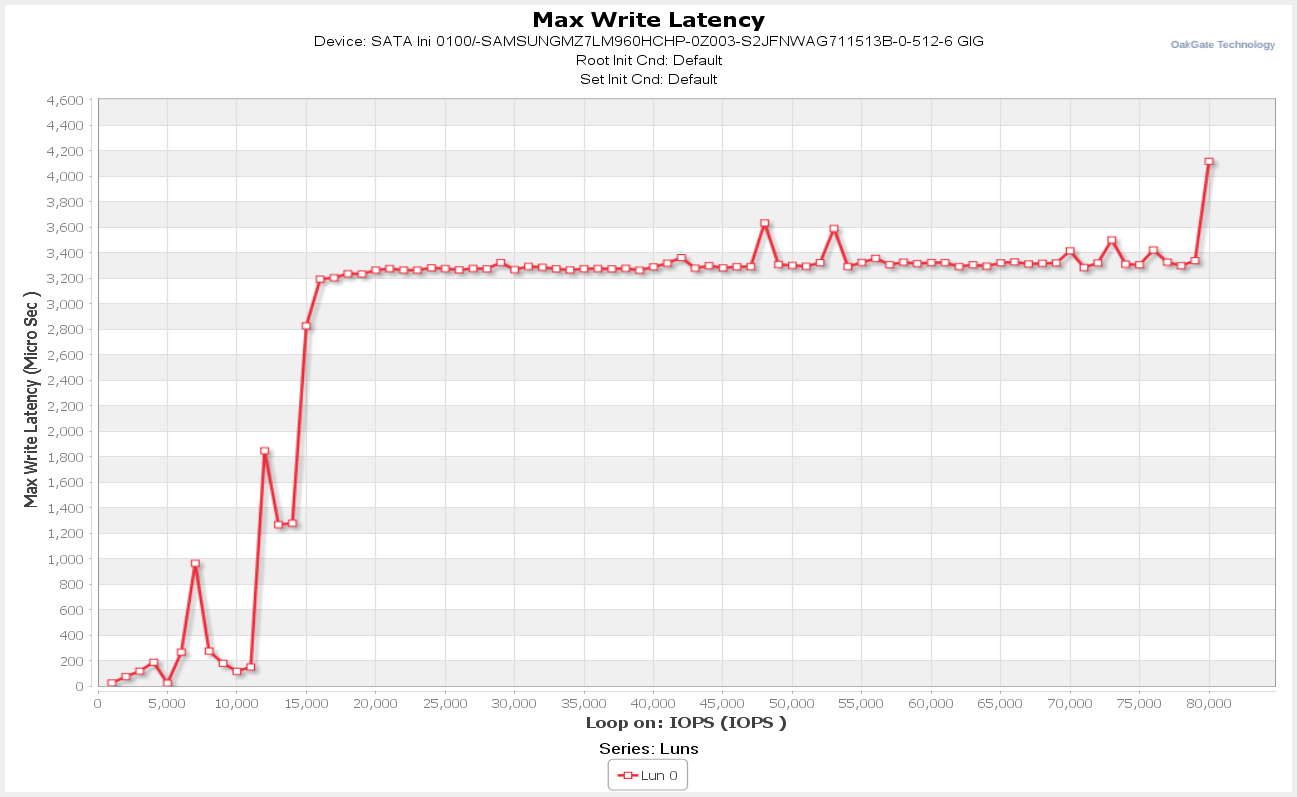
We can see that there are a few Maximum Latency peaks.
Now let’s have a look at the distribution of the Latency
Values at the 16,000 IOPS Mark (at one of the peaks) –
We can see that 99.9% of the Latency Values are <= 310 microseconds.
There are only a relatively small number of outliers. This is an excellent
result.
Now let's head to the next page, to look at the results
for the Myce/Oakgate Reads and Writes Tests.....
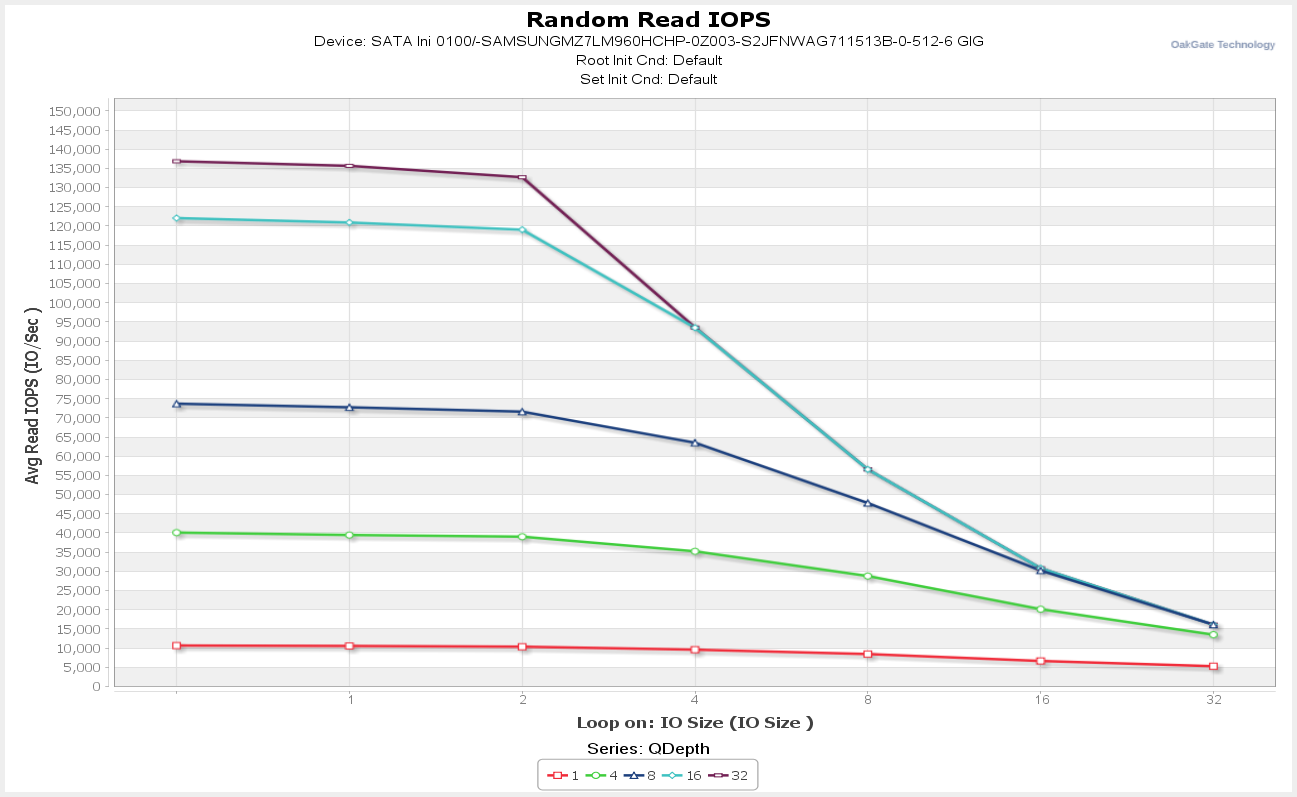
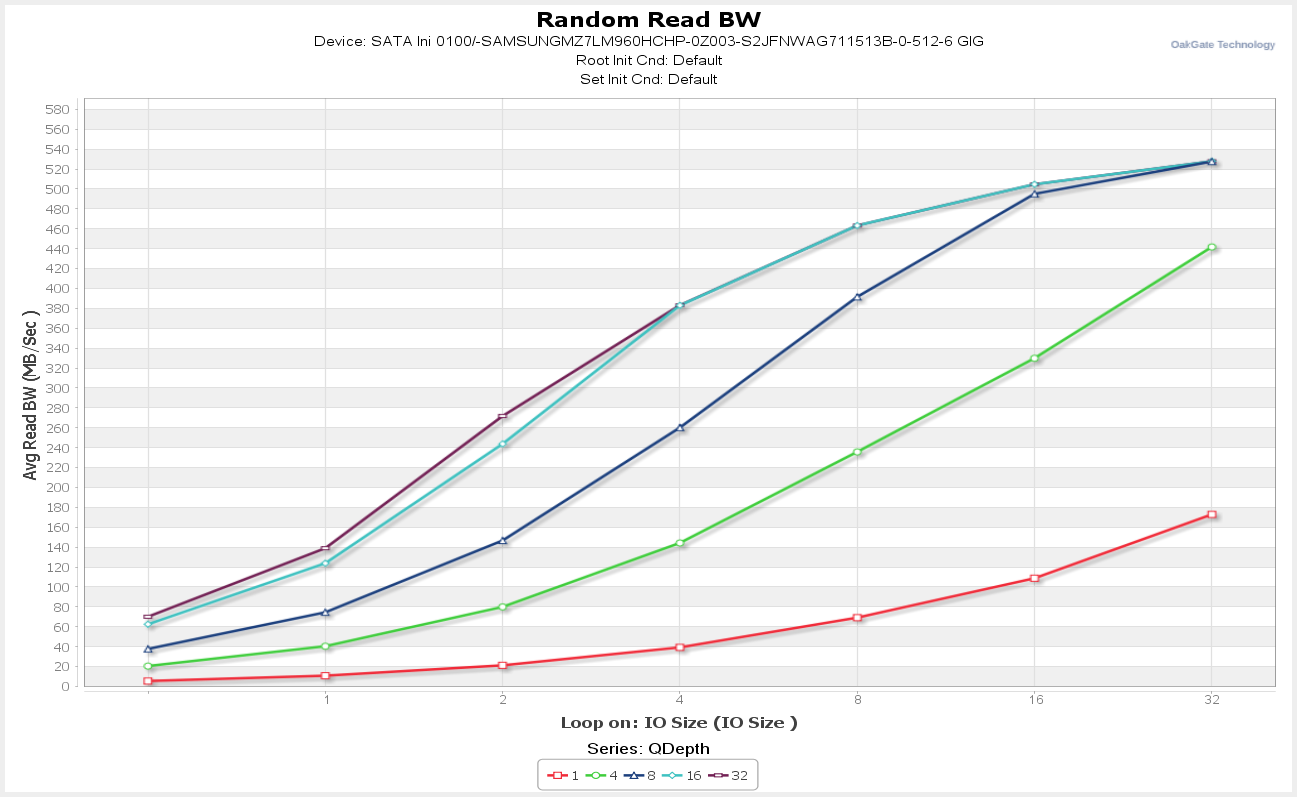
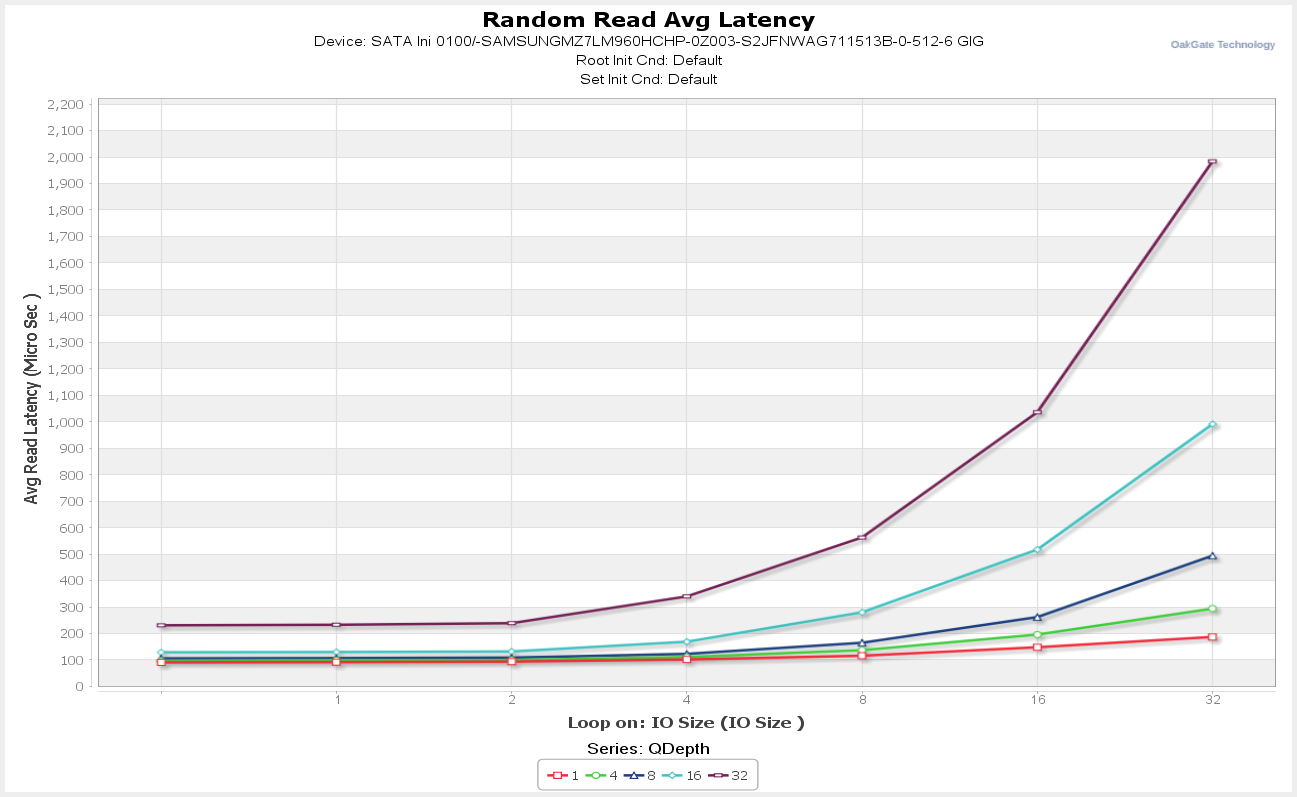
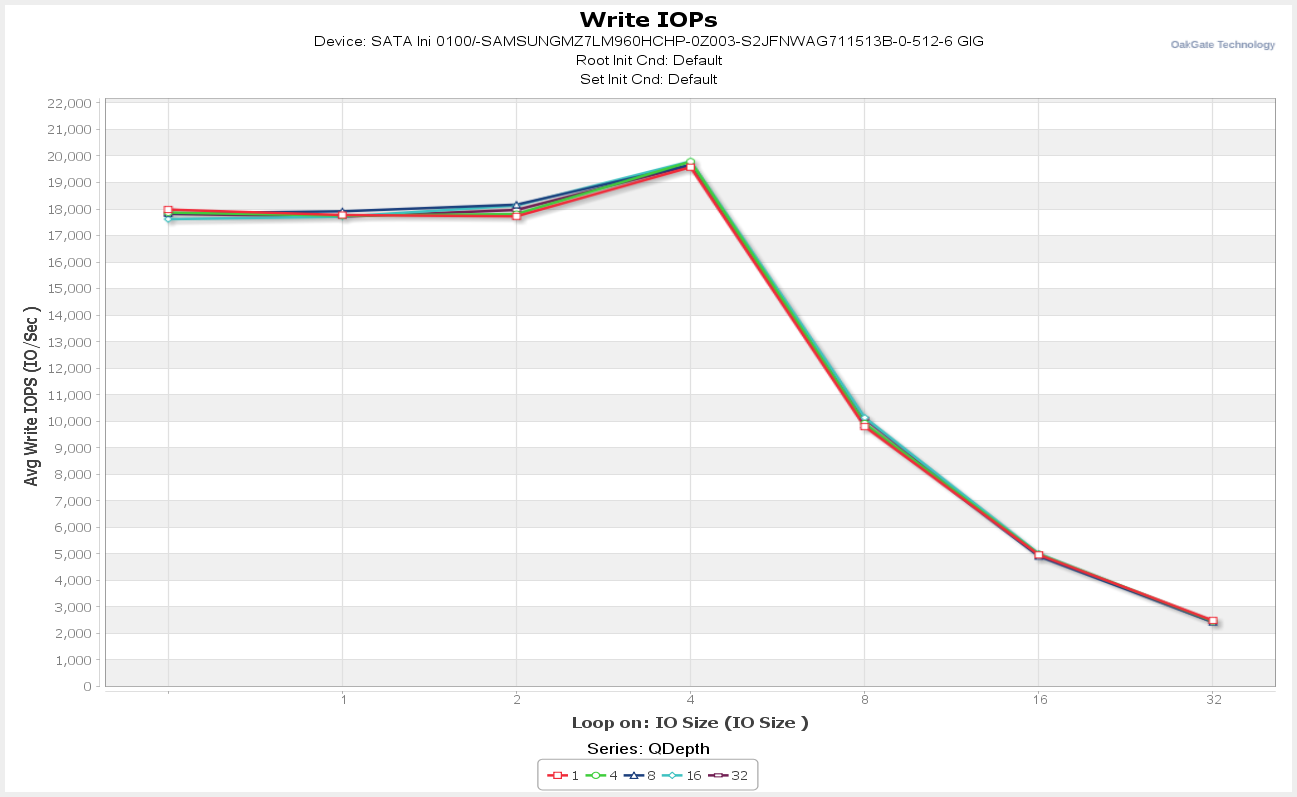
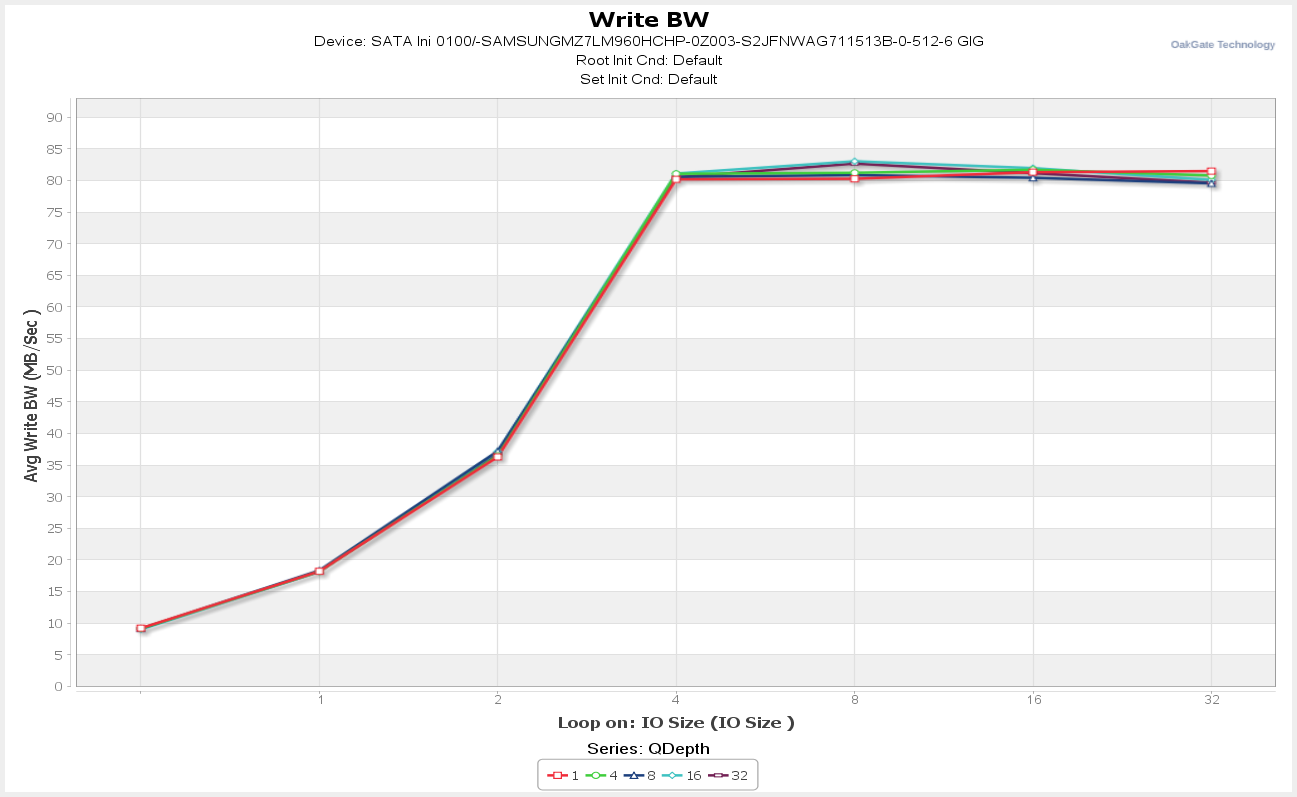
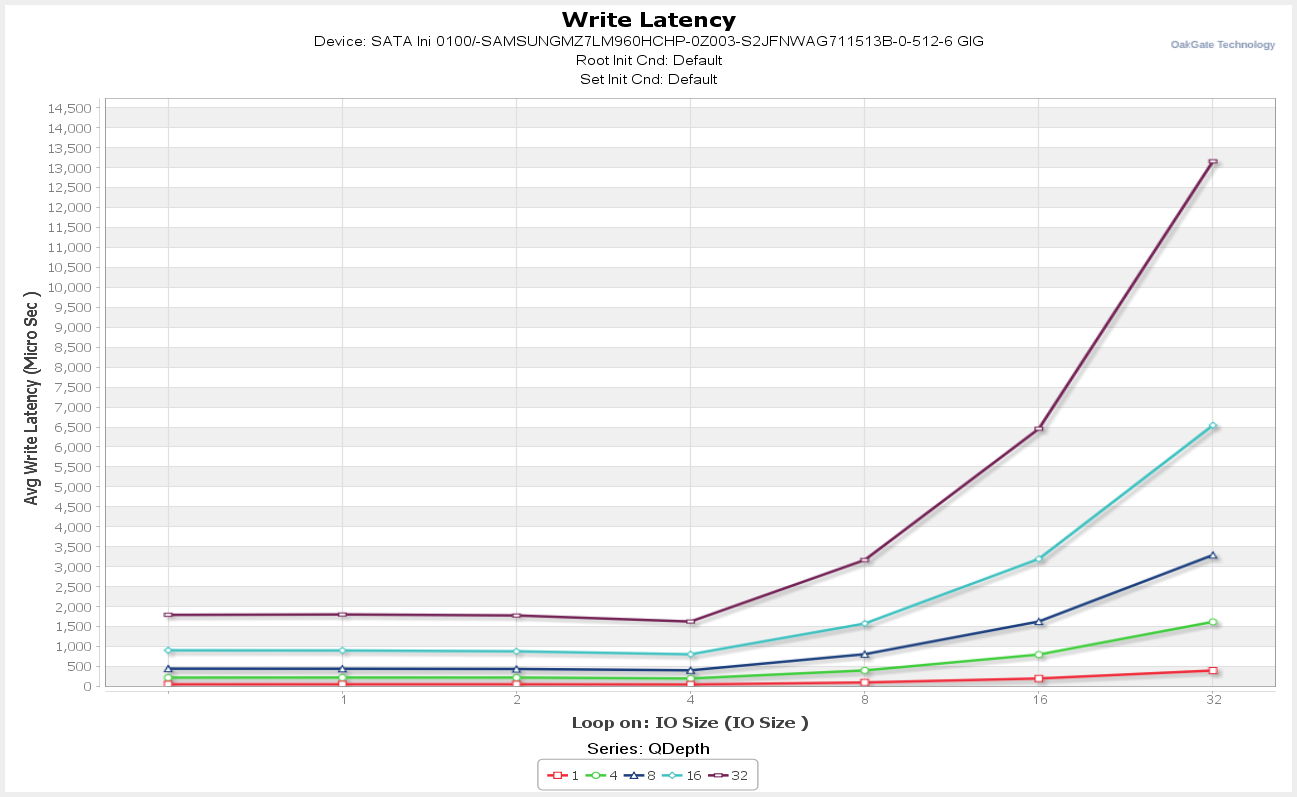
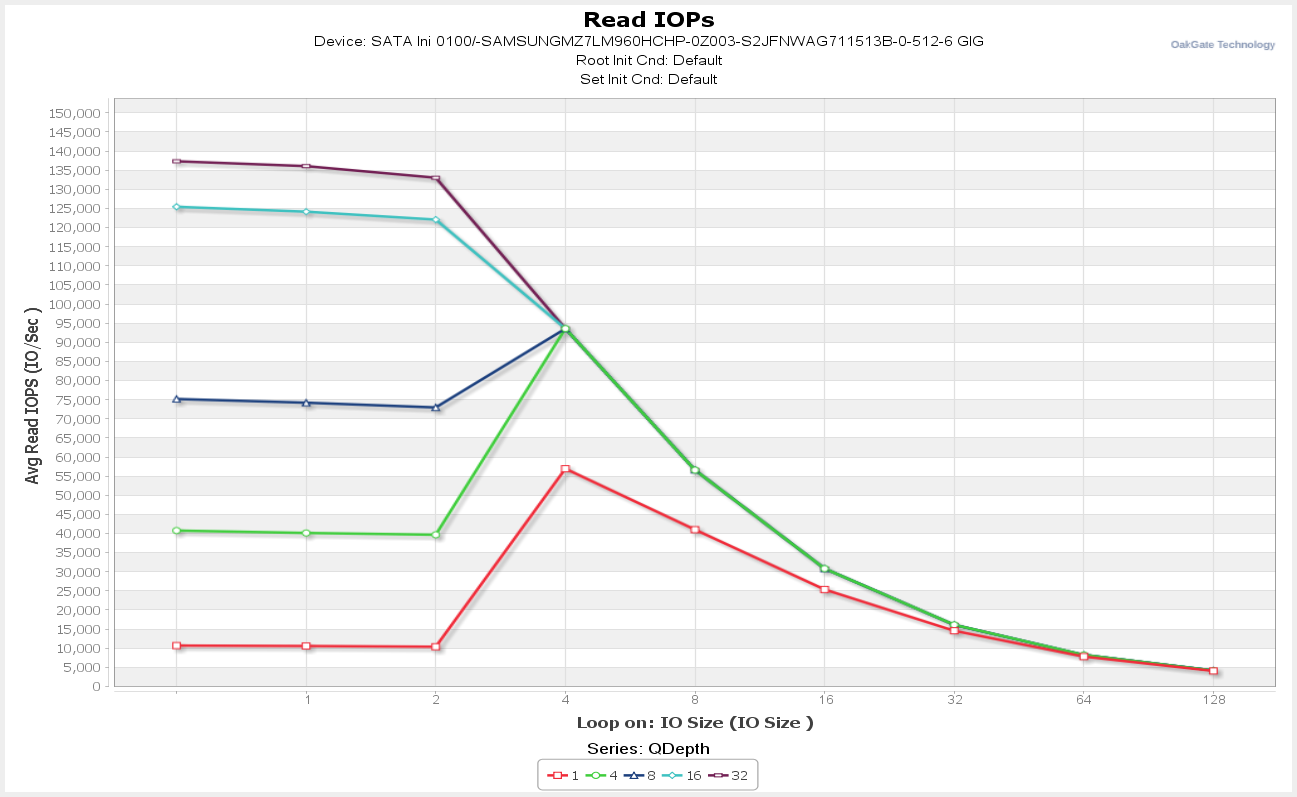
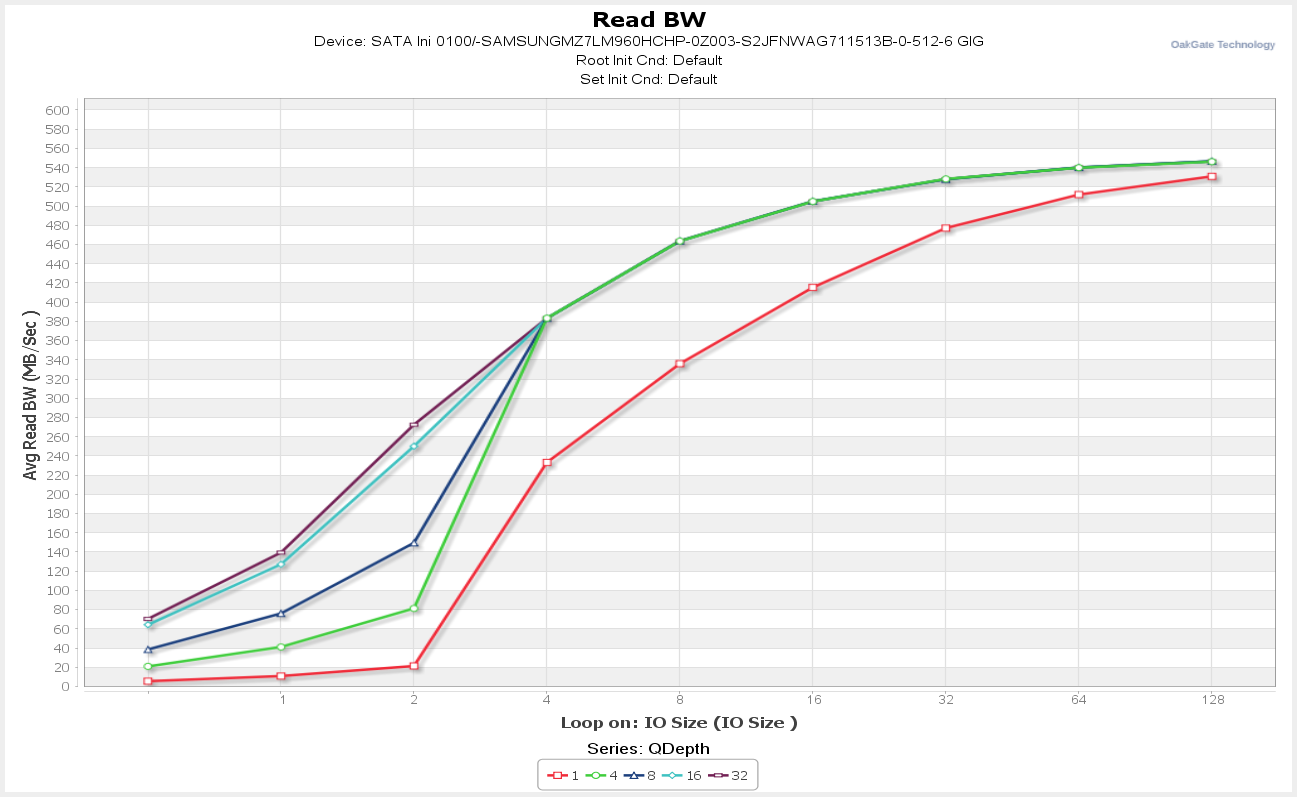
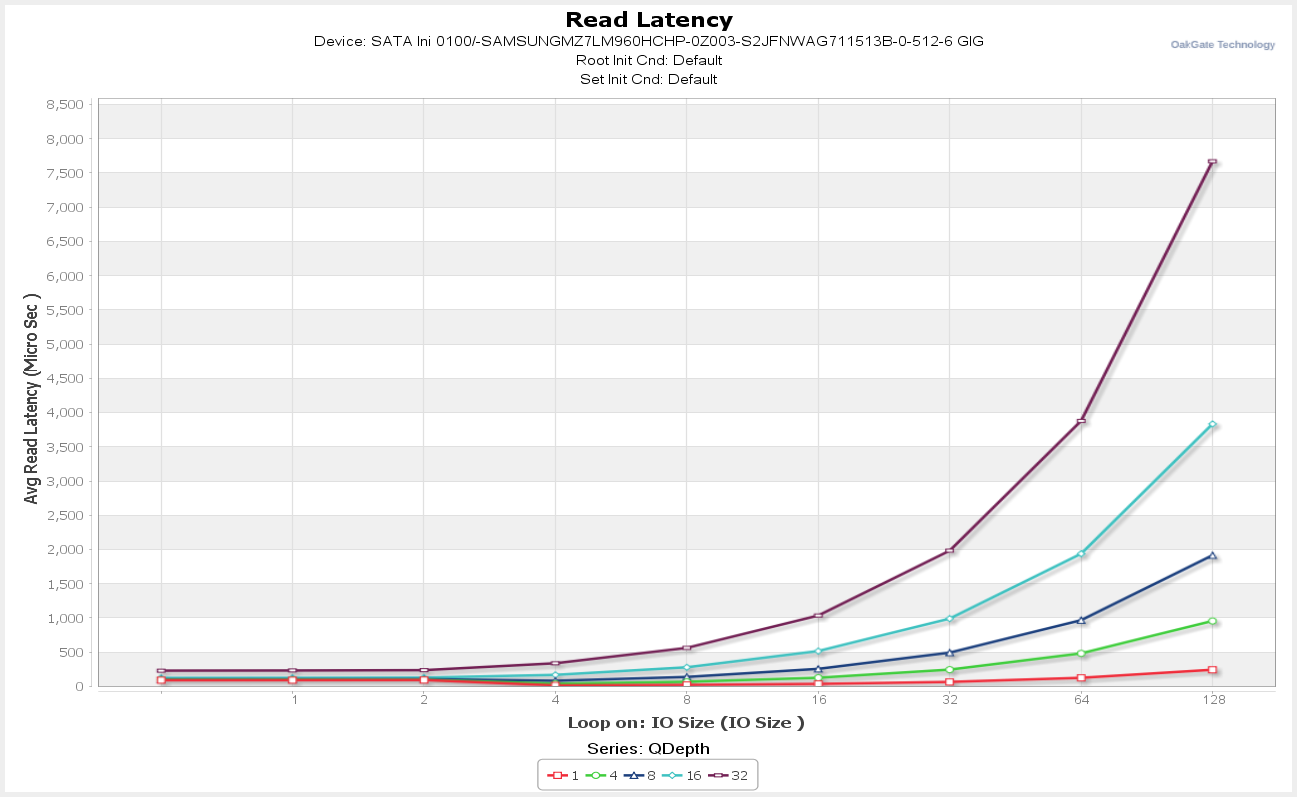
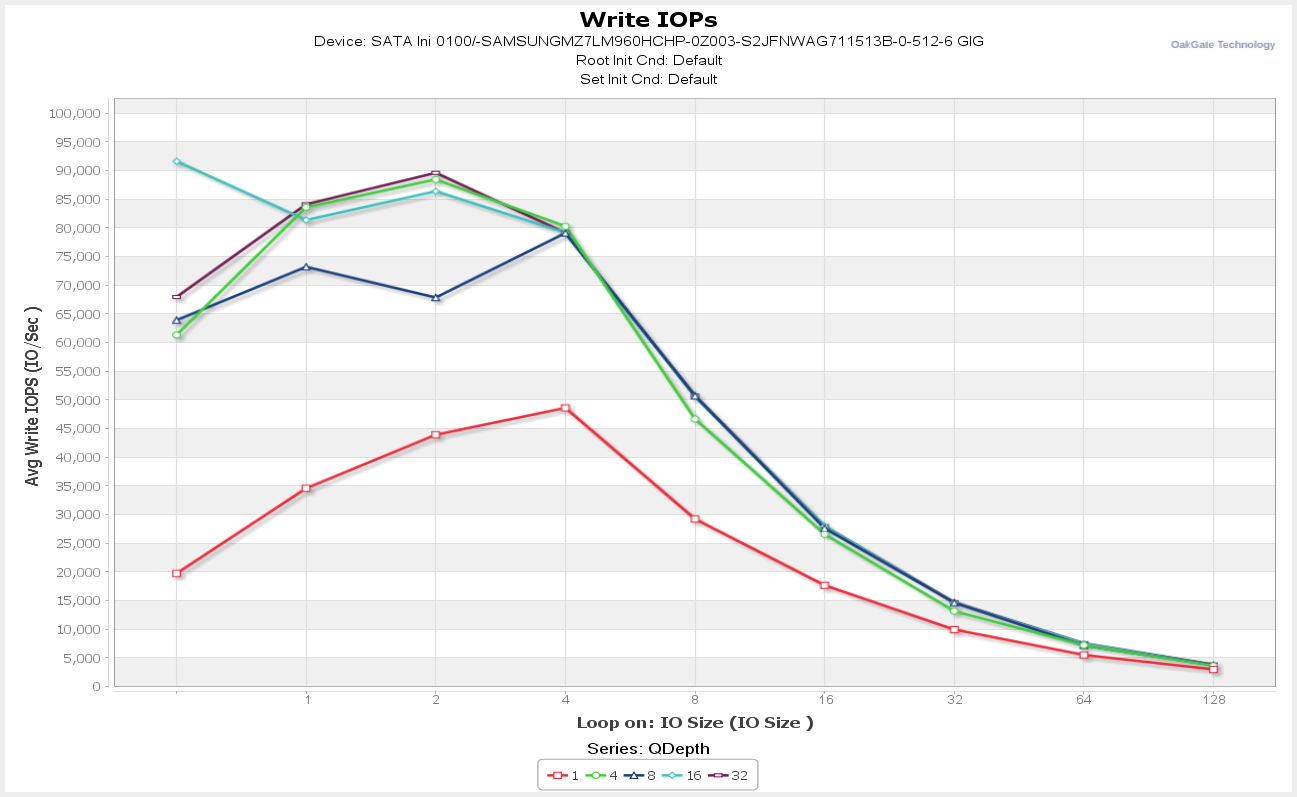
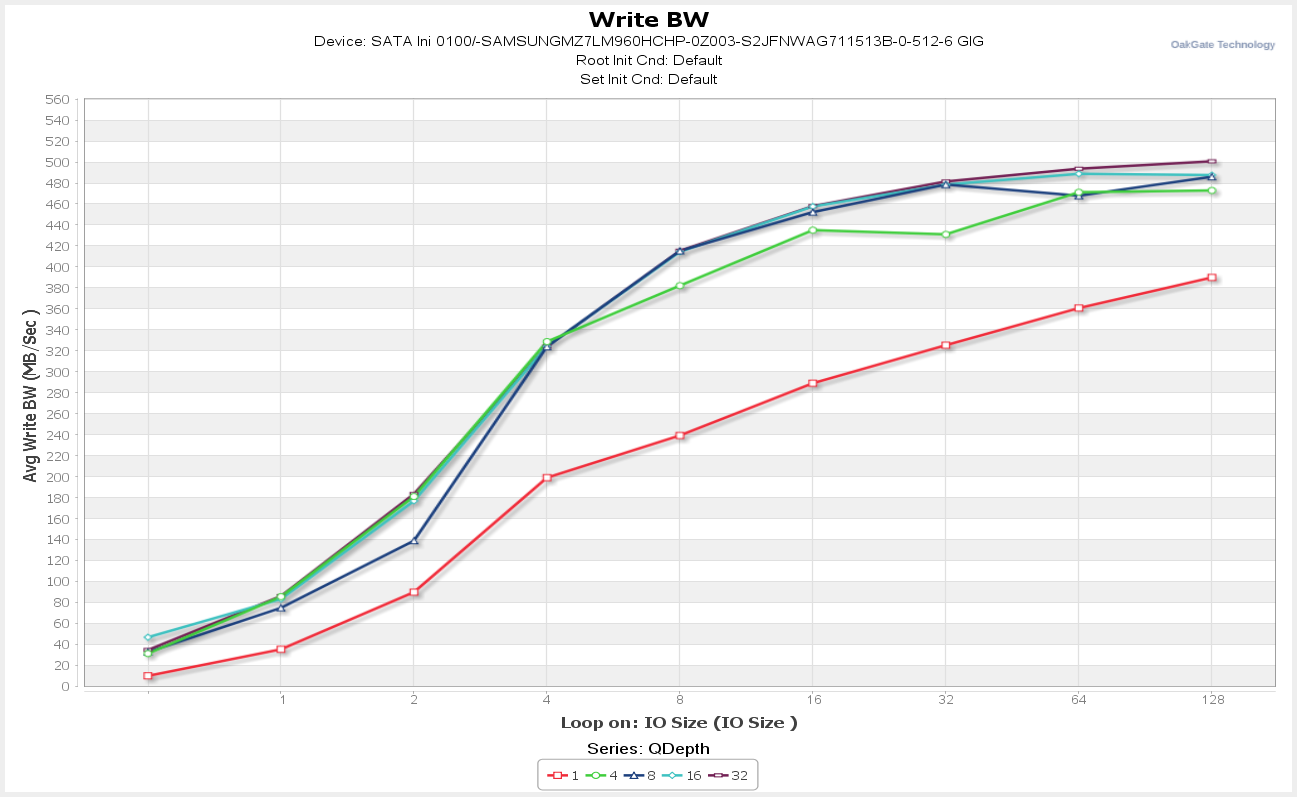
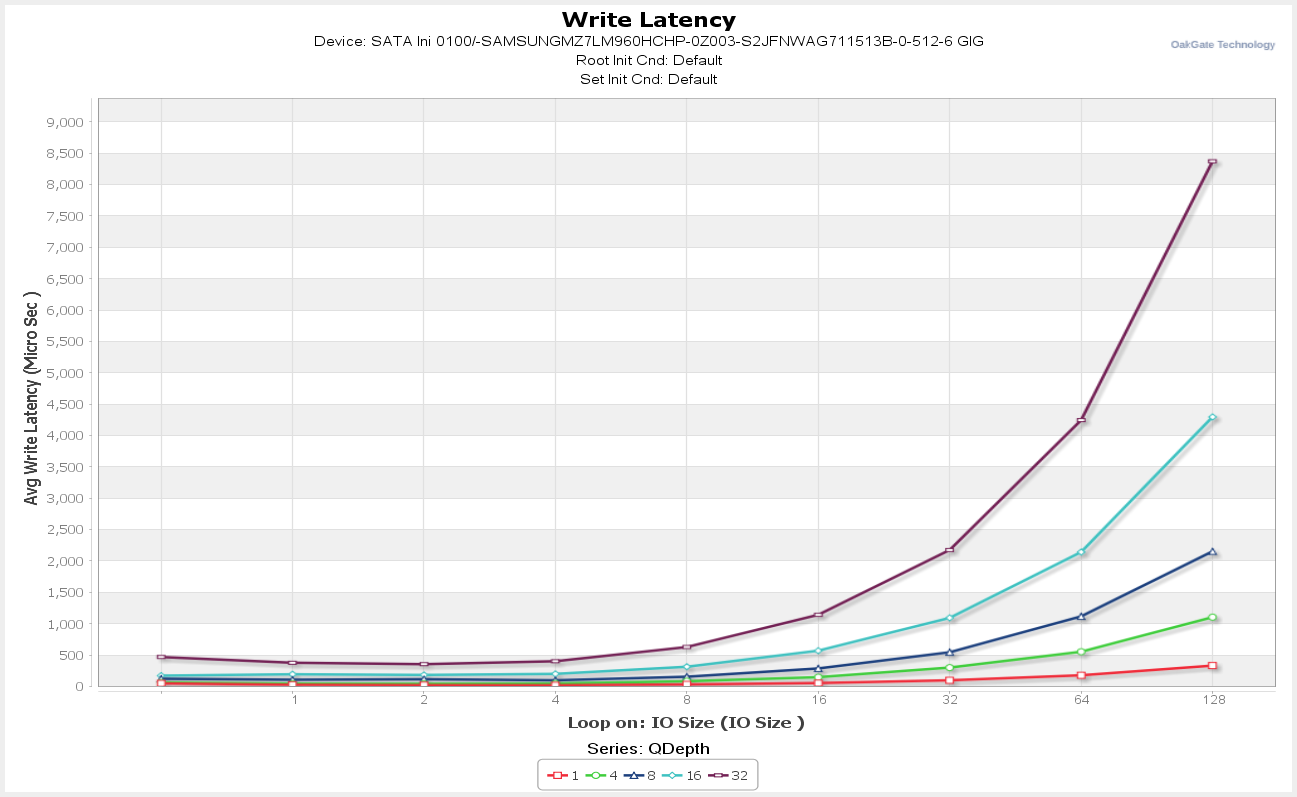
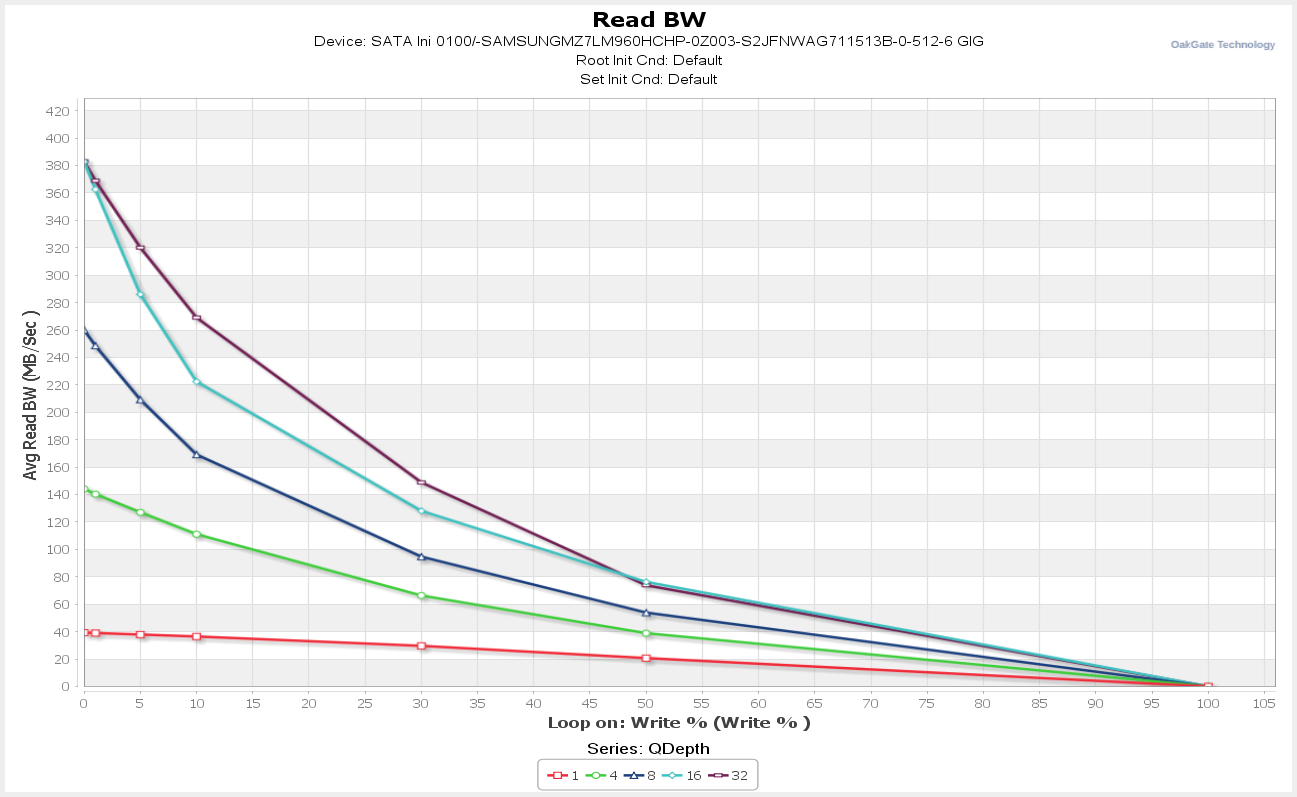
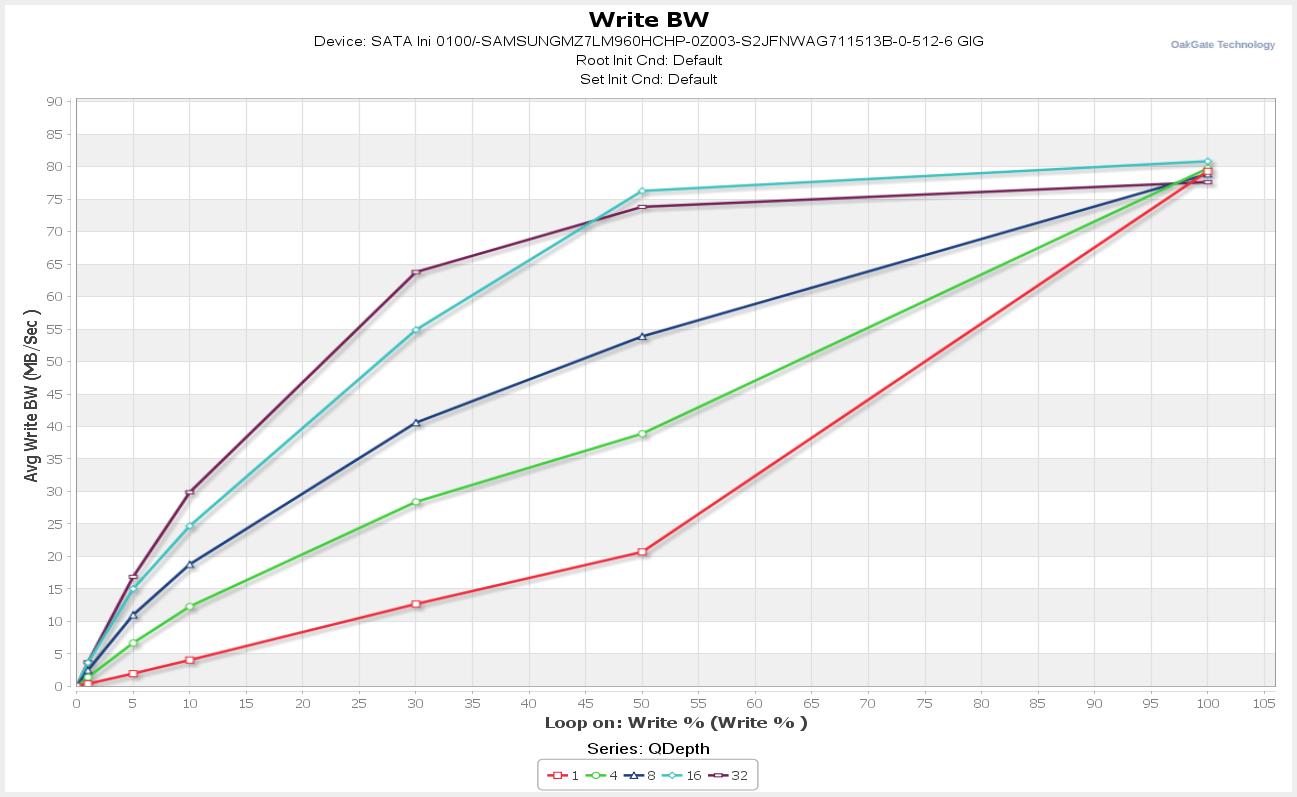
Myce/OakGate Reads and Writes Tests
The tests are designed to show the Random and Sequential,
Read and Write, performance metrics for different combinations of Queue Depth
and IO size.
Here are the results -
Random Reads
Myce/OakGate Random Reads Test
Random Writes
Myce/OakGate Random Writes Test
Sequential Reads
Myce/OakGate Sequential Reads Test
Sequential Writes
Myce/OakGate Sequential Writes Test
Now let's head to the next page, to look at the results
for the Myce/Oakgate 4K Mixed Reads/Writes Tests.....
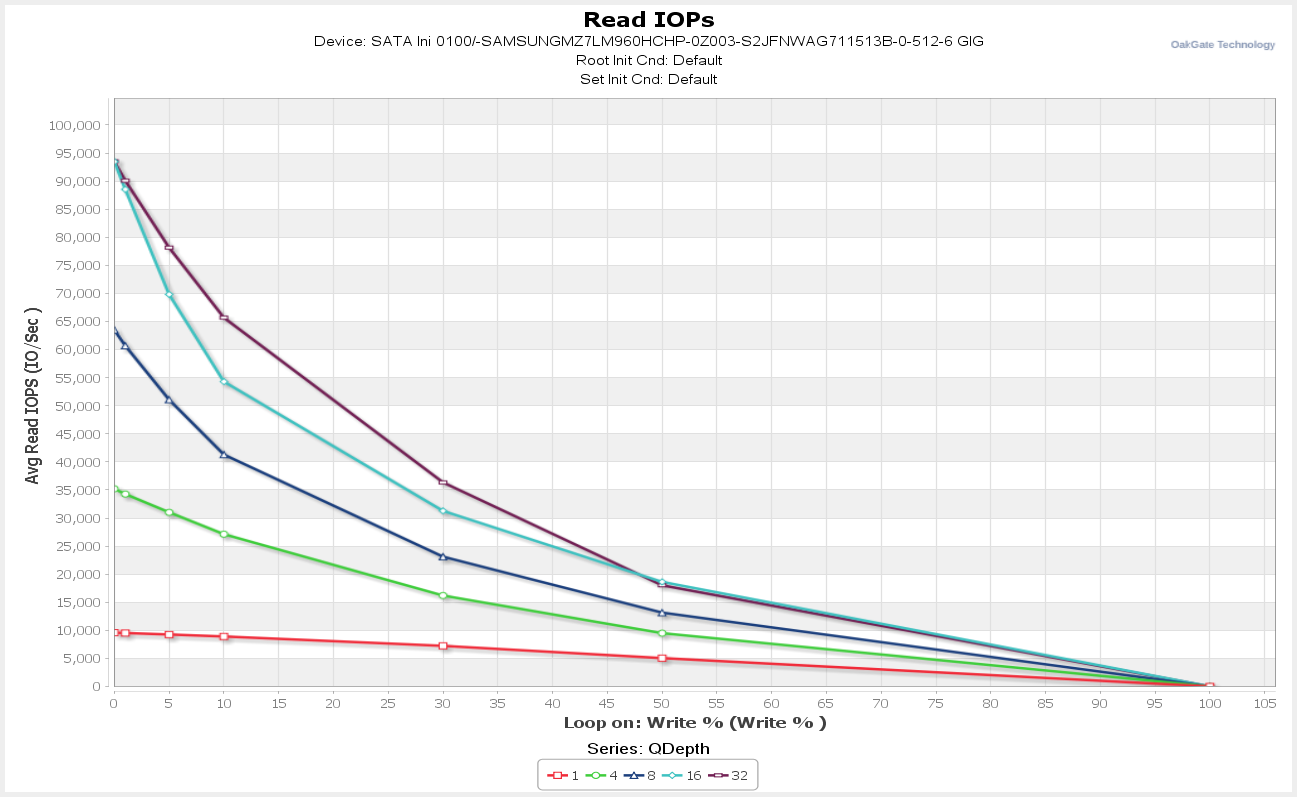
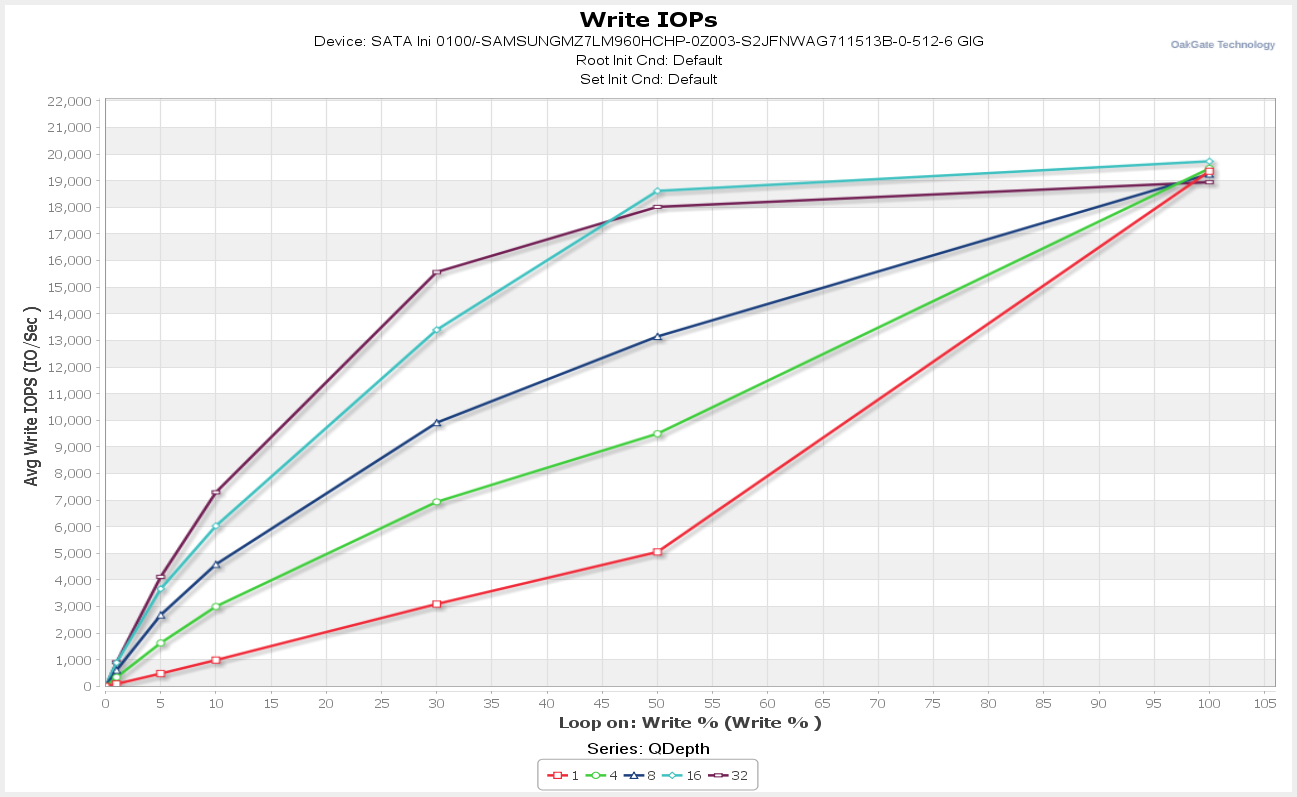
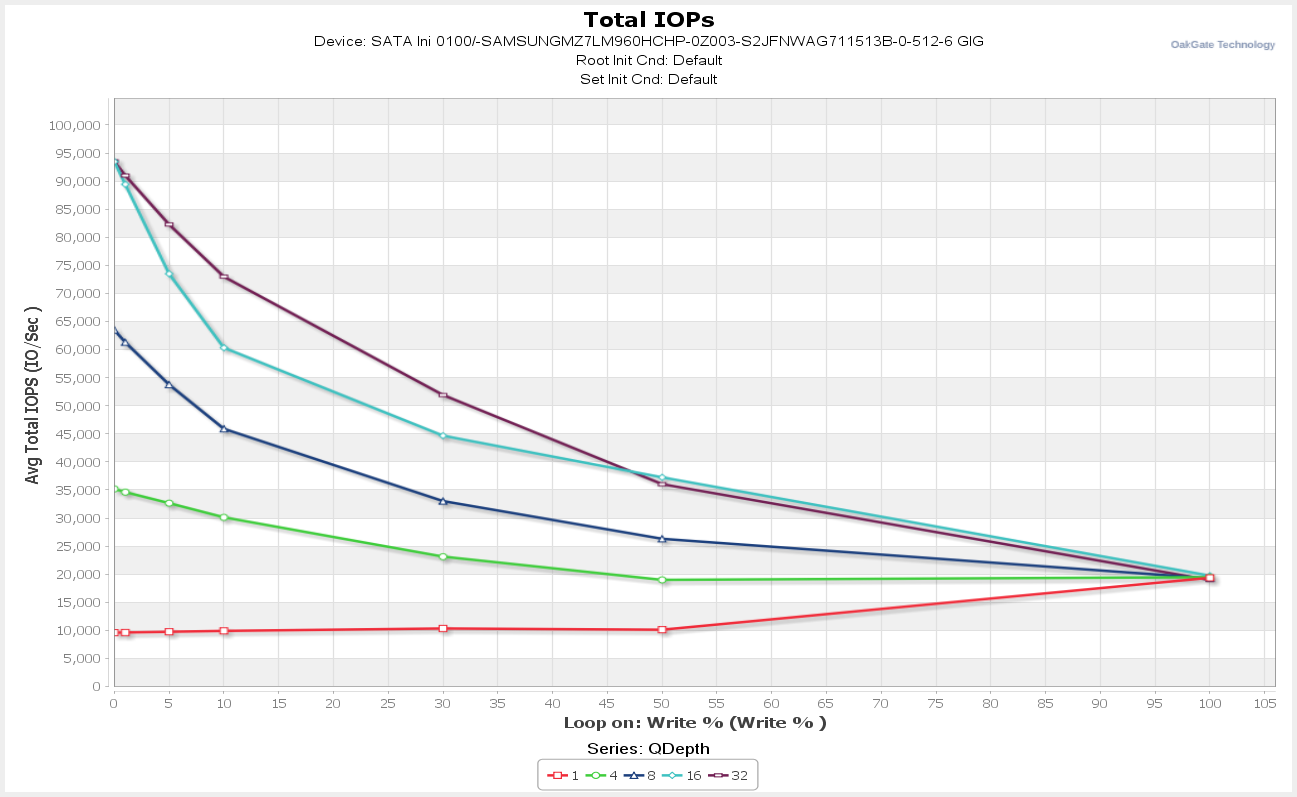
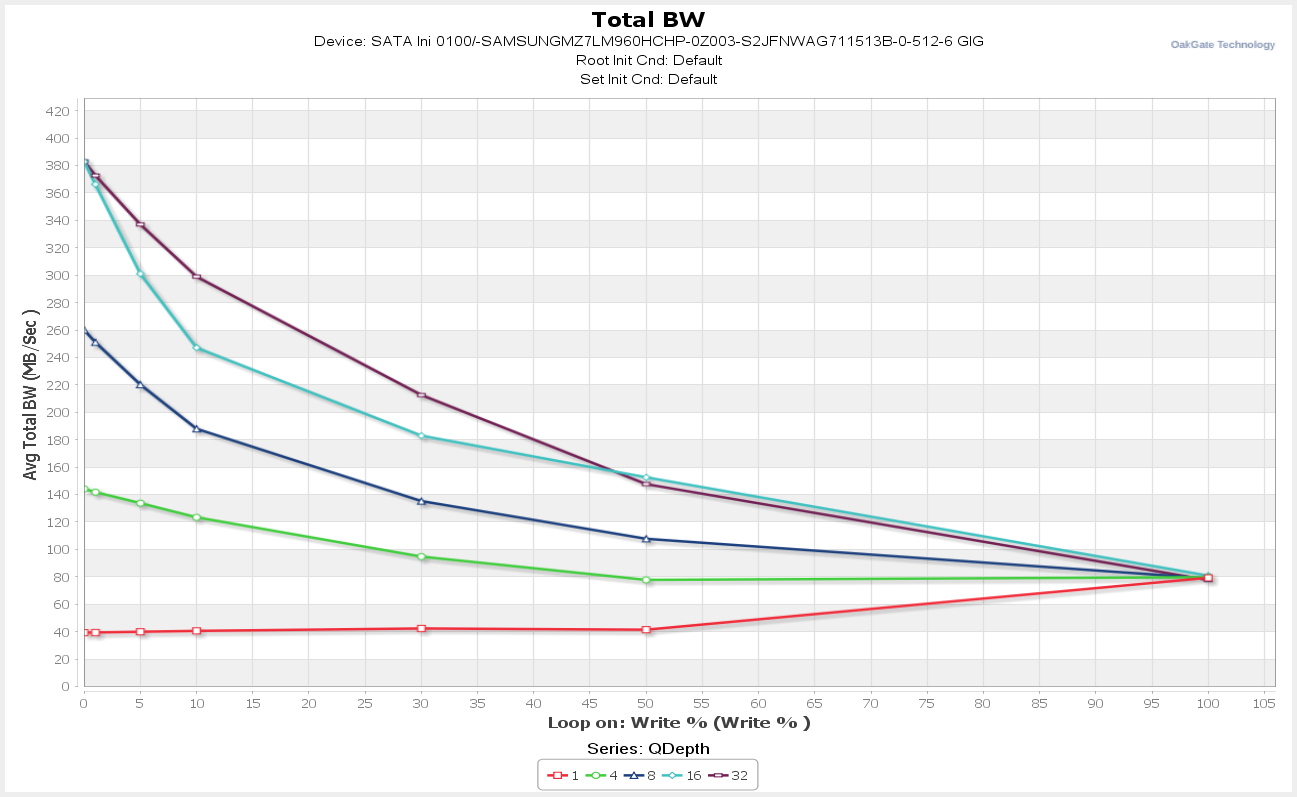
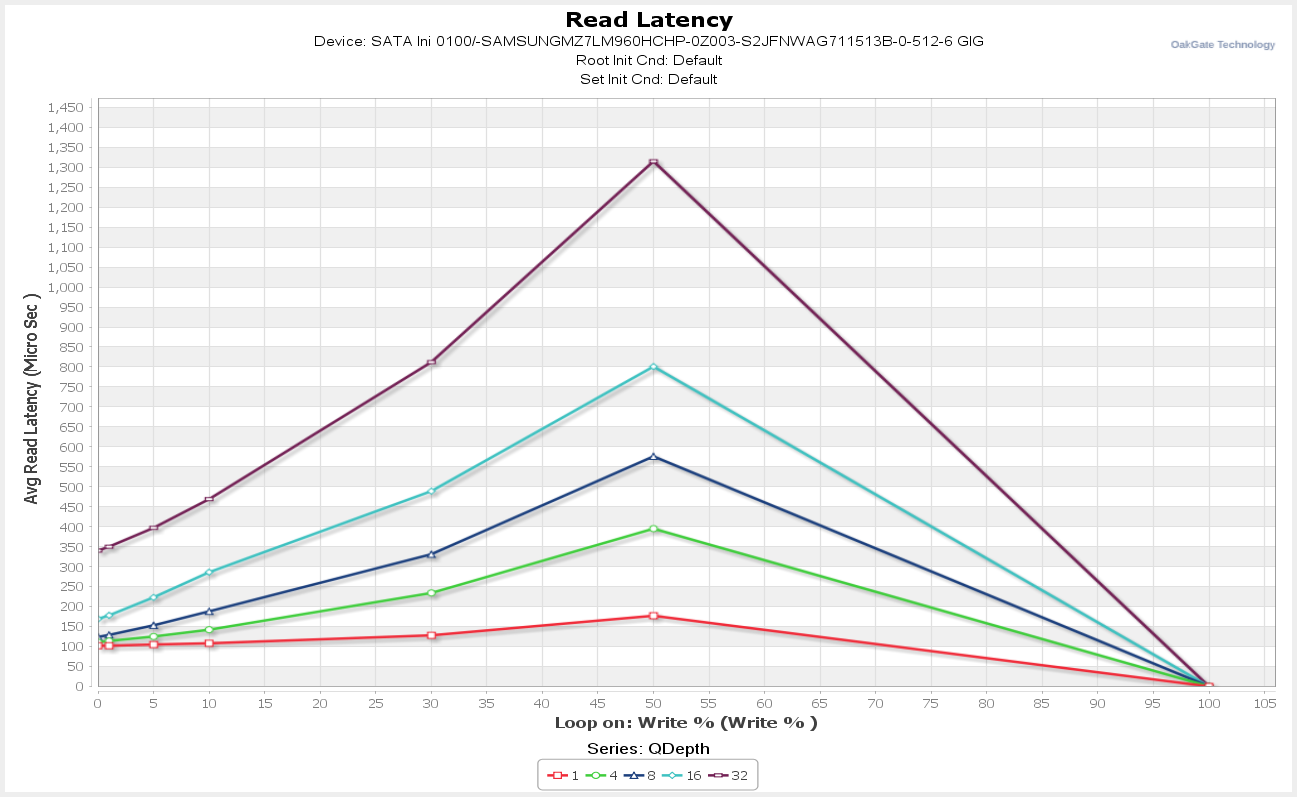
Myce/OakGate 4K Mixed Reads/Writes Tests
This test is designed to show the performance metrics for
different combinations of Queue Depth and Random Read/Write mix (the % of Reads
and the % of Writes making up the IO traffic)
4K Mixed R/W Test
4K Mixed Reads/Writes Test
Now let's head to the next page, to look at the results
of the Myce/OakGate Entropy Tests.....
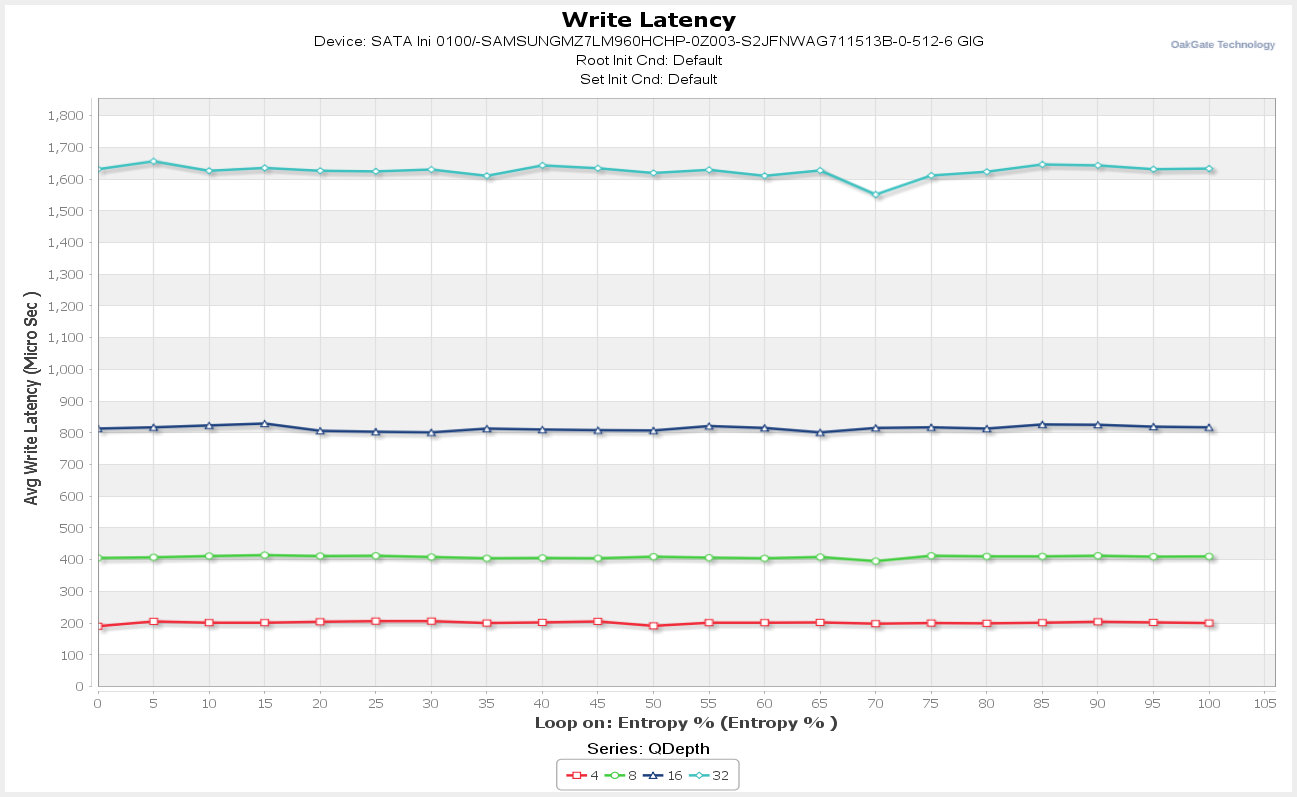
Myce/OakGate Entropy Tests
These tests are designed to show performance metrics for
different combinations of Queue Depth and Entropy % (Entropy % is the degree to
which the data that is random and therefore incompressible). Testing with
different Entropy % levels has become important with the advent of controllers,
such as those from LSI Sandforce, that compress data before writing it to NAND.
Controllers that compress data can be expected to perform better with highly
compressible data (i.e. data with low Entropy).
The first test performs 5 minutes of Random 4K writes for
each combination of Queue Depth and Entropy %.
The second test does the same thing for a mixture of Read
and Write traffic (70% Reads, 30% Writes).
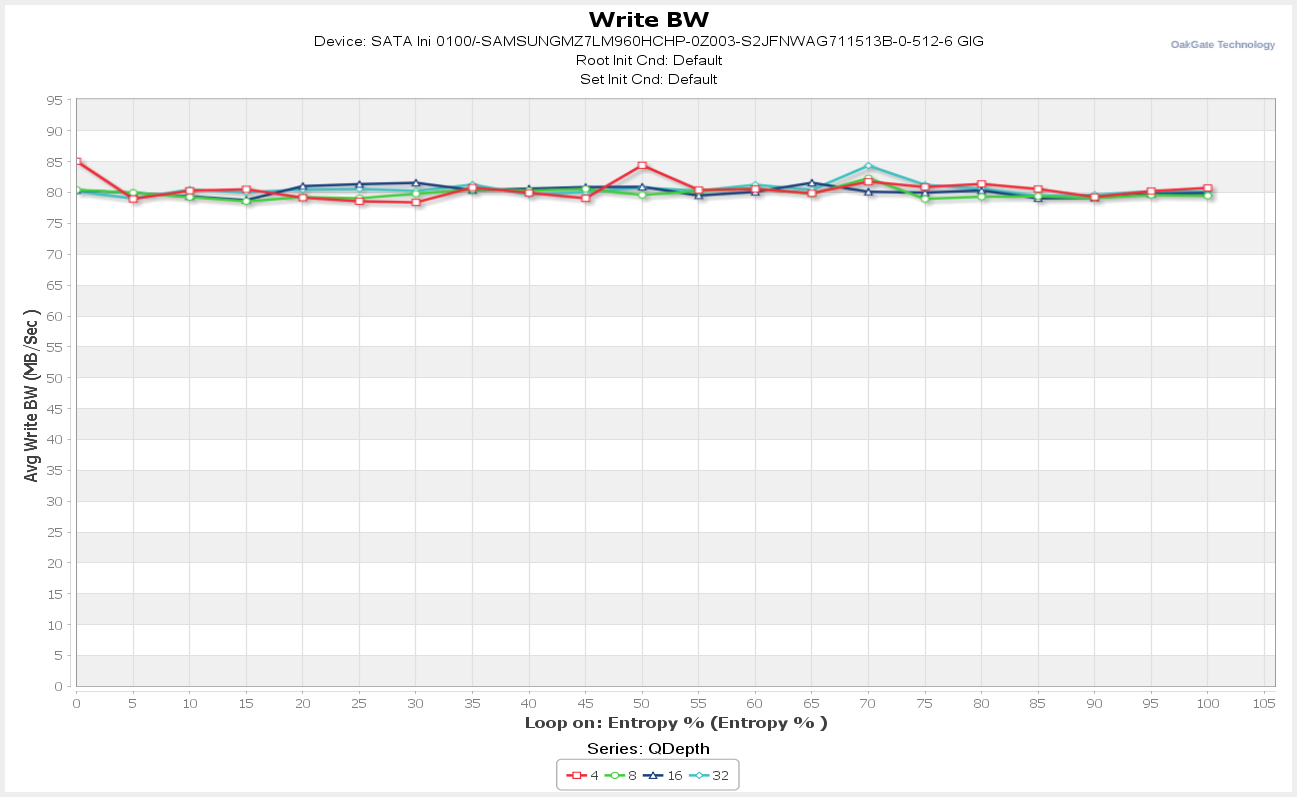
4K Entropy Write Test
4K Entropy Write Test - Power Efficiency Mode – Single
Port
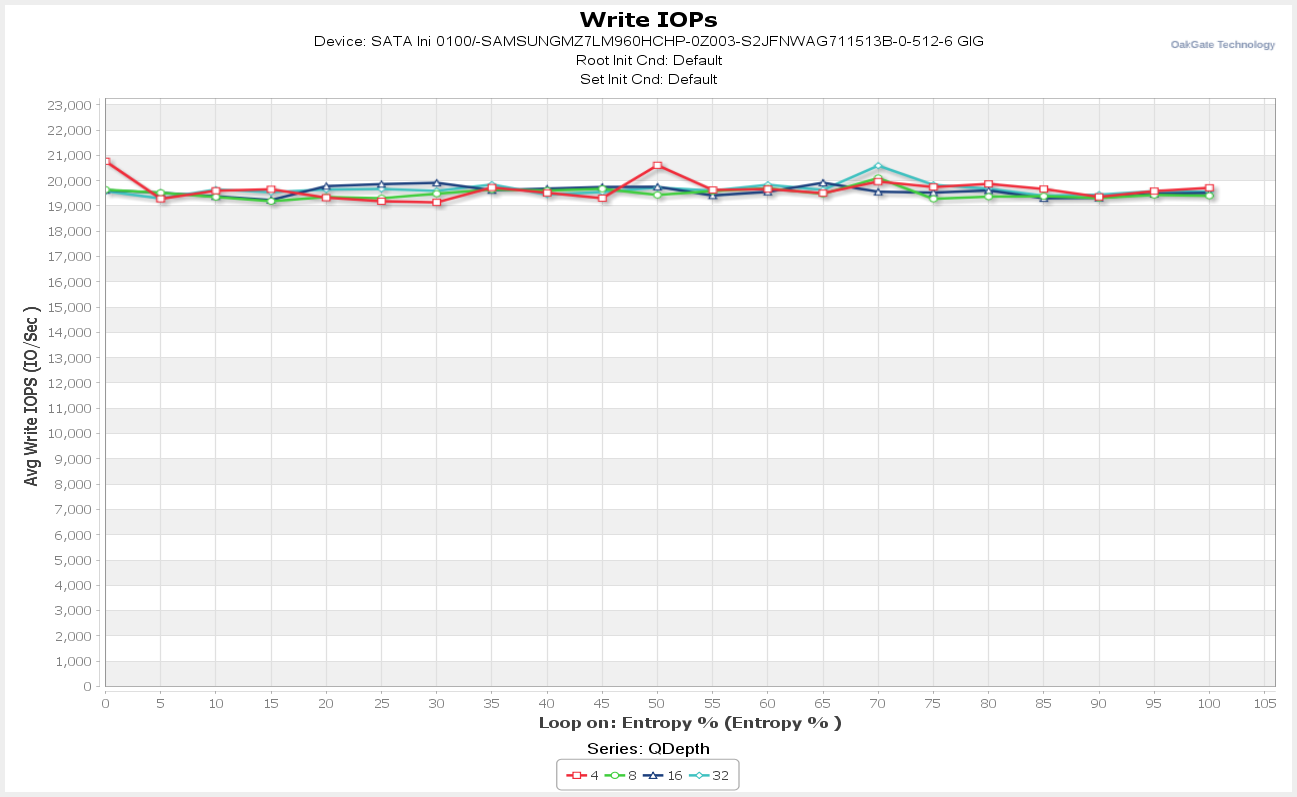
You can see there is little or no variance in performance to
be found in any of the Entropy tests, as the degree of random data increases
(and this comment applies to all of the test results for the Myce/OakGate
Entropy Tests). We can therefore conclude that the Samsung PM863 does not
compress data and we will skip the running and presentation of further Entropy
tests.
4K Entropy 70% Reads 30% Writes Test
As we saw no evidence of compression in the 4K Entropy Write
Test we skip the presentation of the 70/30 entropy results.
Now let's head to the next page, to look at Power
Consumption and Data Reliability.....
Power Consumption and Data Reliability
Power Consumption
I believe most people know that data centres are already one
of the major consumers of electricity in the industrialised world; indeed it is
estimated that currently 2% of all electricity consumption goes into IT
applications. According to the European Union the energy consumption of data
centres was 46 Terawatt hours in 2006 and is set to rise to 93 TW hrs by 2020. This
is equivalent to one hundred million 100W light bulbs burning 24 hours a day,
365 days a year.
Typically 40% of the power consumed by data centres is for
the IT load and 35% is for cooling the system. Generally speaking, if a drive
consumes more power it will produce more heat – so power consumption is indeed
a double edged sword. It is no surprise then that a significant proportion of
a data centre’s power consumption goes on servers. I understand cloud based
applications, such as Facebook, are the primary cause of the growth in servers
and the demand for storage space.
If you are a Facebook user, like me and the Reynolds sibs, and
you reside in Europe – this is most probably where your data is click here. Some
interesting Facebook statistics – Facebook has more than 1 Billion monthly
active users, it generates 1 Trillion page views per month and more than 219
Billion photos have been uploaded since launch – amazing! Here is an
interesting video showing the remarkable scale of Facebook’s largest North
American data centre click
here.
Power Testing
We present our standard set of power consumption tests.
SNIA Write Saturation
This test allows us to observe the power consumption
characteristics as the drive passes from a fresh ‘out of the box’ state to one
where blocks must first be cleaned before they can be written to.
4K Latency Test - Reads
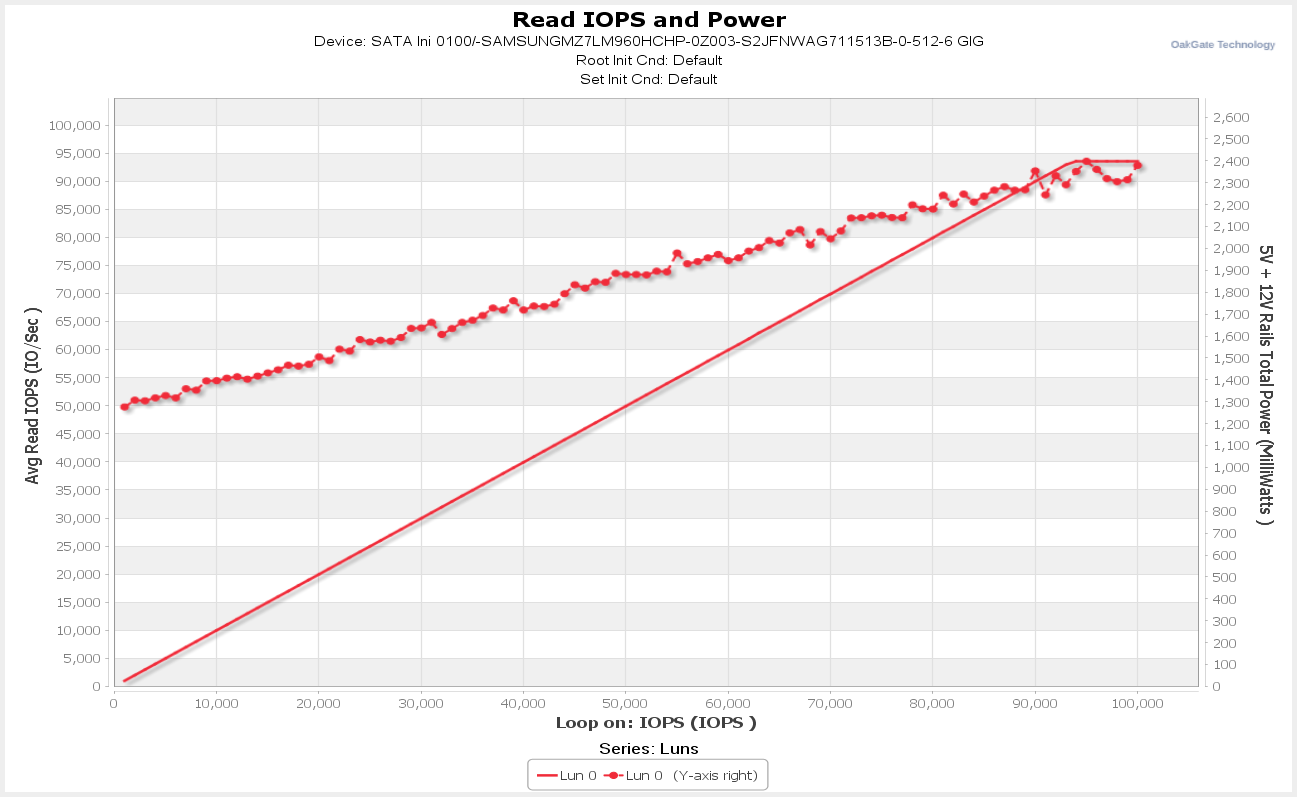
This test allows us to observe how power consumption
characteristics vary as the demand for random 4K reads (in terms of IOPS) is
increased. You can see that the demand for power increases gradually and in a
linear fashion.
As the boost in power consumption rises more slowly than the
increase in IOPS we know intuitively that the sweet spot in regard to IOPS per
mW is at the highest IOPS level.
4K Latency – Writes
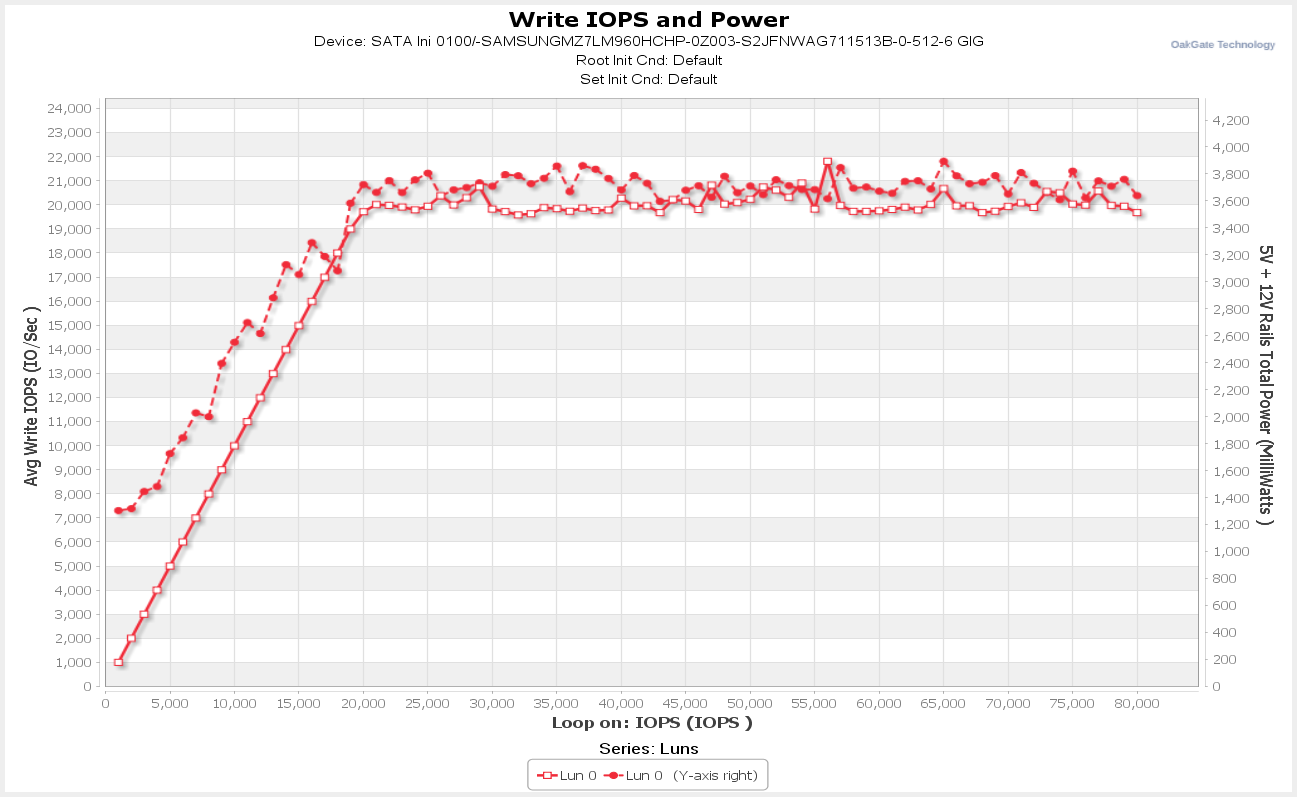
This test allows us to observe how power consumption
characteristics vary as the demand for random 4K writes (in terms of IOPS) is
increased. You can see that the demand for power increases gradually and in a
linear fashion.
4K Mixed Reads/Writes
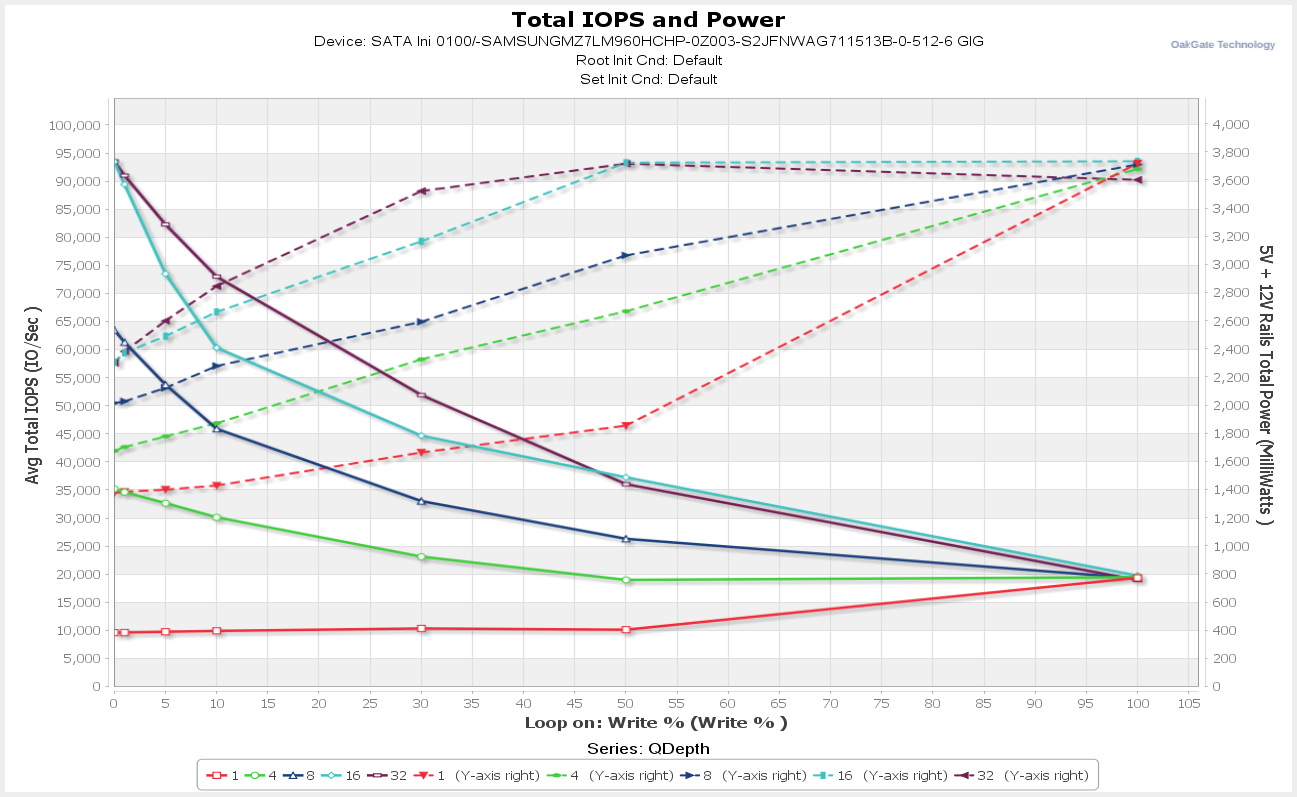
Samsung
specifies average power consumption to be 3,800 mW for Writes and these results
fall within specification.
We have then taken the data to calculate the IOPS per mW for
each combination, as follows –
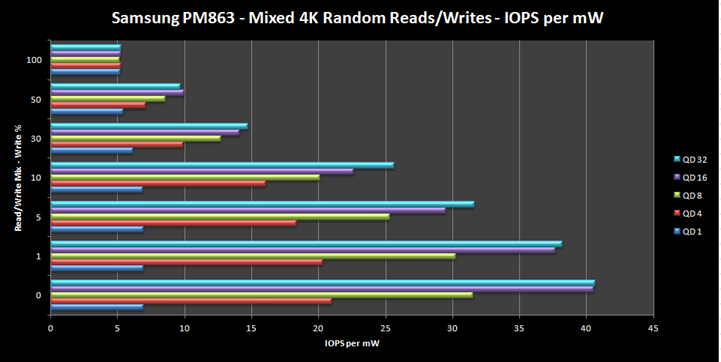
Now let’s compare these results to the best results we have
seen from a drive prior to this review. These are for a Toshiba drive, the
THNSNJ960PCSZ -
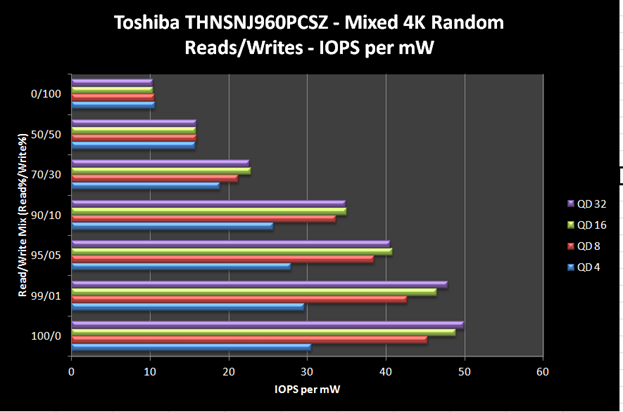
You can see that the Toshiba THNSNJ960PCSZ is more
efficient, but nevertheless this is a good result for the PM863.
Sequential Reads
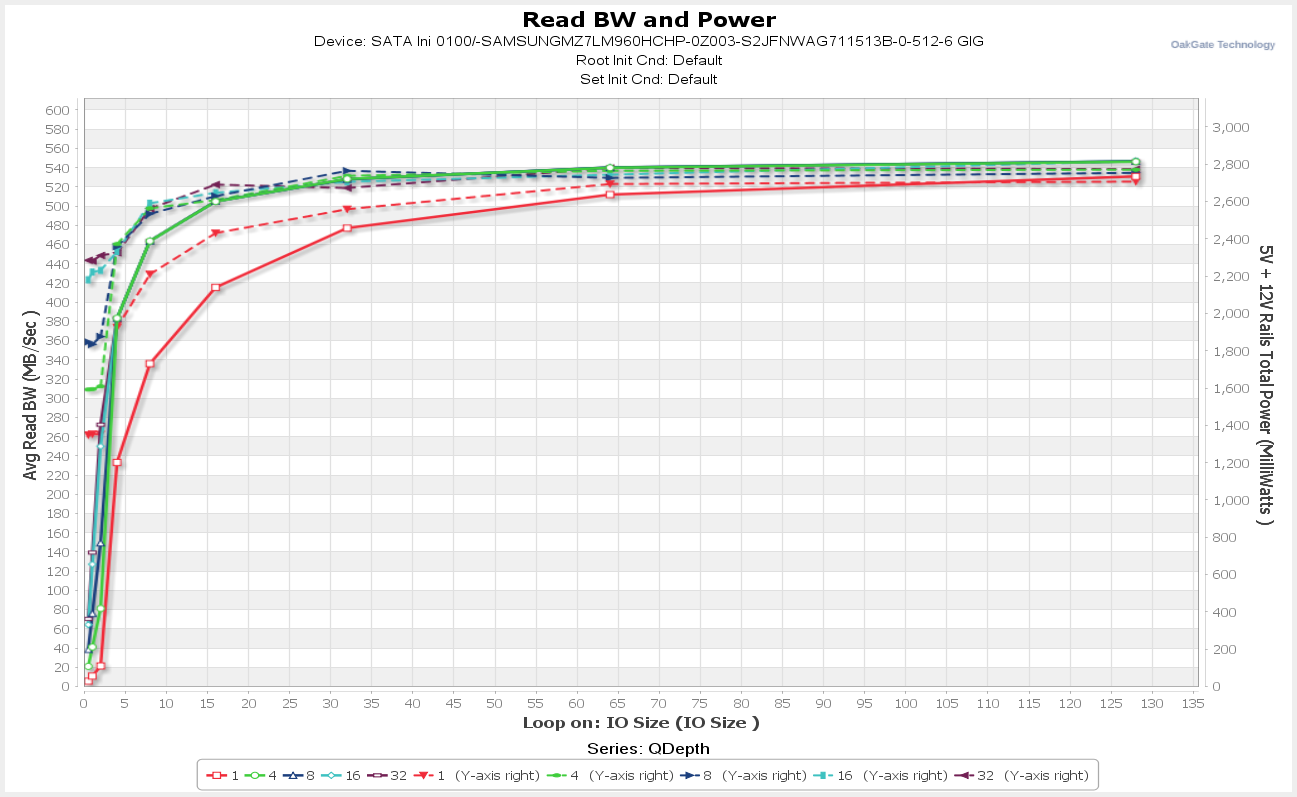
This test allows us to see how power consumption
characteristics vary when performing sequential reads with different
combinations of IO Size and queue depth. As might be expected, the power
consumption increases as the MB/s increases.
Samsung specifies average power consumption for Reads to be 3,000
mW and these results fall well within specification.
We have then
used this data to calculate the MB/s per mW as follows –
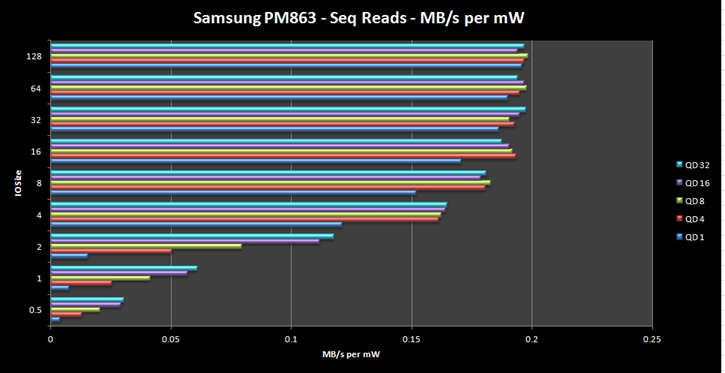
The MB/s per mW results can then be compared to those for
the Toshiba THNSN960PCSZ (the drive with the best power consumption results,
that has previously been subjected to our Enterprise Power Tests).
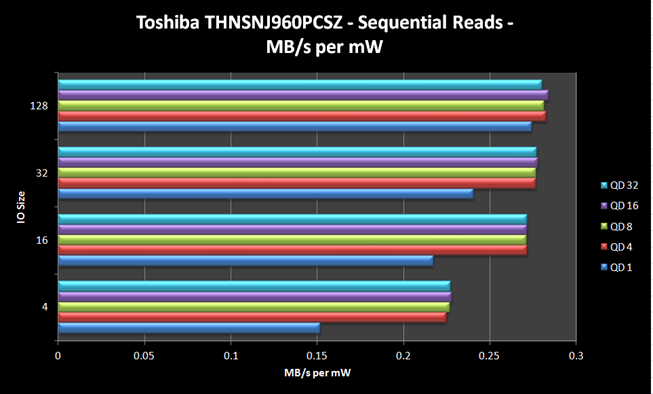
You can see that the THNSNJ960PCSZ is more efficient for
Sequential Reads.
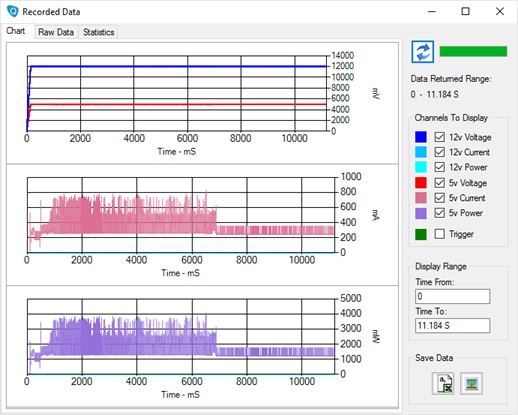
Sequential Writes
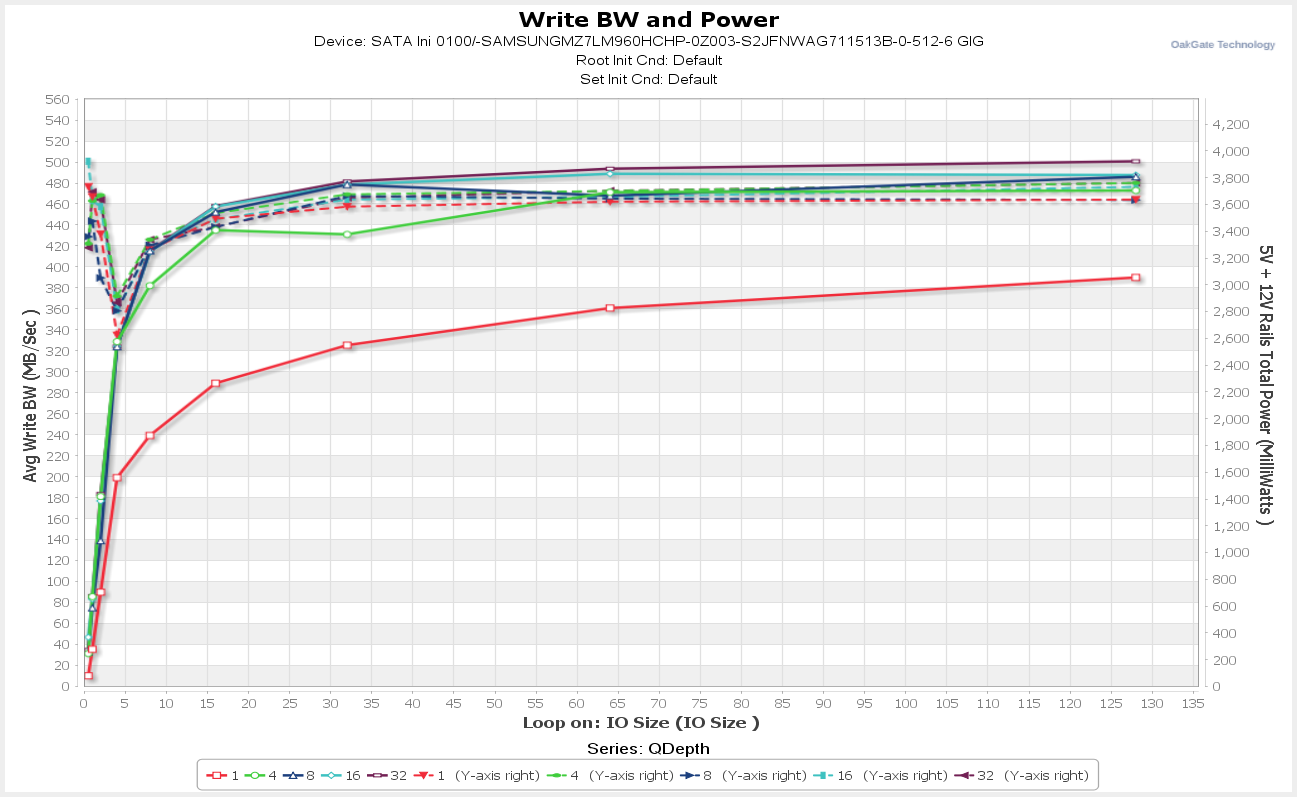
This test allows us to see how power consumption
characteristics vary when performing sequential writes with different
combinations of IO Size and queue depth. As might be expected, the power
consumption increases as the MB/s increases.
We have then used this data to calculate the MB/s per mW as
follows –
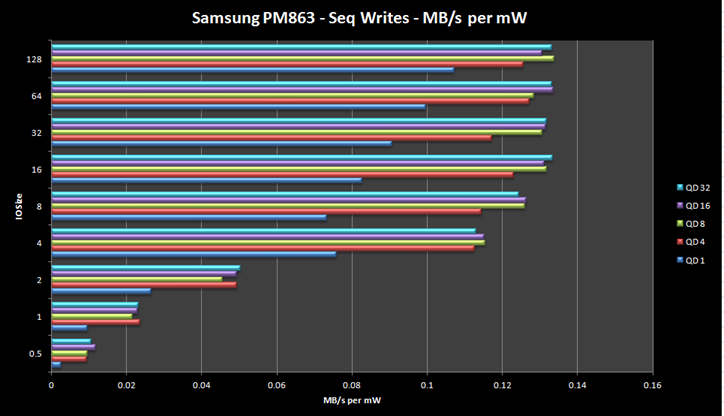
The MB/s per mW results can then be compared to those for
the Toshiba THNSN960PCSZ (the drive with the best power consumption results,
that has previously been subjected to our Enterprise Power Tests).
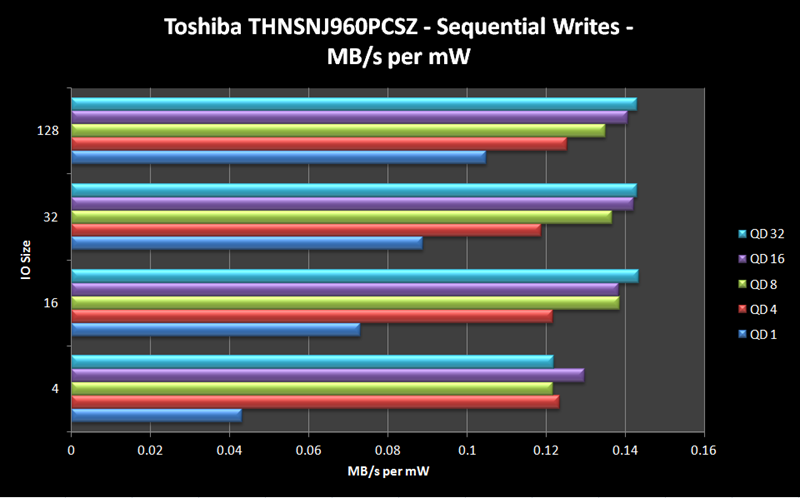
You can see that the THNSNJ960PCSZ is more efficient for
Sequential Writes.
Power Up to Idle
This test allows us to see the shape of the power demand profile
as a drive is powered up. It also allows us to see the peak level of current demanded
to kick the drive into life.
As you can see, power is drawn from only the 5v rail and
peaks at just over 4,000 mW.
Power up to Idle first 150 mS
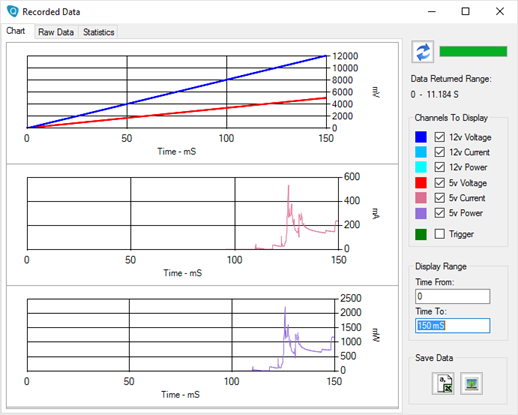
Here is a
closer look at the first 150 mS. You can see that the PM863 kicks into life at
around 110 mS.
Idle
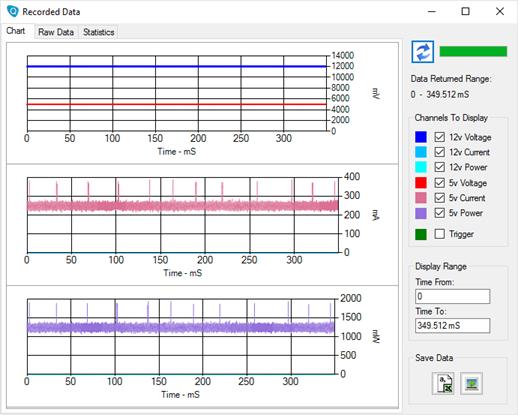
This test allows us to view the power consumption
characteristics when a drive is idling (powered up but with no IO activity).
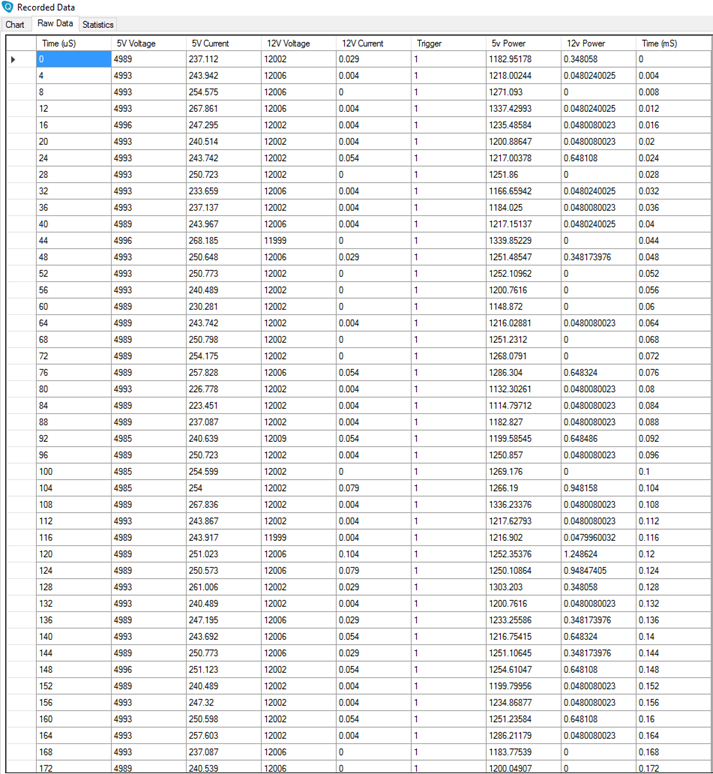
Here is a picture of the raw data values that were recorded.
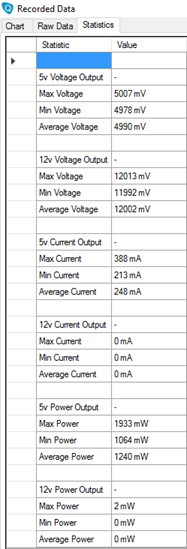
Here are the statistics calculated for the recording.
The average power used when idling was 1,240 mW from the 5v rail,
which is excellent.
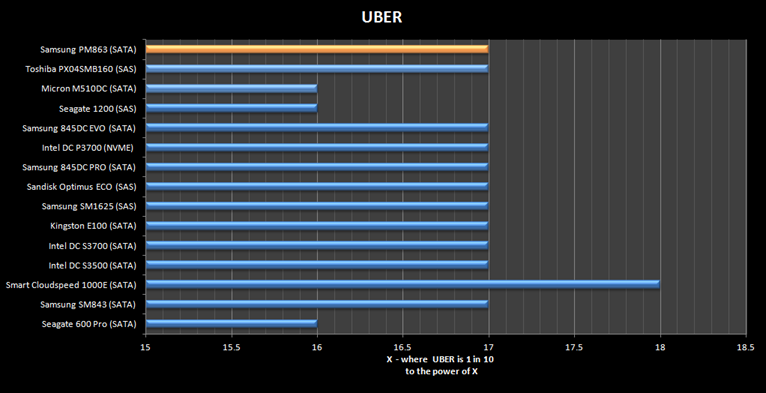
Data Reliability
The 'Unrecoverable Bit Error Rate' (UBER),as defined by
JEDEC, the global leader in developing open standards for the microelectronic
industry, is a metric for data corruption rate equal to the number of data
errors per bit read after applying any specified error correction method. UBER
= number of data errors / number of bits read. JDEC specifies that the maximum
error rate allowable for an Enterprise level SSS solution is one error in every
10^16 bits read.
Samsung specifies an UBER of 1 in 10^17 bits read
for the PM863.
The PM863 is warranted to support up to 1.33 Drive Writes
per Day (DWPD) over 3 years.
The PM863 includes sophisticated power failure support
(which ensures any in flight writes will be completed to NAND in the event of a
power failure) and end-to-end data protection.
Now let's head to the next page, to look at the
Conclusions of this review.....
Conclusions
To help reach a conclusion let’s have a look at how the
Samsung PM863 compares to what are arguably its closest competitors, that we
have thus far tested in the ‘Read Intensive’ arena. The following table especially
focuses on characteristics that are important to the Read Intensive market
segment –
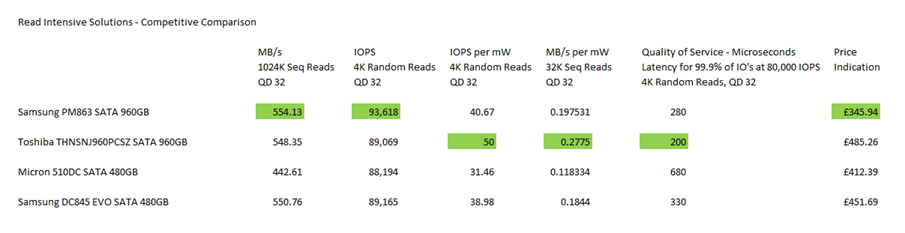
I have tabulated the following characteristics:
Sequential Read Performance – the 1024K IO Size,
Sequential Read performance, as recorded in our SNIA Throughput Test.
Random 4K 100% Read Performance, as recorded in our
SNIA IOPS Test.
Random 4K 100% Read Power Consumption (IOPS per
Milliwatt) at a Queue Depth of 32, as recorded in our Myce/OakGate 4K Mixed
Reads/Writes Tests.
Sequential Read Power Consumption (MB/s per
Milliwatt) at a Queue Depth of 32 and an IO Size of 32, as recorded in our
Myce/OakGate Sequential Reads Tests.
Quality of Service – the Latency Value which 99.9% of
4K Random Read IOs equals or falls beneath at 80,000 IOPS, as found in our
Myce/OakGate 4K Latency Read Test.
Price - an indication of the retail price (inclusive
of transaction tax) as found via pricespy.co.uk for the 960GB model of each
product.
You can see that this is obviously focusing on Read centric
performance characteristics (arguably some of the most important factors for
the Read Intensive Market Segment). The best result for each characteristic is
highlighted in green.
Some observations –
The Samsung PM863 improves upon its predecessor the Samsung
DC845 EVO in every selected criterion.
The Toshiba THNSNJ960PCSZ beats the Samsung PM863 on power
efficiency and on Quality of Service (as recorded in the specific test being
observed).
I am always reluctant to use retail prices for Enterprise
drives that can be found openly on the internet, as I imagine that significant
discounts are available to volume purchasers, however it is apparent from the
prices that I found via pricespy.co.uk that the Samsung PM863 enjoys a
significant price advantage over its competitors.
So, in conclusion I feel that the PM863 is another outstanding
drive from Samsung and I am pleased to award it our highest rating -

p.s. I can’t help feeling that as drive capacities increase,
SATA’s 6GB/s bandwidth constraint will begin to limit the appeal of SATA based
drives (after all as drive capacities increase it follows that the need to
access the data will also increase. For example, if you have currently have 4 x
1TB drives sharing the demand for access and you replace them with one 4TB
drive, the 4TB drive needs to satisfy the demand for access by itself. It will
be interesting to see how the new wave of SAS 3 based drives targeting the read
intensive market will compare, as they offer far higher rates of access. I
notice that Samsung is now offering a new SAS 3 based product – no doubt they see
the writing on the wall. Certainly, the pace of change in the read intensive
market place shows no signs of slowing down.
You may comment on this review here.


")


