|
|
Review: Seagate Barracuda 2TB HDD Reviewed by: Antonis Sapanidis
|
|
|
|

There comes a time when your
hard drive
start to warn you that it is about to fail, and if the drive is almost
seven
years old you might be okay with that, but at least you know that the
drive has
had a useful lifespan. However sometimes things don’t go as planned,
and you
might have a hard drive that is almost seven years old but less than
1600 hours
use. Everything gets more complicated when that drive spent most of its
life
sitting idle, so it's time to update and try to save any data that you
can from
that dying drive. I went out therefore and start looking for a new
drive. I
didn’t want to spend too much money on a hard drive, as I would prefer
to spend
it on a monitor or a new graphics card, so the drive needed to be
affordable,
and it was also required to have similar capacity to the previous
drive. For me
therefore, the best value to performance appeared to be the Seagate
Barracuda
2TB, so I went and purchased this hard drive.
So let's start this review by
taking a quick
look at the packaging and its contents, followed by some benchmarks.
Seagate Barracuda 2TB HDD
As always, I will start this
review by
taking a quick look at the package and the contents that are included,
but in
this case there isn’t anything to show, only the hard drive.
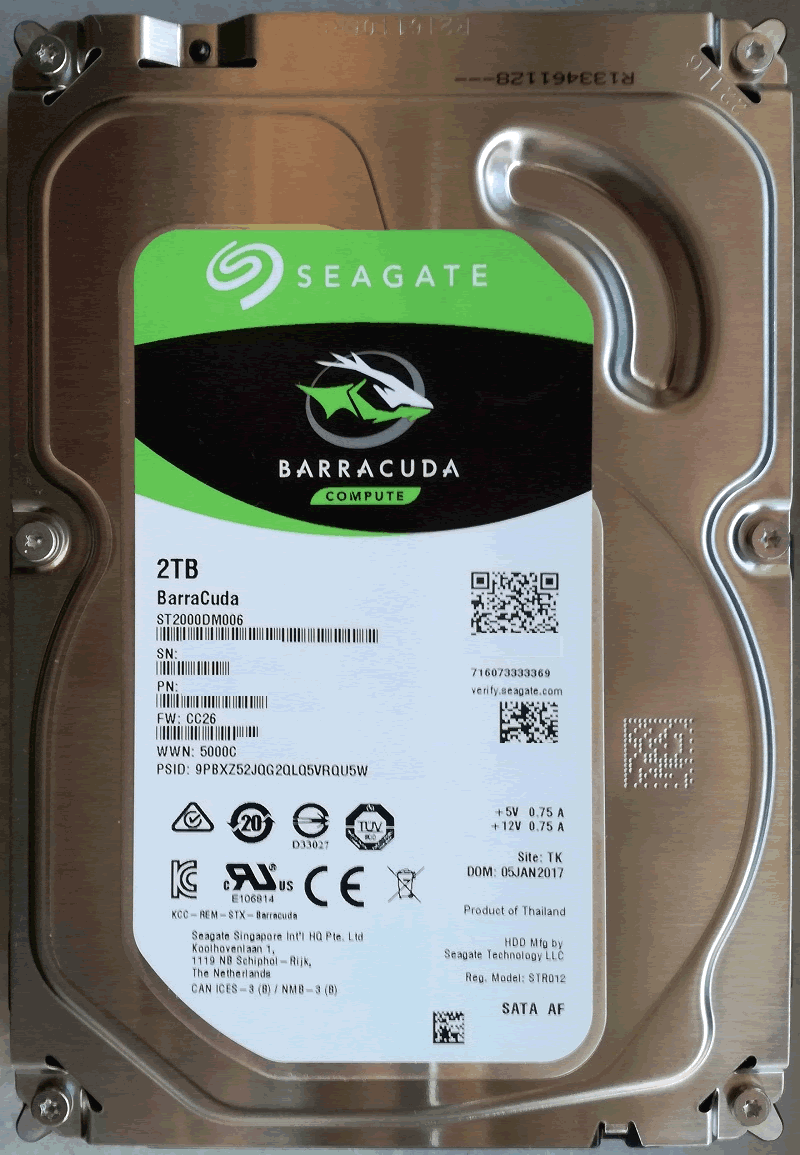
Here is a look at the front of
the Seagate
Barracuda HDD.
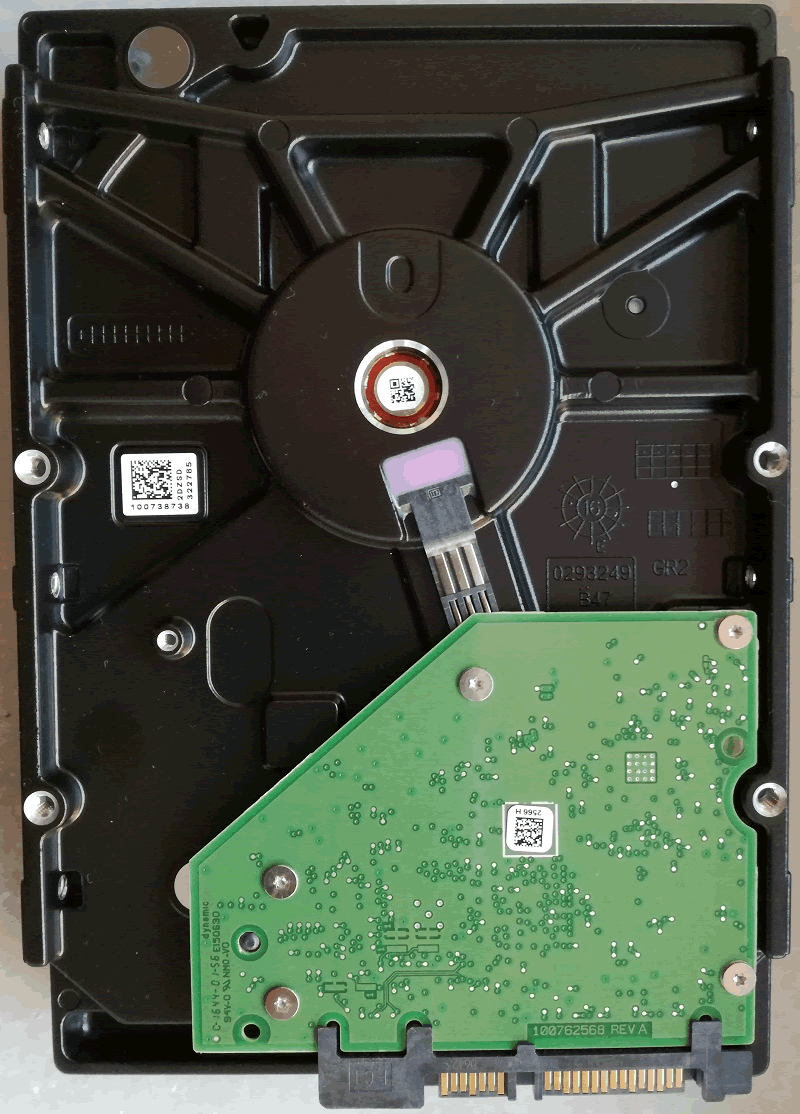
Also the rear of the hard drive.
Specifications of the Seagate Barracuda 2TB HDD
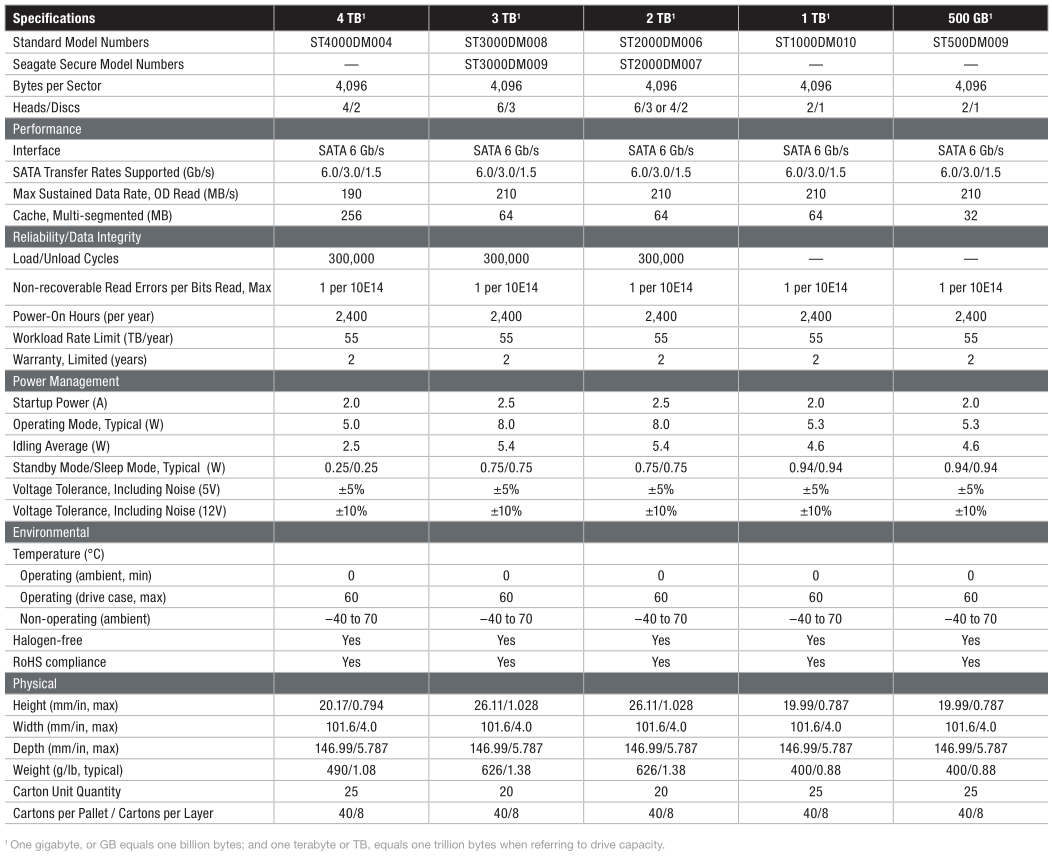
The specifications of the
Seagate Barracuda
hard drive as can be found in this PDF.
CrystalDiskInfo
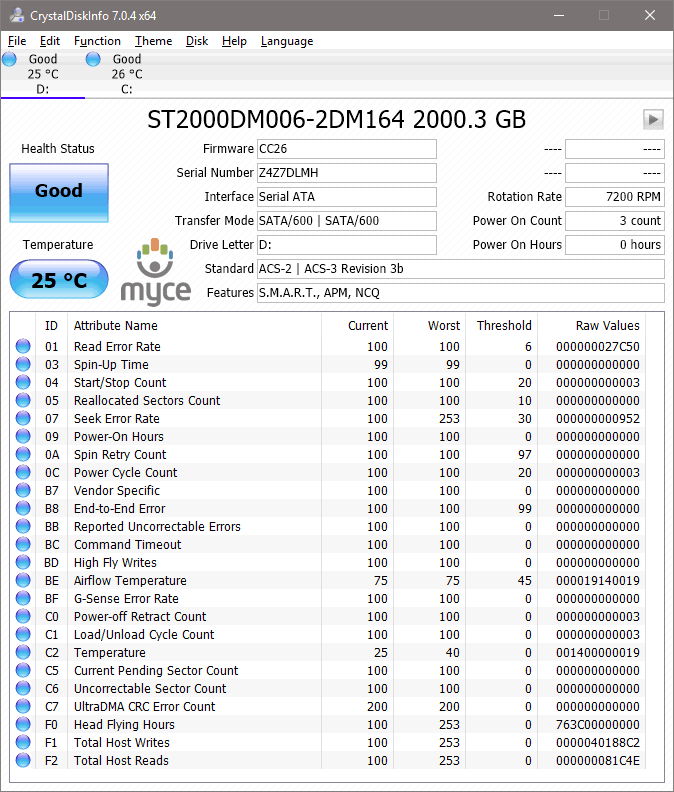
In
the above screenshot we can see all the available info for the Seagate
Barracuda 2TB HDD.
Let’s head to the next page
where we
take a look at our testing methods and the review PC.
Test machine
For this review I will be using
a computer
with the following configuration:
PC 1:
- Motherboard: ASUS X99-A
(Intel X99 chipset) - Processor: Intel Core
i7 5280K @ 4.4GHz - RAM: RAM:
Crucial Ballistix Elite 4x8GB - GFX: MSI GTX 960
2GB - Sound: Onboard
Realtek HD audio controller - OS SSD: HyperX Fury
240GB - PSU: Seasonic 750W
- Display: Futsiju
Siemens 22” - Operating
System: Windows 10 x64
The Seagate Barracuda 2TB HDD
was connected
to the first SATA port of the motherboard. All power saving
features were
disabled during all of my synthetic benchmarks.
Test applications
To test the performance of the
Seagate
Barracuda 2TB HDD will be using the following test applications in this
review.
- HD Tune Pro
- ATTO
- AS SSD
Benchmark - CrystalDiskMark
- Anvil’s
Storage Utilities - PCMark
Test procedures
I will start off our testing
procedures
explanation by stating that I did not run many synthetic benchmarks on
the Seagate
Barracuda 2TB HDD. You may ask why I have run so few synthetic
benchmarks.
SSD technology has moved so
fast in the
last couple of years, that basic synthetic benchmarks alone are now of
very
limited use, as they don't really tell us much about performance and
how the
drive will behave in the real world. I have therefore decided to show
some
basic benchmarks for the Seagate Barracuda 2TB HDD, and will complement
this
with advanced benchmarks using IOMeter and AS SSD benchmark. I will
also show
how the Seagate Barracuda 2TB HDD performs in the real world.
The reality of SSD performance
While I can easily show you
which SSD is
technically the faster, when you use one of these modern SSDs as an
operating
system drive it becomes very difficult to tell them apart as far as
performance
is concerned.
A typical use of a small
capacity SSD at
the moment is to have your operating system and applications installed
onto the
SSD. The performance difference compared to a traditional HDD is
enormous,
however when you start to compare SSD to SSD the difference becomes
almost
impossible to detect.
Let’s look at why this is the
case.
Drive A can boot to the desktop
in 8.11
seconds, and drive B can boot to the desktop in 8.12 seconds, the
difference in
time is milliseconds, and can one really tell the difference?
The fact is, all modern SSDs
are only
ticking over when they are only running the OS and launching
applications, it’s
only when you get to some of the larger capacity SSDs, with enough free
space
to be able to hold the actual data that you’re going to be working
with, be
that video, audio or pictures, for example, that you actually get a
tangible
difference in performance. This is where the SSDs with the better
sequential
performance start to pull well ahead of the SSDs which have lower
sequential
read/write performance.
Small file random IOPS vs sequential performance
IOPS
This is a fairly complex
subject, but I
will do my best to explain things in a manner that is easy to
understand.
The term IOPS is the amount of
input or
output transactions that can take place in a one second interval, so
for
example, if an SSD is quoted as being able to cope with 20,000 4K
random write
IOPS, then the SSD should be able to cope with 20,000 input
transactions in a
period of one second. If the same SSD is said to be able to produce
20,000 4K
random read IOPS, then the same SSD should be able to produce 20,000 4K
random
read output transactions in a one second interval.
Ok, now we have some figures to
work with,
the next question is how many IOPS are actually required?
This will depend on your usage
pattern. If
you are a typical desktop user who browses the internet, does some word
processing or perhaps some audio or video editing, and perhaps plays a
few
games, then in actual fact, you don’t need to have massive 4K random
read/write
performance. The actual amount of 4K random performance that is
required for a
fast and smooth running system for a desktop user with a usage pattern
similar
to the above will be well under 1,000 4K IOPS.
On the other hand, if the SSD
is being used
for running a large and complex database server, then 4K random
performance is
the absolute measurement of how fast that server will run, as this type
of
application does most of its input and output transactions in the 4K
domain.
So why would I need an SSD with
80,000 4K
IOPS for a desktop?
In fact you don’t need this
type of
performance for a desktop, but an SSD which is capable of coping with
80,000 4K
IOPS will be faster than an SSD which can only cope with 20,000 4K IOPS.
OK, I just said if under 1,000
4K IOPS are
actually required for typical desktop usage, why is an SSD with 80,000
4K IOPS
faster than an SSD with only 20,000 4K IOPS, confused?
You may ask, if I only require
1,000 4K
IOPS surely the rest is wasted?
While you may never need 80,000
4K IOPS,
IOPS is all about latency. The reason that an SSD can cope with as much
as 80,000
4K IOPS is because latency in this domain is very low. With 4K files,
even if
you require to process 500 of them at the same time, you are not
talking about
a huge amount of data, it has far more to do with how long it takes the
SSD to
process a single file, and the amount of time required to process a
single 4K
is all about how long it takes for the SSD to access or store that data
before
it can move on to the next transaction.
In other words an SSD with
80,000 4K IOPS
performance will handle those 500 files faster than the SSD with 20,000
IOPS.
So how will a desktop user even
notice this
faster speed if so little 4K random IOPS and data are actually used?
Multitasking is a good example.
The more
tasks you run at the same time, you more you will notice the speed
difference.
Sequential performance
I have always maintained that
sequential
performance was every bit as important as small random file performance
for a
desktop SSD. Some highly regarded people on other sites found this
statement
quite funny a couple of years ago when I made it, but my, how times
have
changed in the world of SSD reviewing.
To me this was always so
obvious for a
desktop user. For example, let’s say you want to launch an application
or game.
Both have some fairly large files to load, and also a great many small
files,
but the point is, even the smaller files are sequential in nature. Now
let’s
say you’re into audio or video editing. Video files tend to be huge,
and the
files are written or read sequentially. Isn’t this how many users are
using
their PCs these days?
Summary
So how does this shape up in
the real
world? Which is better, massive 4K IOPS or massive sequential
performance?
In an ideal world you want
both, as an SSD
with massive random 4K IOPS and sequential performance will always be
faster
than an SSD that has high sequential performance and moderate 4K random
IOPS
performance, and the same applies to an SSD that has massive 4K random
performance and moderate sequential performance. The SSD which has high
performance in both patterns will always be the faster SSD.
However, you can still have an
SSD that is
very fast for desktop use that has moderate random 4K performance and
massive
sequential performance, the same can be said about a drive having
massive
random 4K performance and moderate sequential performance, as it is
about
getting the balance right if you have to compromise on one or the other.
Drive preparation for running the tests
All the SSDs used in this
article were in a
clean and fresh state when the testing period started. From then on,
each drive
had to rely on its own NAND cleaning effectiveness for the remainder of
the
tests.
- Both our spinning HDD drives
were defragged before the start of each test.
- All SSD and HDD used in this
article had their partitions aligned to the Windows 7 x64 defaults.
Where I use graphs in this
article to
display results, I will use the following colours to make it easier,
for our
readers to see which drive we are reviewing.
![]() Seagate Barracuda 2TB HDD
Seagate Barracuda 2TB HDD
![]() Comparison SDD
Comparison SDD
Now let's head to the next
page, where I
look at some basic benchmarks...
Reading Benchmarks
HD Tune
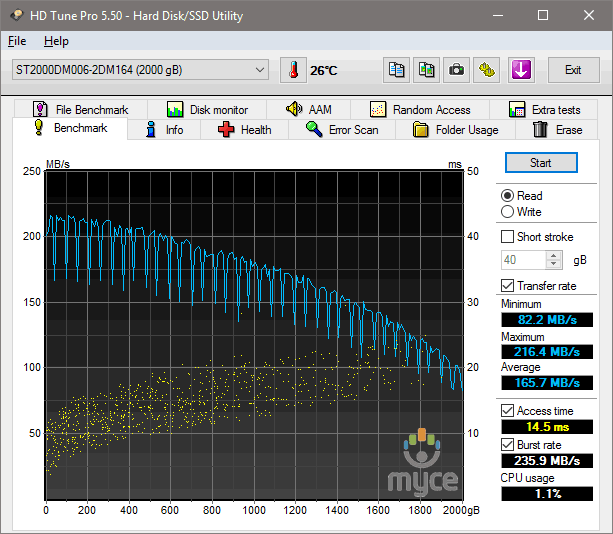
HD
Tune Test – Sequential reading test 4MB
The result is very good for a
mechanical
drive.
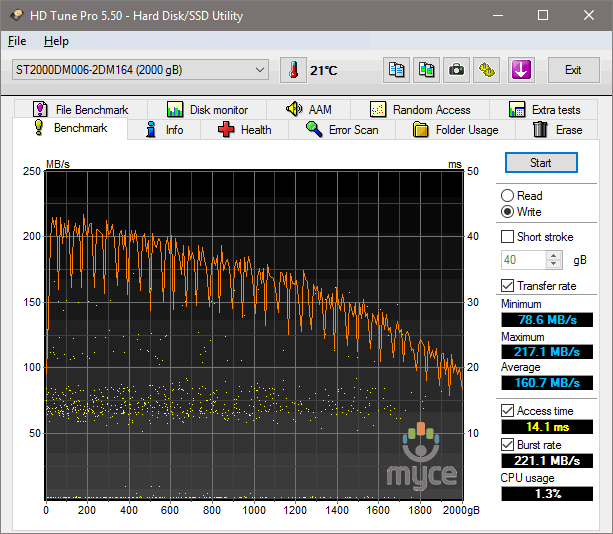
Here
is also the write test for the Seagate Barracuda 2TB HDD.
As we can see the drive starts
to lose speed
as it get closer to the outer edge, so over time, and when you start
filling
the drive with data, you will see a drop in the write speed.
ATTO disk benchmark
ATTO has become a standard tool
for measuring
the data throughput of HDDs and SSDs. It measures the reading and
writing
performance, using different file sizes and block sizes.
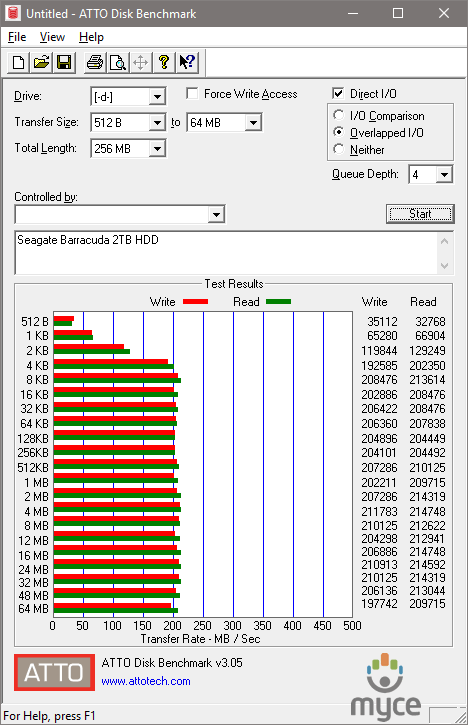
With ATTO we can extract the
maximum
performance from the Seagate HDD.
CrystalDiskMark 3.0
CrystalDiskMark is quite a
handy
benchmarking application, as it focuses on the file sizes that can
cause problems
for a system drive.
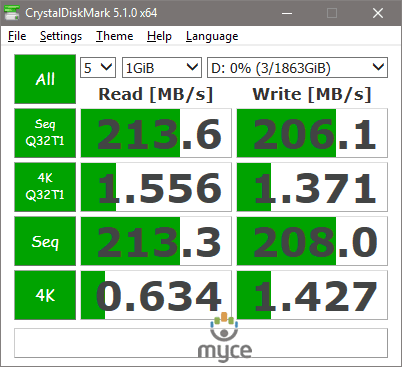
The result for the Seagate
Barracuda HDD is
very good for sequential reads and writes, but in the 4K test, as
expected, the
numbers were very low.
Anvil’s Storage Utilities
As well as performing SSD
endurance tests.
Anvil’s Storage Utilities has a very nice SSD benchmarking application.
The SSD
benchmark tests many different aspects of SSD performance, including 4K
random
at different queue depths, and also sequential performance, but more
importantly than this, all using real test data.
Another very nice feature of
Anvil’s SSD
benchmark is the fact that you can change the compression levels of the
test
data. The compression levels of the data sets used for the tests can be
varied
from 0% compression right up to 100% compressed data, and there are
even a few
data profiles already included, such as database (8%) compression, and
also an
application profile (46%) compression, which is designed to simulate
real
application data being read and written to the SSD.
Anvil’s Storage Utilities is
still in beta
at the moment, but the application is currently solid enough to use in
this
article, and I have already verified the results obtained using an SATA
analyser.
I will include a screenshot of
the review
drive, and all comparison results will be presented in the form of
graphs. If
you would like to see screenshots of the test results obtained on the
other
SSDs in this article, you can do so by following the link here.
I will also be testing three
different
compression profiles, which are as follows.
- 100% (non compressible data)
So let’s begin the tests.
100% Incompressible
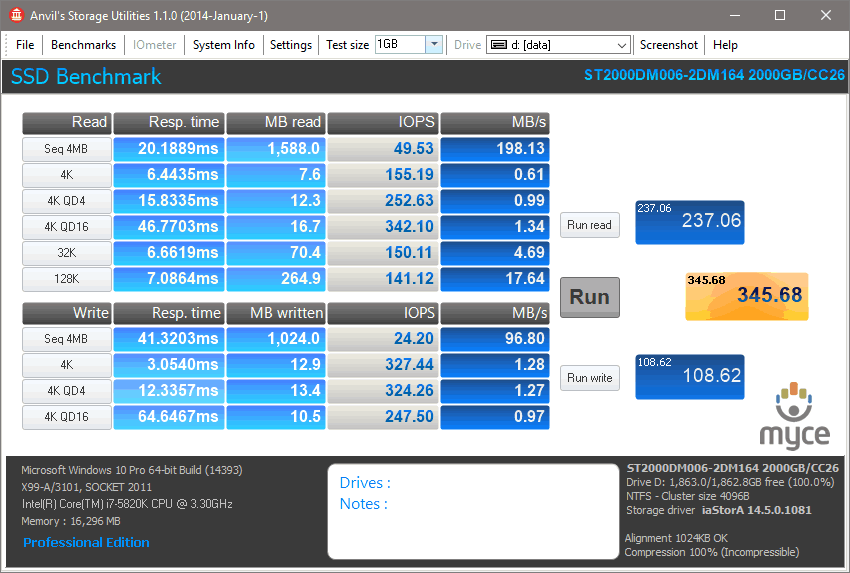
The results for the Seagate Barracuda HDD are not that impressive, and
the
numbers that we get show that this is not the best drive for your OS,
on the
other hand if you plan to use the drive for storage then things look
better.
Let's head to the next page
and run some
tests using PCMark 8.....
PC Mark 8 - HDD Suite
We have built quite a close
relationship
with FutureMark software, the authors of the PCMark PC benchmarking
software
that we use in our tests. I decided I would use PCMark Vantage as
stopgap
measure until the more up-to-date PCMark 8 benchmarking suite became
available.
I'm pleased to say that PCMark 8 is now available, and it gives me
great
pleasure to introduce you all to the results obtained by this new 'real
world'
benchmarking suite.
I will describe the basic way
that each
test is carried out, above the graph for each test.
PC Mark 8 HDD suite results
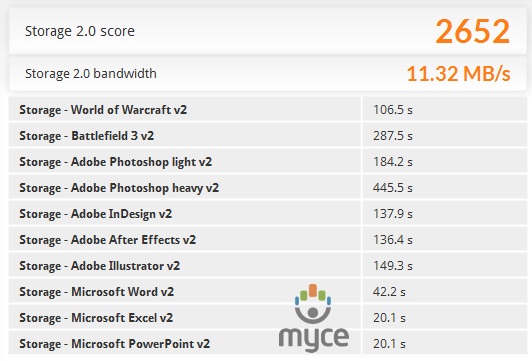
Here
is a screenshot displaying the results for the Seagate Barracuda 2TB
HDD, and for
reference only I will leave the results I have from the various other
SSDs that
I have tested.
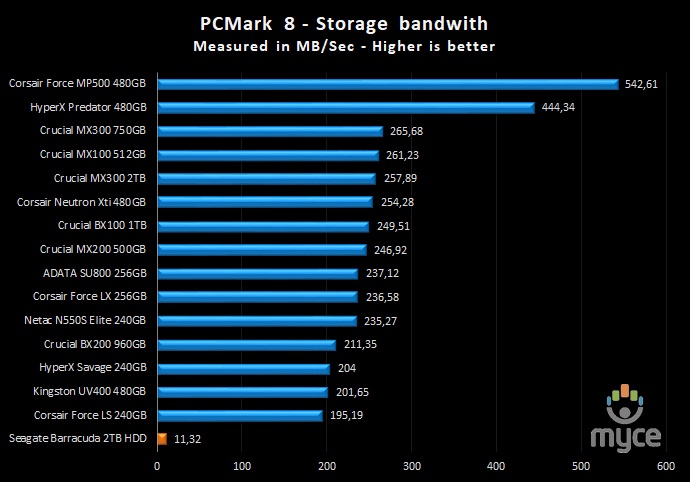
PCMark 8 storage bandwidth. If
for some
reason you want to see how it compares with other SSD drives, you can
click here.
Summary:
It's clear that there is no
point in trying
to compare any spinning drive with an SSD as the HDD will always lose,
but
still, those spinning drives are excellent value for money when you use
them as
storage drives.
Now let's head to the next
page for some
real world tests....
It has become clear that simply
conducting
endless benchmarks on SSD drives is pointless. Real users may run a few
benchmarks when they first fit their SSD drive, but most users just
want a
drive that performs well in the real world. They want their drive to
work
"out of the box" and work fast and smoothly.
Most of the latest SSD drives
can deliver
very fast sustained reading and writing speeds, but these alone tell
you very
little about how the drive will perform in the real world.
If you intend to use your SSD
as your
primary system drive, with an operating system and applications
installed and
running from the drive, real world performance becomes much more
important than
just fast sequential read and write speeds, in this case I felt that it
was
time to move into a different method of testing.
From now on I will only use the
log files
from the Event Viewer to measure the start-up and shutdown of the
system, and
also use filecopy to measure all my copy tests from a RAM disk to the
selected
storage drive that I will be testing. For these tests I will also
enable all
power savings features that are available, since I believe that this is
the way
that the majority of the users will have them set on their PC.
Real
world copy tests
I will now conduct some real
world copy
tests so that you can have a much better view of how the drive will
perform. In
these simple tests I try to simulate what a real user does with their
drives. I
will be copying some mp3 files, various picture and MKV files, and
finishing by
installing MS Office 2007.
As I said earlier from now on
all my test
files will be stored in a RAM disk and copied/pasted to the destination
drive
using filecopy. The filecopy utility will be used from now on for all
my tests,
and I’ll be using it this way to measure the time that it takes to copy
the
files.
Before I move on to the test, I
want to
give you an idea on how fast your RAM is. Below you can find the
results.
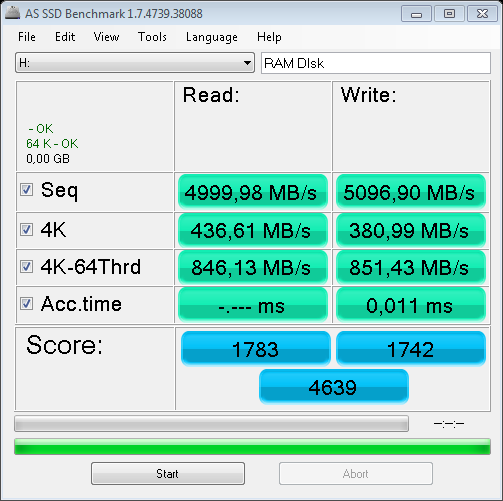
As
we can clearly see speed isn’t going to be an issue in these tests.
Read write tests – 259 MP3 song files (1.36GB
total)
I will start this set of tests
by copying
259 MP3 files from the RAM disk to the destination SSD and also from
the SSD to
the RAM disk.
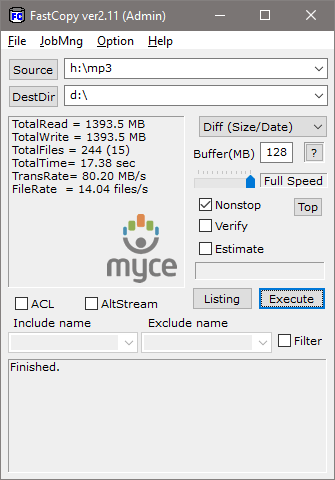
Copying
files from RAM to HDD

Copying
files from HDD to RAM
The read result is very good,
but the write
test isn’t that impressive.
Read write tests – 3,377 JPEG picture files
(2.56GB total)
Continuing my set of tests, but
this time I
will be copying 2.54GB of pictures that are stored in the RAM disk to
the
currently testing SSD and vice versa.
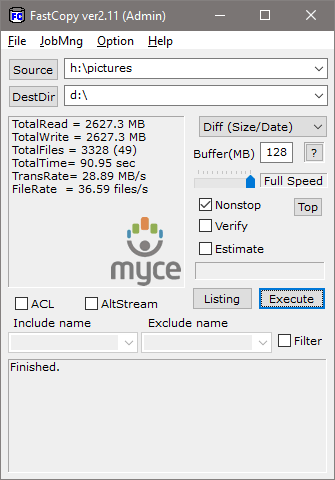
Copying
files from RAM to HDD
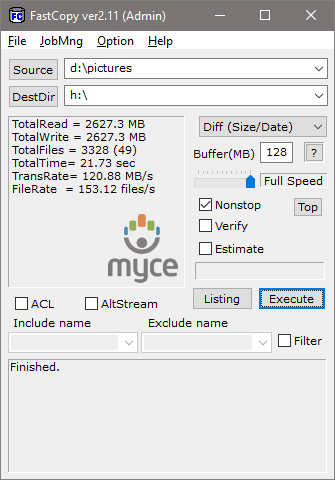
Copying
files from HDD to RAM
As it was expected, with
smaller files the
performance of the HDD is just poor, the write speed is even lower and
shows that
drive does not like small files, but read speed is still acceptable.
Read write tests – 1 MKV and 1 SRT file (3.46GB)
Copying a movie is very common
task for all
of us, and in this test there are two files that will be copied from
the RAM
disk to the SSD and again from the SSD to the RAM disk.

Copying
files from RAM to HDD

Copying
files from HDD to RAM
As I said, if you are planning
on using the
drive for storage, both read and write speed won't be an issue, but
keep in
mind that as you fill the drive with data both results will be
slower.
Read write tests – ISO (7927MB)
For this test, I copied ISO of
the 'Iron
Man' movie from the RAMDisk to the SSD and vice versa.
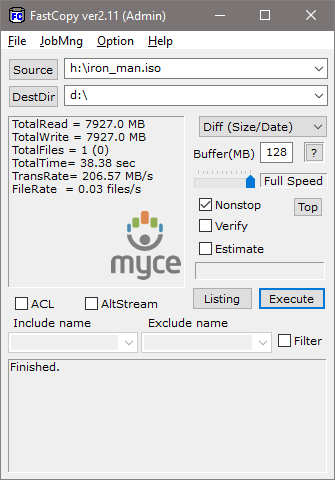
Copying
files from RAM to HDD
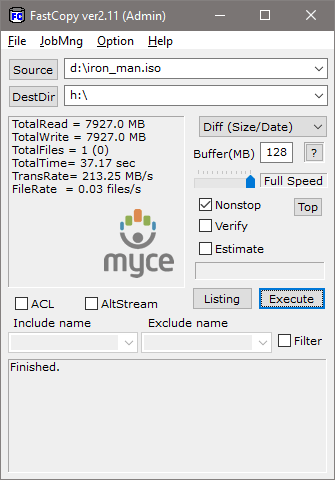
Copying
files from HDD to RAM
The drive was empty for this
test and the
overall performance was very good.
Windows start-up based on the Boot Racer 5.00
Start-up time
On the next screen shot you can
see the
time that the Seagate HDD needed to boot into the OS. Before running
this the
drive was defragged.
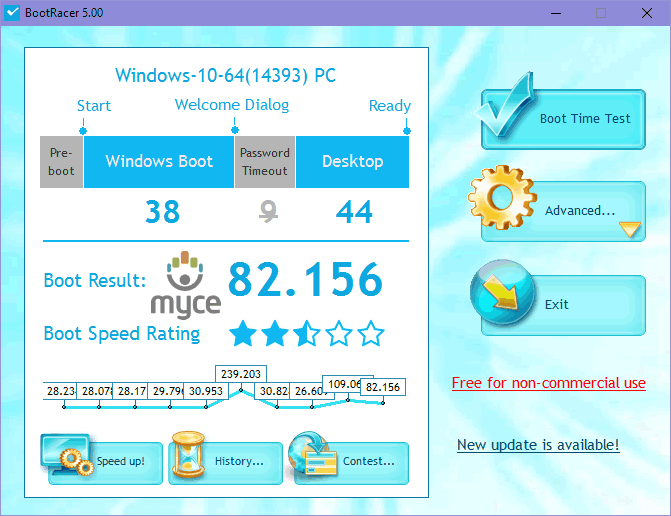
If you are planning on using a
spinning
drive as your boot drive, then you need to have a lot of patience, as
82
Seconds is a lot of time for a drive that had been defragged before I
ran the
test, so over time I wouldn't be surprised to see numbers closer to
100-120
seconds.
This concludes our review.
To read the final
thoughts and conclusion, click the link below....
Closing thoughts.
I will start by saying that I
am not happy
with the two-year warranty that most new hard drives offer, and you
have to pay
a nice premium to go above three years or closer to five. The main
thing that
lets this drive down is the warranty. The read write performance of the
Seagate
Barracuda HDD is acceptable, and you should have more than enough speed
for
your daily needs, as long as you are planning to use it only to store
data and
especially large files. However if you have plans on having the Seagate
Barracuda hard drive as your main drive… then I would suggest to going
and
buying the SSHD hard drive, and hopefully you will get a little boost
in the
overall speed.
To sum up, this is what I would say:
“As long as you need a hard
drive for
storage then the Seagate Barracuda is a good drive, with an affordable
price.”
Therefore, I give the 'Good'
rating to the Seagate
Barracuda 2TB HDD.

Thanks to:
|
|
EFD Software for providing the |
|
|
Alex Schepeljanski |
|
|
|
|
|
FutureMark for providing a |
|
|
Quarch Technology for providing the |


You may comment on this review
below, you
can also post your benchmarks in our forum.


")


