|
|
Review: Smart Storage Systems Optimus 400GB |

Introduction
Welcome to Myce’s review of the Smart Storage Systems Optimus
SAS Enterprise SSD.
Smart Storage Systems (hereafter referred to as Smart) is a
member of the Smart family of global companies. This family is a leading
supplier of electronic subsystems for the most demanding OEMs around the
world. So, whilst Smart may not be as well known as some of the household names
such as Intel and Samsung, they are very well known to the large OEMs, such as
IBM having won large scale contracts for the supply of Solid State Storage
(‘SSS’) solutions to be used within OEMs’ integrated server solutions.
I find the term OEM a bit confusing, it stands for ‘Original
Equipment Manufacturer’, so it sounds to me as if Smart is an OEM but within
the computer industry it is the IBMs of this world (the systems integrators that
buy specialist parts from other companies, which they then package into an
integrated solution for their customers) that are regarded as the OEMs.
Smart was acquired by the Silver Lake, Private Equity
Company in 2011. Silver Lake is widely regarded as being the global leader in
technology investing with over 23 billion USD in combined assets under management
and committed capital. They are also regarded as having unparalleled
Technology Sector expertise and have a reputation for investing in market
leaders that are positioned for dynamic growth. So suffice to say, Smart is
well funded and is, in my opinion, very likely to be one of the big winners in
the SSS industry as the battleground continues to grow in the coming years.
Market Positioning and Specification
Market Positioning
Smart differentiates the Optimus in two ways:
Firstly, and simply, they assert that it is the fastest SAS
Enterprise SSD. We’ll look at this in our Performance Testing.
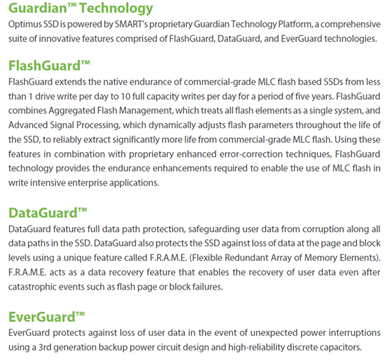
Secondly, they believe their proprietary Guardian Technology
is a key differentiator from competitors’ solutions. This is how Smart
positions the Guardian Technology -
And here is a video, which explains it further -
Specification
Here is Smart’s specification for the Optimus (taken
directly from Smart’s Product Overview PDF) -
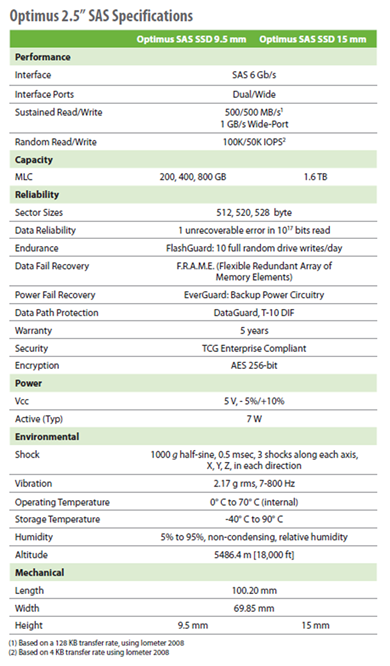
I understand that the Optimus Ultra and the Optimus Ultra+ SSD
models, also offered by Smart, are essentially the same as the standard Optimus
except for greater levels of over provisioning and the number of random Drive Writes
Per Day (DWPD) warranted - the standard Optimus is warranted for 10 DWPD for 5
years, the Optimus Ultra for 25 and the Optimus Ultra Plus for 50.
Product Image

Here is a picture of the Optimus drive I tested. The
picture shows it plugged into a ‘T Card’ which enables access to both ports for
testing dual/wide port performance.
I understand the Optimus uses Toshiba 24nm toggle NAND. It
has a total of 512GB of NAND with 112GB being set aside for over provisioning
and use by the controller. The controller is a proprietary Smart solution.
Now let's head to the next page, to look at Myce’s
Enterprise Testing Methodology.....
Testing Methodology
Please click
here
to view or download a detailed introduction to Myce’s Enterprise Class Solid
State Storage (‘SSS’) Testing Methodology as a PDF.
Put briefly:
All testing is performed on an OakGate Technology test unit
We perform two sets of Performance Tests:
- A full set of the mandatory Storage Network Industry
Association’s (‘SNIA’) tests as specified in their Solid State Storage
Performance Test Specification Enterprise V1.0 – SNIA
SSS PTS Version 1.0. - A set of tests, known as the ‘Myce/OakGate Full
Characterisation Test Set’, that provides readers with a fuller
characterisation of the solution.
We also review other important factors such as Power
Consumption, Data Reliability and Failover features.
As the Smart Optimus supports dual/wide port we performed
all tests in single and wide port modes – we publish both sets of results for
the Myce/Oakgate Full Characterisation Test Set and for the SNIA Throughput
Test. I should mention that the OakGate Test Unit has an option to
automatically split the queue depth specified for a test equally across each
port when testing is performed in dual port mode, so for example where a test
specification states a Thread Count/Queue Depth of 32 it is split 16 to port 1
and 16 to port 2.
A word about SNIA testing – before striking a partnership
with OakGate Technology I spent some time researching how I may implement SNIA
testing using freely available tools such as IOMeter and FIO. I arrived at the
conclusion that whilst it was theoretically possible it was impractical. The
reason for this is as without the automation offered by a test bench, such as
the OakGate Unit, the only way to meet the SSS PTS requirements is to run the
maximum number of test cycles and then to manually look back at the results to
determine when/if steady state has been achieved in the workload specific test
cycle, and then harvest the data from the qualifying Measurement Window. this
means that the test runs would always take a maximum elapsed time, and there
would be a great deal of human effort required to review, gather, and report
upon the data. I empathise with, acknowledge and respect the efforts of other
reviewers who endeavour to meet the SNIA’s principles in their testing - I am
privileged and thankful to be able to use a superb test bench which automates
the whole process and allows me to meet the SNIA’s specification in full.
Before we move on, let’s remind ourselves of some basics –
When reviewing the performance of an SSS solution there are
three basic metrics that we look at:
1. IOPS – the number of
Input/Output Operations per Second
2. Bandwidth – the number of
bytes transferred per second (usually measured in Megabytes per second, ‘MB/s’)
3. Latency – the amount of time
each IO request will take to complete (usually, in the context of SSS
solutions, measured in Microseconds, which are millionths of a second).
It is true to say that IOPS and Bandwidth had all been
growing rapidly before the advent of SSS solutions, but Latency can only be significantly
decreased by eliminating mechanical devices, and thus Latency is the single
most important aspect that SSS solutions deliver to enhance performance.
Latency in a technical environment is synonymous with delay.
In the context of an SSS solution it is the amount of time between an IO
request being made, and when the request is serviced.
Bandwidth, also commonly referred to as ‘Throughput’, is the
amount of data that can be transferred from a storage device to a host, in a
given amount of time. In the context of SSS solutions it is typically measured
in Megabytes per second (MB/s).
A great enterprise SSS solution
offers an effective balance of all three metrics. High IOPS and Bandwidth is
simply not enough if Latency (the delay in an IO operation) is too high. As we
will see in the test results presented below, as Latency increases IOPS will
inevitably decrease.
Queue Depth is the average amount
of IO requests outstanding. If you are running an application and the Average
Queue Depth is one or higher and CPU utilisation is low, then the application’s
performance is most probably suffering from a ‘Storage Bottleneck’.
Another important factor to
remember is that SSS performance is influenced by previous workloads, not just
the current workload, and especially by what has previously been written to the
drive. As specified in the SNIA SSS PTS the goal of all good Enterprise level
testing is to provide consistent circumstances, so that results can be compared
fairly across different SSS solutions – it is for this reason that all of our
tests start with a purge of the drive, so that it starts in a ‘Fresh Out of the
Box’ (FOB) state. Most tests then have a pre-conditioning phase where the
drive is put into a ‘Steady State’ before the test phase begins. Put briefly, a
‘Steady State’ is achieved when the performance of the drive no longer varies
over time and settles into a consistent level of performance for the workload
in hand. You can find a detailed explanation of ‘Steady State’ and how it is
determined in the SNIA tests in our Enterprise Testing Methodology paper, which
can be viewed or downloaded as a PDF by clicking here.
For interest, here are some
generally accepted assumptions that differentiate the use and therefore the
approach to testing Enterprise/Server and Consumer/Client SSS solutions:
Enterprise/Server SSS
assumptions:
- The drive is always full
- The drive is being accessed 100% of the time (i.e. the
drive gets no idle time) - Failure is catastrophic for many users
- The Enterprise market chooses SSS solutions based on their
performance in steady state, and that steady state, full, and worst case
are not the same thing
Consumer/Client SSS
assumptions:
- The drive typically has less than 50% of its user space
occupied - The drive is accessed around 8 hours per day, 5 days per
week, and typically data is written far less frequently - Failure is catastrophic for a single user
- The consumer/client market generally chooses SSS solutions
based on their performance in the FOB state
Esther
Spanjer, Director, SSD Technical Marketing at Smart Storage Systems, said, 'I
am happy to commend Myce for their high level of professionalism and
cooperation during the review process', Ms. Spanjer added, 'I wish them every
success in their partnership with OakGate Technology and their initiative to
provide authoritative performance reviews for the Enterprise Solid State
Storage market'
Now let's head to the next page, to look at an
introduction to the SAS protocol.....
Serial Attached SCSI, ‘SAS’ (in comparison to SATA)
Before looking at the test results I thought it would be
interesting to review at a high level what it means for a drive to be SAS based
and how it compares to SATA based drives (which consumers and many of our
readers are used to). This is a complex subject and I’m going to deliberately
try to keep things simple and hopefully understandable to non-expert readers (and
me; and I thank expert readers for their patience).
Serial Attached SCSI (‘SAS’) has become the de facto storage
standard for mission critical Enterprise systems. SAS utilises the Small
Computer Systems Interface (‘SCSI’), which is a set of standards, including a
functionally rich and proven command set, for the physical connection and
transferring of data between computers.
There are three types of SAS devices:
1. Initiators
Initiators include Host Bus Adapters (‘HBAs’) and
Controllers. They are the point at which an IO operation is initiated and sent
to a Target Device. Initiators are located in Host Computers/Servers. An
initiator allows the attachment of one or more Target Devices and Expanders to
form a ‘SAS Domain’
2. Target Devices
Target Devices include SAS devices, such as SAS HDDs, SAS
SSDs and SAS Tape Drives. A SATA HDD or SSD can also be attached as a Target
Device.
3. Expanders
Expanders are low cost, high speed switches, which allow the
number of target devices attached to a SAS Domain to be increased.
It is worth noting that a SATA drive can be attached as a
Target in an SAS domain; however, an SAS device can not be attached to an SATA
controller. SAS and SATA Target Device connectors are physically very similar,
but a ridge between the data and power connectors stops an SAS target connector
being plugged into an SATA device.
Target Devices are attached to initiators through one or
more SAS links. At the initiator, SAS links are typically arranged into groups
of 4 (or 8), known as a wide port. Mini SAS 4 Link Cable Connectors are
typically used to connect internal (‘in the host’) initiators to external
(‘outside the host’) physical storage device containers/racks.
SATA is also a protocol for the attachment of storage
devices to host controllers and adapters. It is an evolution from the old PATA
standard. SATA is by far and away the dominant protocol used in Desktop PCs. In
Desktop systems SATA devices are attached to an Advanced Host Controller
Interface (‘AHCI’), which usually resides in the Host Chipset. Generally
speaking, SATA is less functionally rich but has the advantage of being less
complex, and thus SATA devices tend to be more affordable. In recent times the
differentiation between SAS Enterprise class SSDs and SATA Enterprise class
SSDs has become less clear as advanced SATA based solutions have come to
market, such as the excellent Intel DC S3700 that we reviewed recently. Having
said this it is also true to say that many traditional storage experts believe
that an SATA based drive is simply not up to the demands of mission critical
enterprise systems and the necessary configuration of fault tolerant hardware
configurations.
All SAS based storage drives have at least two ports, whilst
SATA based devices only have one. SATA is a point to point solution and a
device may only be attached to one port on an SATA controller or one SAS link
in a SAS topology.
SAS supports ‘active cables’, which are thin cables with
active circuitry to reduce cable weight and increase signal voltages; this
allows SAS cable lengths to be up to 10m long, whereas SATA cable lengths are
limited to 1m. Cable length is an important consideration when designing the
physical implementation of an SAS multi-domain, high availability, topology.
SAS Target Devices can therefore be attached to more than
one SAS domain (and therefore more than one Host), so that if one Domain
(Host/Controller/HBA) fails it can still be accessed through another; this
ability to design in fail safe measures is considered to be a significant
advantage in Enterprise systems.
So, for example an SAS based implementation could look like
this, where the dual port capability of SAS drives is used to provide a high
degree of protection against the failure of an initiator and/or it’s Host –

In this configuration an access path to each of the SAS SSD
Target Devices can survive a failure of one of the Hosts/Servers, one of the
Initiators/HBAs, one of the Expanders, one of the 4x wide port connector cables
between Host and Expander or indeed one of the individual SAS Links between
Expander and Target Device.
Some SAS Target Devices also allow their multiple ports to
be attached to one initiator, thus allowing bandwidth to be aggregated over
multiple SAS links, allowing data to be streamed in both directions and thereby
providing significantly improved performance. The use of multiple links in a
connection to a Target Device is referred to as a ‘Wide Port’. Excitingly, the
Smart Optimus has a two link wide port (or ‘dual/wide port’) capability and the
potential for improved performance (theoretically up to a bandwidth of 1200 MB/s)
is investigated in this review. I understand the term ‘Wide Port’ is used for
any connection between SAS devices that uses 2, 4, or more SAS links.
The SAS standards continue to evolve and we are already
seeing 12Gb/s (1200MB/s, single link) SAS solutions come into the market. It
will be interesting to see how the performance of the Smart Optimus in dual
wide port mode compares to the early single link 12 Gb/s solutions.
Lastly, it is worth noting that SATA does not support
Queue Depths beyond 32 whereas SAS supports Queue Depths up to 256 (although
most SAS SSDs run up to a Queue Depth of 128).
Now let's head to the next page, to look at the results
of our SNIA IOPS (Input/Output Operations per Second) Test.....
SNIA IOPS Test
Here is the specification for this test -

IOPS performance will typically
vary greatly depending on the nature of the IO traffic, including the mixture
of Read and Write operations, and the mixture of Block Sizes (the size of the
IO operation’s data packet, also referred to as IO Size). This test is designed
to benchmark the IOPS performance profile for random IO operations for 56
different combinations of Read/Write mix % and Block Sizes when in a Steady
State, which are of interest to most users.
All of the SNIA’s test
specifications define a ‘required’ set of parameters that must be run for the
test and then allow the operator to elect to run additional tests with
different parameters of their choice. It is the mandatory test with the
required parameters that we run. Note that all of the mandatory tests must be
conducted with random data.
As previously mentioned, a key
principle of SNIA testing is to provide a consistent basis for comparing
different solutions from different manufacturers - myce.com/blog will be in a strong
position to publish meaningful comparisons as we gain more experience in the
review of Enterprise level SSS solutions.
Here is the report of the results -

The second table confirms the Range in the Measurement
Window (the maximum variation of a 4K Round value from the Average of the 4K Round
values) and the slope of the best linear fit through the 4K values (please see
Testing Methodology paper for a detailed specification of the criteria for
determining the achievement of Steady State, click here)

You can see here that Steady State Convergence was
determined at the end of Round 5. The Steady State Convergence Plot provides a
visual confirmation of Steady State Convergence.

This graph shows the average results gathered in the
Measurement Window. You can see an expected drop in IOPS performance as IO size
increases and/or the percentage of Writes increases. You can see that the IO
Size 4K, Read/Write ratio 100/0 (all reads) is hitting Smart’s specification of
100,000 IOPS for 4K random reads.

This is an alternative method for presenting the results
from the Measurement Window; one which personally I prefer. Users can simply
refer to the table to obtain the R/W mix and Block Size value of
interest. For example, Online Transaction Processing applications
typically run at a Block Size of 8K and a Read/Write Mix of 65/35, and users
can quickly understand how the device might perform under Steady State for
these access characteristics. You can see that the 4K, 0/100 (all writes)
value is, in the context of this test, somewhat short of Smart’s specification
of 50K for 4K random writes. We’ll come back to this later.
Now let's head to the next page, where to look at the
results of the SNIA Write Saturation Test.....
SNIA Write Saturation Test
Here is the specification for this test -

The objective of this test is
to observe the time evolution of the drive’s performance, as a function of
time, from a ‘factory fresh’, ‘fresh out of the box’ (‘FOB’) state. When a
drive is in a FOB state (e.g. after it has been purged by, for example by a
SATA Secure Erase or SCSI Format), we can expect an initial period of time when
writes can easily be accommodated by clean/empty blocks, but once all of the clean
blocks have been written to once and the drive’s controller must first clean
blocks (with erase write operations) before it can write new data, then we can
expect a slow down. The slow-down is usually quite dramatic and is commonly
referred to as the ‘write cliff’.
The Write Saturation Test is
easy to run as it requires no steady state determination – it can be easily run
in freely available software, such as IOMeter.
Here is the report of the
results -


You can see here a relatively small drop in Write IOPS
performance as the Optimus settles into a Steady State. The marked fall, at
around Round 45 occurs, I assume, when all of the available NAND has been
written to once and the drive must clean blocks on the fly in preparation for accommodating
further writes – this is commonly referred to as the ‘Write Cliff’ – although
in the case of the Optimus it is more of a ‘gentle bank’ than a cliff.
This is a typical picture of behaviour, and you can see that
the drive is achieving a steady state at around 41,000 IOPS – we’ll look at
IOPS performance again later on.
Note that the test was halted, as specified in the SNIA SSS
PTS, when 4 x the User Capacity had been written to the drive.
It is unusual to see a drive perform so consistently from a
fresh out of the box state through the transition to a steady state.

You can see here the gentle increase in Write latency as the
Optimus settles into a Steady State. You can also see that the latency graph
line is a mirror image of the IOPS graph line.

This is a graph showing the Maximum Write Latency values
that occurred in each Round.
Now let's head to the next page, to look at the SNIA
Throughput Test.....
SNIA Throughput Test
The SNIA recently published a draft of the next version of
the SNIA SSS PTS Enterprise – Version 1.1 and I noticed that an error in the
Throughput Test specification in Version 1.0 has been corrected. The v1.0
Throughput Test is missing a pre-fill stage between the purge and the tests
loop, that sit within the overall loop on Block Size. This means that the
Write Throughput numbers may be overstated if the steady state for sequential
writes is determined before the drive’s NAND has been written to at least once
(which is certainly the case for the Optimus and indeed the Intel DC S3700
200GB SSD that I reviewed recently). So, I am moving to the version 1.1 of the
Throughput Test Specification in this and future reviews.
Here is the specification for the Version 1.1 test -

The test is designed to measure the sequential Read and
Write IO performance for two Block Sizes, when under Steady State conditions.
One can easily compare the results produced by this test with box-top numbers,
which are usually stated as “Up to xxx MB/S”.
Here is the report of the results -


You can see here that Steady State was achieved for both Write
IO sizes by the end of Round 5.

You can see here that Steady State for both Read IO sizes
was achieved by the end of Round 6.


You can see here the average of the values recorded in the
Measurement Window for both single and dual/wide port testing.
The single port results compare well with Smart’s
specification of 500MB/s for both sustained Reads and Writes.
The dual/wide port results don’t hit Smart’s specification
of 1 Gigabyte per second sustained Reads, but note that the test was run with
write cache disabled and this could well account for some of the shortfall, and
also 128K and 1024K may not be the optimal IO size to achieve maximum read
throughput (we’ll come back to this later). For now, I think you’ll agree
though that the dual/wide port results are impressive.
Now let's head to the next page, to look at the results
of the SNIA Latency Test.....
SNIA Latency Test
Here is the specification for this test -

The Latency Test measures average and maximum response times
using random IOs at specified Block Sizes and Read/Write mixes, taken under
steady state conditions. The test runs at a Queue Depth of 1 (1 outstanding
IO), thus the results give the baseline response time for a single IO request.
The test also reports maximum latency values, which can be
helpful to see if there might be processes within the drive that may cause max
Latency values to become larger.
Here is the report of the results -


These are the Average and Maximum Latency Values observed in
the Measurement Window (measured in Milliseconds).

You can see here that Steady State Convergence was achieved
at the end of Round 5 (for a detailed specification of the rules for the
determination of Steady State, please see the Myce Enterprise SSS Testing
Methodology paper).

You can see here a graph of the Average Latency results.

Here is a 3D graph showing, at a glance, the Maximum Latency
values for each combination of Read/Write Mix and IO Size. You can see that
the Max Latency Values are far greater than the following Average values – it
begs the question as to how frequently they occur (we’ll look at this later on
in the Myce/Oakgate Tests).

Here is a 3D graph showing, at a glance, the Average Latency
values for each combination of Read/Write Mix and IO Size.
Now let's head to the next page, to look at the results
for the Myce/OakGate Read and Write Latency Tests......
Myce/OakGate 4K Read and Write Latency Tests
Here are the specifications for the tests -


These tests steadily increase the random 4K IO demand in
terms of IOPS, and report the drives response in terms of Average IOPS, Average
Latency and Maximum Latency. It is designed to show a drive’s maximum IOPS
capability and report the all important Latency numbers for each level of IOPS
demanded. The Maximum latency numbers give us an insight into the occurrence
of Latency peaks that could cause an unexpected response from time to time.
Here are the results –
Please Note - Throughout the presentation of the
Myce/Oakgate Performance Characterisation tests performed on the Optimus we
present the results for single and dual/wide port testing. Generally, the
single port results appear first and the dual/wide port results appear second
(beneath the single port results).
Firstly, here is a graph showing the result for the
Pre-Conditioning in Step 2 -


There are signs that the firmware has been most finely tuned
to sustain a very smooth and consistent performance through to steady state for
single port operation. You can see that the bandwidth for 4K random writes is
not that much greater for dual/wide port operation.
4K Latency Read Test


You can see that the drive can no longer meet the increase
in IOPS demand at 80,000 IOPS and this is the same for single and dual port
operation. In the context of this test the maximum Read IOPS level is falling
short of Smart’s specification of 100K for 4K random reads – we’ll look more
closely at this shortly.


You can see that the average read latency remains below 175 Microseconds
all the way up to 80,000 IOPS for dual port operation and there isn’t any
significant difference for single port operation.


You can see here that for single port testing there are no
relatively massive latency peaks before getting to the 80,000 IOPS level and
for dual port operation there is just one peak at 35,000 IOPS.
Let’s now have a look at the distribution of the latency
values in a test designed to show the Optimus’s QoS (Quality of Service) for 4K
Writes and Reads when in a Steady State. The specification for the test is 1)
Purge the Drive 2) Precondition the drive by performing 4K random writes for 2
hours (100% random data) 3) Perform 60 rounds of 4K Random Writes, with each
round consisting of 9 seconds warm up and 51 seconds of performance measurement
4) Perform 60 rounds of 4K Random Reads, with each round consisting of 9
seconds warm up and 51 seconds of performance measurement. The test was
performed in single port mode at a Queue Depth of 1.
Here are the results:


Firstly, here are Average and Maximum Write Latency plots
per Round

And here is the High Resolution Latency Histogram for Round
33.
As this is the first time in this review, that we are
looking at a High Resolution Latency Histogram, here’s an explanation – The x
axis to the left is the count of the IOs in the observation period (in a Round)
that had a Latency of the value along the Y axis (please note that the x axis
is logarithmic to allow the low order counts of the huge number of IOs that
have been measured to be visible); the y axis is the Latency value measured in
Microseconds; The x axis to the right is the % of the Total IOs observed that
have a Latency <= to a given Latency value; the rate of getting to 100% is
highlighted by the red graph line.
You can see that 99.9% of the Latency Values were <= 120
Microseconds and that there was only one relatively high outlier at 430
Microseconds.


Here are the Average and Maximum Read Latency plots per
Round.

And here is the High Resolution latency Histogram for Round
29. You can see that 99.9% of Latency values were <= 140 Microseconds and
100% were <= 150 Microseconds.
All in all the Optimus has a remarkably consistent and
excellent level of Latency (Response Times).
A quick aside here – when I first started my testing of the
Optimus I found the following picture of Max Read Latencies in the 4K Read
Latency Test –

I reported the findings to Smart. Smart’s response was very
professional; they took what I had found seriously. Randy Cohen, Smart’s VP
for Firmware Engineering and Product Assurance became personally involved and directed
a member of his firmware team to look into what was happening.
It helped that I could send copies of my OakGate test
scripts as Smart also uses an OakGate test unit.
They soon realised that the latency spike was occurring in a
regular frequency and they also captured a Latency spike on a SerialTek SAS bus
analyser. They noticed a 2-3 millisecond gap in activity. Within a few weeks
the problem had been fixed by Oakgate’s firmware team and I was able to retest
with the K312 firmware (and as you can see from the K312 test results above –
the spikes have been removed or at least diluted to the point that they are
insignificant).
With great magnanimity (a quality I have seen many times in
‘Captains of Industry’, through my career in IT), Randy also stated that they
were looking into how this had been missed in their original testing.
Personally, I take Smart’s response as testament of their
commitment to success and attention to detail – I feel they have a great team
and I wont be at all surprised if they continue to go from success to success
in a very competitive market. I take this opportunity to thank all of the
excellent Smart personnel, who I corresponded with during my testing, for their
support (and patience when it came to testing K312, as I initially had a problem
caused at my end, which they were kind enough to diagnose for me).
4K Latency Write Test


Here you can see that the drive can no longer meet the
increase in IOPS demand at around 42,500 and there is little difference between
single and dual port modes. In the context of this test the maximum Write IOPS
level is falling short of Smart’s specification of 50K for 4K random writes.


Here we can see that in single port mode the average latency
remains at 50 Microseconds until just over 20,000 IOPS and then climbs
reasonably gradually to 750 Microseconds at 42,500 IOPS. The dual port plot is
similar.


Here are the Maximum Write Latency Plots.
So, let’s now have a look at the maximum IOPS levels for 4K
Random Writes and 4K Random Reads. To find the optimum queue depth for Writes
and Reads I played with our Oakgate Test Unit’s IO Exerciser. It turned out
that for dual port operation the optimum Writes Queue Depth is 32 (per port)
and for Reads 64 (per port). I then conducted a test as follows - 1) Purge the
Drive, 2) Precondition the drive with 4K Random Writes for 2 hours, 3) Perform
4K Random Writes for 60 Rounds, where each Round consisted of 9 seconds warm up
and 51 seconds of performance measurement, 4) Perform 4K Random Reads for 60
Rounds where each Round consisted of 9 seconds warm up and 51 seconds of
performance measurement. The test was performed with fully random data and in
single port mode.
Here are the results –


You can see that the level of Read IOPS is 100,000, which
hits right on Smart’s specification.
However, even with what I found to be the optimal single
port queue depth the 4K Random Write IOPS is at 42,500, which falls short of
Smart’s specification of 50,000.
Now, Smart notes that the IOPS performance numbers were
produced with IOmeter 2008 and it could well be that they were run in a more
sympathetic Windows environment, perhaps with a driver that supports greater
levels of write caching. I am inclined to believe this is the case, as for all
other performance numbers Smart has understated and the Optimus has over
performed.
Now let's head to the next page, to look at the results
for the Myce/Oakgate Reads and Writes Tests.....
Myce/OakGate Reads and Writes Tests
Here is the specification of the tests -

The tests are designed to show the Random and Sequential,
Read and Write, performance metrics for different combinations of Queue Depth
and IO size.
Here are the results -
Random Reads


You can see here that for both single and dual port modes Read
IOPS does not scale much beyond a queue depth of 64.


You can see here that bandwidth doesn’t scale beyond a queue
depth of 32/64 and Bandwidth actually falls for larger IO Sizes at a queue
depth of 128. You can also see that Read Bandwidth is significantly greater in
dual port mode, especially for larger IO Sizes. We can conclude that whilst
dual/wide port mode does not significantly increase IOPS it does increase
Random Read Throughput/Bandwidth significantly.


You can see here that Read Latency increases as queue depth
increases and that there is little or no difference between single and dual
port modes.
Random Writes


You can also see that the level of Random Writes IOPS peaks
at an IO Size of 4K. You can also see that there is little or no difference in
Random Writes IOPS between single and dual port modes.


You can see that for Random Writes there is little
difference in Bandwidth between single and dual port modes.


There is also
little or no difference in Random Writes Latency between single and dual port
modes.
Sequential Reads


You can see there is little or no difference in Sequential
Reads IOPS between single and dual port modes.


You can see here that there is no effective scaling in Sequential
Read Bandwidth beyond a queue depth of 64. You can also see that there is a
significant increase in Bandwidth in dual port mode, especially for larger IO
Sizes.


You can see there is little or no difference in sequential
Read Latency between single and dual port modes.
Remember back in the SNIA Throughput Test I said we’d take a
look to see if we can hit Smart’s specification of 1 Gigabyte per second for Sustained
Read Speed in Dual/Wide Port mode. Well, I played around with different IO
Sizes for pre-filling the drive and for the subsequent sequential reads. I
soon found that a combination of pre-filling with 512K sequential writes,
followed by 512K sequential reads achieved the following result, at a queue
depth of 32 per port (by the way this is with fully random data) –

You can see this combination gave a sustained sequential read
speed average of 1083 MB/s, convincingly above 1 GB/s (1024 MB/s). This is quite
a lot faster than is claimed by the initial single port 12 Gbits/s SAS drives, such
as the Toshiba PX02SM which hits 900MB/s. Stunning performance and the first
time I have seen a single drive shift data at over 1 GB/s - Cool.
Sequential Writes


You can see here that there is no effective scaling for
Sequential Writes IOPS above a queue depth of 32 and indeed there is a decrease
at a queue depth of 128. You can also see that there is a significant
improvement in Sequential Write IOPS in dual port mode.


You can see here that there is no effective scaling for
Sequential Writes bandwidth above a queue depth of 64. You can also see that
there is a significant increase in Sequential Write Bandwidth in dual port mode,
particularly for the larger IO Sizes. Notice also that there is a curious dip
in Bandwidth for an IO Size of 16K.


You can see here that there is little difference in
Sequential Writes latency in single and dual port modes.
Now let's head to the next page, to look at the results
for the Myce/Oakgate 4K Mixed Reads/Writes Tests.....
Myce/OakGate 4K Mixed Reads/Writes Tests

This test is designed to show the performance metrics for
different combinations of Queue Depth and Read/Write mix (the % of Reads and
the % of Writes making up the IO traffic)
4K Mixed R/W Test


As would be expected, there is a gradual decrease in Read
IOPS as the percentage of Writes increases. There is no dramatic fall off when
a small percentage of writing commences.


As would be expected there is a gradual increase in Write
IOPS as the percentage of Writes increases.


As would be expected, the total IOPS is at its greatest when
there is little or no Write activity. You can see some improvements in IOPS
performance in dual port mode for the smaller IO Sizes at a Write % of 100%.


As would be expected, there is a gradual decrease in Read
bandwidth as the percentage of Writes increases.


As would be expected, there is a gradual increase in Write
bandwidth as the percentage of writes increases.


As would be expected, the total bandwidth is at its greatest
when there is little or no write activity. As we have noted before, for random
IOs, there is little or no difference in bandwidth between single and dual port
modes.


As would be expected, there is a gradual decrease in Read
Latency as the percentage of Writes increases.


As would be expected, there is a gradual increase in Write
latency as the percentage of writes increases.


You can see there is little or no difference between single
and dual port modes.
Now let's head to the next page, to look at the results
of the Myce/OakGate Entropy Tests.....
Myce/OakGate Entropy Tests

These tests are designed to show performance metrics for
different combinations of Queue Depth and Entropy % (Entropy % is the
percentage of the data that is random). Testing with different Entropy % levels
has become important with the advent of controllers, such as those from LSI
Sandforce, that compress data before writing it to NAND. Controllers that
compress data can be expected to perform better with highly compressible data
(i.e. data with low Entropy).
The first test performs 5 minutes of Random 4K writes for
each combination of Queue Depth and Entropy %.
The second test does the same thing for a mixture of Read
and Write traffic (70% Reads, 30% Writes).
4K Entropy Write Test


Well there is no evidence that the Smart controller in the
Optimus is compressing data (and this comment applies to all of the results in
the 4K Entropy test). You can though observe some improvements in IOPS and
Bandwidth performance in dual port mode, particularly for the smaller IO Sizes.


4K Entropy 70%_Reads_30%_Writes Test


It’s interesting to observe that there appears to be some
variation in performance level for differing Entropy % levels (and the same
pattern of variations for single and dual port is repeated in all the results
presented for this test). However, the variations are not linear and there is
no decrease in performance as Entropy % increases. I must say that I don’t know
what causes this variation, especially as the previous test showed no
meaningful variances at all for differing levels of Entropy % in 4K Random
Writes.


Now let's head to the next page, to look at Power
Consumption and Data Reliability.....
Power Consumption and Data Reliability
Power Consumption
I believe most people know that data centres are already one
of the major consumers of electricity in the industrialised world; indeed it is
estimated that currently 2% of all electricity consumption goes into IT
applications. According to the European Union the energy consumption of data
centres was 46 Terawatt hours in 2006 and is set to rise to 93 TWhrs by 2020. This
is equivalent to one hundred million 100W light bulbs burning 24 hours a day,
365 days a year.
Typically 40% of the power consumed by data centres is for
the IT load and 35% is for cooling the system. Generally speaking, if a drive
consumes more power it will produce more heat – so power consumption is indeed
a double edged sword. It is no surprise then that a significant proportion of
a data centre’s power consumption goes on servers. I understand cloud based
applications, such as Facebook, are the primary cause of the growth in servers
and the demand for storage space.
I recently listened to a BBC Radio 4 Programme that quoted
IBM as saying that 90% of the world’s data has been created in the last 2 years
– staggering!
I’ve heard that Google has more than 1 million servers and
that Microsoft has more than 300,000 in its Chicago based data centre alone –
fortunately for humanity the very large players are also amongst the most
efficient (understandable, as the economics associated with power consumption
are huge for them). So suffice to say, the power consumption of SSS Enterprise
solutions is a very important global consideration.
The following graph uses the typical Power Consumption, when
active, as published in the respective manufacturer’s specification. (please
note that the value for the Samsung 843 is the average of the typical read
active and write active values, as specified by Samsung)

The Optimus can be regarded as good for an SAS drive; generally
speaking SAS SSDs consume more power than SATA SSDs.
Data Reliability
UBER –(as defined by JEDEC, the global leader in developing
open standards for the microelectronic industry) is a metric for data
corruption rate equal to the number of data errors per bit read after applying
any specified error correction method. It stands for ‘Unrecoverable Bit Error
Rate’. JEDEC specifies that an Enterprise level SSS solution must have a value
>= 1 x 10¹⁶.

The Optimus exceeds the JEDEC requirement and has a
competitive UBER of 1 x 10¹⁷.
Endurance is warranted at 10 Drive Writes per Day (DWPD) for
5 years.
The Guardian technology (which we looked at earlier), plus
the inherent failure protection options available to SAS drives, place the
Optimus in the top tier when it comes to data reliability and data security
features.
Now let's head to the next page, to look at the
Conclusions of this review.....
Conclusions
The Smart Optimus is an outstanding Enterprise SSD.
It offers a truly phenomenal balance of performance together
with endurance, data reliability, and data integrity features.
I believe Smart has good reason to hold up the Optimus as
the fastest SAS SSD in town. Dual/wide port Sequential Read Throughput of
greater than 1 Gigabyte per second is certainly a ‘wow’ factor. What’s more,
the performance character is smooth and dependable - very impressive.
I do not have detailed pricing data for the Optimus but I
understand it is priced competitively with other premium MLC based Enterprise
options… and with the Optimus providing both performance and endurance to match
SLC based solutions it comes as no surprise to me that it has been very
successful in its primary target market of OEMs.
Myce thanks Smart Storage Systems for supplying a sample for
review.
It is easy for me to award the Optimus our top rating of Outstanding
and name it as the current Editor’s Choice from amongst SAS based Enterprise
solutions.
Final Words – I feel the Optimus is a role model for what an
Enterprise SSD should be.


")


