 |
Review: Toshiba MQ01ABD100H & MQ01ABF050H Solid |
Introduction
Welcome to Myce’s review of the Toshiba MQ01ABD100H 1000GB Solid
State Hybrid Drive (‘SSHD’) and the very latest generation, MQ01ABF050H 500GB SSHD,
both of which have only recently become available for review by European
Reviewers.
At the heart of the SSHD value proposition is the idea of
marrying the low cost per Gigabyte of a traditional rotating magnetic disk
(HDD) with the speed of NAND Flash Memory to deliver an SSD type user
experience. The key to success is a caching algorithm that intelligently
places a specific user’s most frequently accessed data in NAND memory so that a
higher proportion of data access is performed at SSD like speeds.
Both SSHDs have 8Gb of 32nm SLC NAND memory. So the
opportunity for storing data on NAND is limited, and the algorithm is going to
have to be very clever in the way it learns about a specific user’s most
frequently accessed data.
The other opportunity for an SSHD is to write to the NAND
and defer the writing of data to the magnetic disk, thereby improving the user
experience in writing as well as reading data.
Market Positioning and Specification
Market Positioning
This is how Toshiba positions the MQ01ABDxxxH Hybrid drives -
Toshiba’s first generation of 2.5-inch (6.4 cm) hybrid
drives provide fast SSD-like performance combined with the high capacity of a
hard disk drive (HDD). The new MQ01ABDxxxH series is available in 1TB and 750GB
capacity points. This combined with 8GB of NAND flash make it ideal for high
performance gaming notebooks and PCs. Its lightweight design makes it ideal for
ultra-portable computing devices.
Toshiba’s hybrid drives utilize self-learning algorithms
that enable the drive to identify the user’s access patterns, allowing
frequently used data to be stored in the NAND cache making it quickly
accessible to the host. Likewise, data that is used less often is moved from
the NAND flash to the HDD for long term storage. This self-learning mechanism
continues to develop throughout the lifespan of the drive, constantly improving
the drive’s performance.
Toshiba is the only storage vendor that designs and
develops both HDD and NAND flash technology, the core components of hybrid
drive technology ensuring the highest quality and innovation.
Specification
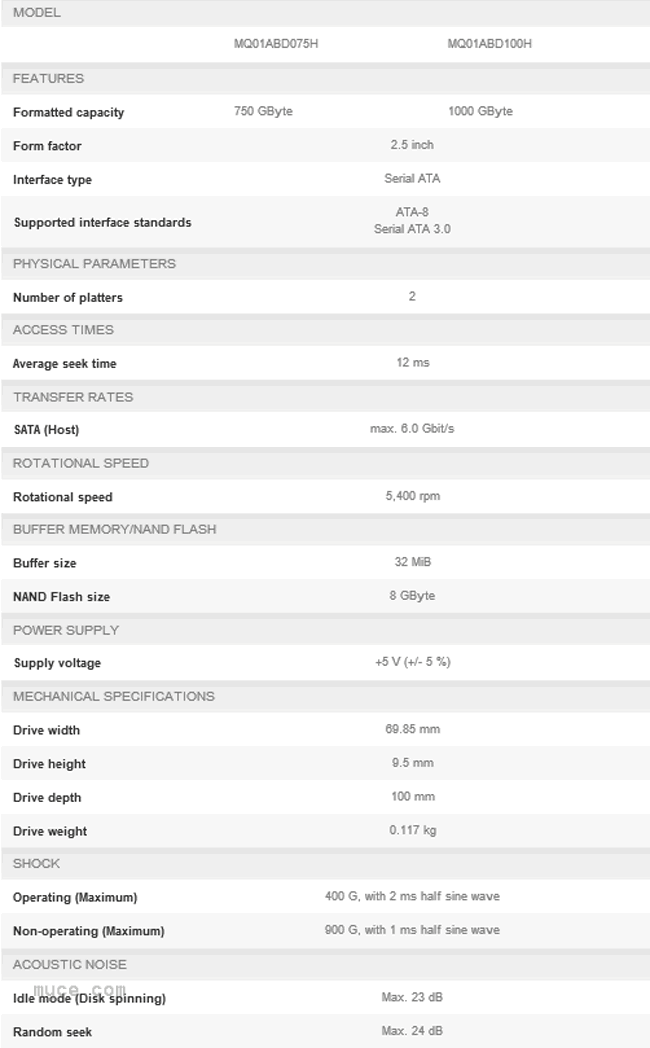
Here is the specification for the MQ01ABDxxxH series of
drives, which is available in 750GB and 1,000GB capacities -
and here is the specification for the MQ01ABFxxxH series,
which is available in 320GB and 500GB capacities –
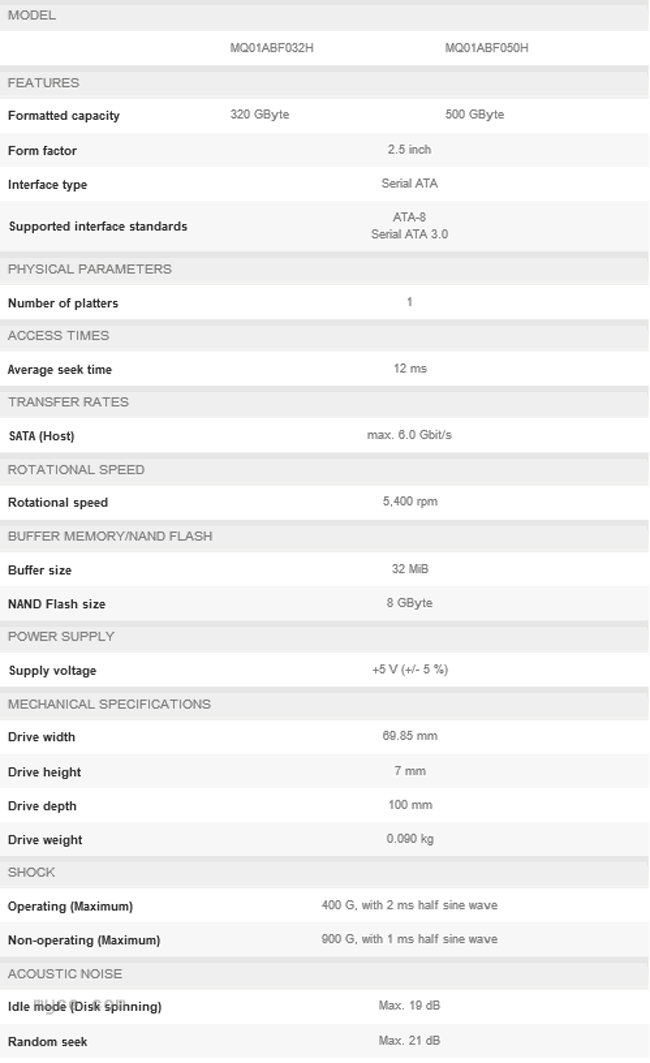
You can see that the specifications are nigh on identical.
The big difference is that the MQ01ABFxxxH series is a very slim 7mm thick, which
is suitable for deployment in the latest slimline laptops/ultrabooks.
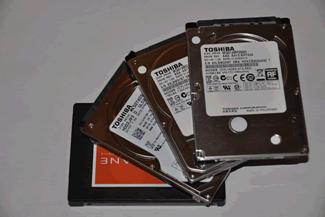
Product Images
Here are some pictures of the SSHDs that I tested –
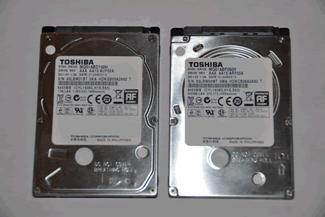
The MQ01ABD100H 1,000GB SSHD is to the left and the
MQ01ABF050H 500GB SSHD is to the right.
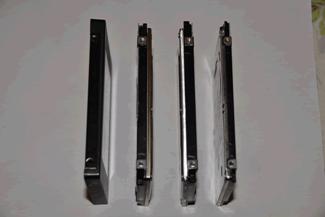
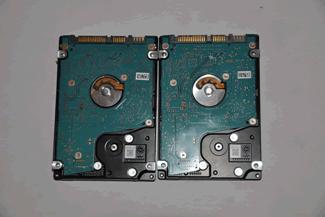
Here are pictures of all the drives tested in this review.
On the far right you can see how slim the MQ01ABF050H is.
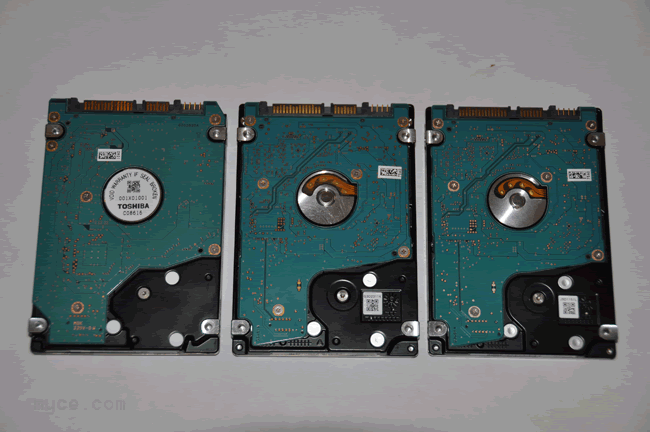
For interest here is a picture of the two hybrid drives
together with a classic Toshiba MK5076GSX magnetic spinning drive (to the
left). You can see the all the drives are very similar to look at and there is
little or nothing to give away the true nature of the hybrid drives.
Now let's head to the next page, to look at the Testing
Approach.....
The test platforms used were:
- Dell XPS 17 Laptop (L702x, Core i7-2670QM, 8GB RAM).
- An OakGate Testing Unit (for an overview, please click
here – OakGate
Test Unit)
An OCZ Octane 128GB SSD was tested to provide a
typical/average reference point to an SSD (hereafter referred to as the ‘SSD’).
A Toshiba MK5076GSX 500GB 5400RPM HDD was tested to provide
a typical reference point to an HDD (hereafter referred to as the ‘HDD’).
The approach we adopted is:
Testing the Self-Learning Algorithm
To test the effectiveness of the self-learning algorithm we
focused on the use of two benchmarks:
- BootRacer – to record boot times
- PCMark Vantage, HDD Suite – to test the drives’
performance in running a set of typical consumer applications (i.e.
running - Windows Defender, gaming, importing pictures, start up, video
editing, Windows Media Centre, adding music to Windows Media Player, and
application loading). It is an excellent way to benchmark HDD performance
for ‘real world’ applications.
The procedure followed was –
For the SSHDs:
- A fresh install of Windows 8 Pro 64bit
- Then boot repeatedly to see if the self-learning algorithm
learns how to produce faster boot times - Then run PC Mark Vantage, HDD Suite repeatedly to see if
the self-learning algorithm learns how to accommodate the faster
processing of the test applications - Then Reboot and rerun PCMark Vantage, and HDD Suite
alternately, to see if the self-learning algorithm can learn to facilitate
both fast boot times, followed by running PCMark Vantage and HDD Suite - Run a couple of other typical consumer benchmarks – AS SSD
and ATTO.
For the SSD and HDD:
- A fresh install of Windows 8 Pro
- Record boot time and PC Mark Vantage, HDD Suite score
- Run a couple of other typical consumer benchmarks – AS SSD
and ATTO.
Write Testing
In the Write tests we are seeking to see if the SSHDs boost
the performance when writing data.
Myce’s OakGate Test Unit which is normally reserved for
testing Enterprise Solid State Storage solutions was used for the two Write
Tests.
- Random Writes
The test drives were bombarded
with 4K Random Writes, at a Queue Depth of 1, to the full range of the drive’s
capacity for 30 minutes. This is a very challenging test and is probably the
worst case scenario for testing the presence and effectiveness of write
caching. For the SSHDs, the same test was then run for 10 minutes across an IO
Range of 1GB of the drive’s capacity (to see if we could force the drive to
stay within its capability to cache writes to NAND storage).
- Sequential Writes
The test drives were bombarded
with 512K Sequential Writes, at a Queue Depth of 1, to the full range of the
drive’s capacity for 30 minutes. This is again a challenging test but it I feel
it probably maximises the opportunity to test for the presence and
effectiveness of write caching. For the SSHDs, the same test was then run for 10
minutes across an IO Range of 1GB of the drive’s capacity.
The results for the SSHDs, the SSD, and the HDD are
presented for comparative purposes.
Now let's head to the next page, to look at the results
of Testing the Self-Learning Algorithm.....
Here are the results of the Boot Time Testing:

You can see that the boot times for the SSHDs become
significantly faster as the SSHDs ‘learn’ how to boot (one should note that
Windows 8 booted twice during installation so it is probable that the
self-learning algorithm learnt to boot faster before we began recording the
results). In Round 7, for comparison we include the boot times for the HDD and
SSD. It is interesting to note that the SSHDs can boot faster than the test
SSD – Impressive!
Here are the results of the PCMark Vantage, HHD Suite,
Testing –

You can see that the scores gradually increase as the SSHDs
learn how to support the faster running of the PCMark Vantage, HDD benchmark.
For comparison we include the scores for the HDD and SSD in Round 7. Again,
impressive!
At this stage I wondered if the SSHDs would have forgotten
how to boot quickly.
So I recorded the boot times for three successive reboots.
I then alternately rebooted and ran PCMark Vantage, to see
if the SSHDs could learn how to support faster booting and the faster running
of the benchmark.
These were the results-

You can see that the SSHDs did momentarily forget how to
boot quickly.

Following the 4th reboot we ran the PCMark
Vantage, HDD Suite before rebooting. It is clear that the SSHDs had not
forgotten how to run the benchmark more quickly.
So it is possible to teach the drive to support both
objectives, even if the fastest boot time is compromised marginally. Again,
impressive!
AS SSD


Here are the results for the test HDD and test SSD.


Here are the results for the MQ01ABD100H 1,000 GB SSHD and
MQ01ABF050H 500GB SSHD respectively. It is very interesting to see that the 4K
and 4K 64 threads results are significantly better than for the test HDD – I
think this must be a sign of some read and write caching to NAND storage
happening within a run of AS SSD. Running AS SSD repeatedly sees no
improvement in scores (as its test files do not persist from one run to the
next).
ATTO


Here are the results for the test HDD and test SSD.


Here are the results for the MQ01ABD100H and MQ01ABF050H.
Running ATTO repeatedly makes no difference to the ATTO results (as its test
files do not persist from one run to the next).
Now let's head to the next page, to look at the results
of our Write Tests.....
Random Writes Tests
Here are the results -

Firstly, here are the results for the Test HDD. The average
Write Bandwidth (Throughput) is 0.51 MB/s, and the results are typically slow
and erratic.

Secondly, here are the results for the Test SSD. You can
see the typical picture for an SSD as it passes over the ‘Write Cliff’ on its
way to a Steady State (a sudden drop occurs when all NAND has been written to
once, so that blocks must be cleaned on the fly to accommodate further
writes). You can see that the Bandwidth is significantly higher than that for
the Test HDD even after falling over the ‘Write Cliff’. Note that for good and
repeatable measurement the SSD was secure erased at the start of the test.
Here are the results for the SSHDs -

Firstly, the MQ01ABD100H 1000GB SSHD.

Secondly, the MQ01ABF050H 500GB SSHD.
Some observations –
- The results are slower than that for the Test HDD, however
the outcome is less erratic (results are all in a tighter distribution of
Bandwidth). - I am not sure that there is any evidence of write caching
going on to be seen here. It could be that the SSHDs are attempting to
cache the writes but nothing is being gained. Possibly because the writes
are positioning data totally randomly over the whole of the disk, so perhaps
no effective write deferrals can be made, and indeed the attempts at
caching may be just an overhead, which might explain why the Test HDD is
faster in this test. - It is worth noting that this test is not at all
representative of consumer workloads and it is most probably a worst case
scenario for testing the effectiveness of caching to NAND storage and
deferring writes to the spinning magnetic disk. - It is interesting to observe that the MQ01ABF050H shows a
tighter result up until 1,150 seconds. By this time it would have written
approximately 1,150 x 0.17 MB = approx. 195.5 MB. Perhaps this is
something to do with the maximum amount of NAND storage available for NAND
caching of writes.
For interest we now present the distribution of the Latency results
for the Random Writes Tests -

For the Test HDD. As this is the first time in this review,
that we are looking at a High Resolution Latency Histogram, here’s an
explanation – The X axis to the left is the count of the IOs in the observation
period (in a Round) that had a Latency of the value along the Y axis (please
note that the X axis is logarithmic to allow the low order counts of the huge
number of IOs that have been measured to be visible); the Y axis is the Latency
value measured in Microseconds; The X axis to the right is the % of the Total
IOs observed that have a Latency <= to a given Latency value; the rate of
getting to 100% is highlighted by the red graph line.

For the Test SSD

For the MQ01ABD100H 1,000GB SSHD.

For the MQ01ABF050H 500GB SSHD.
Sequential Writes Tests
Here are the results for the sequential Writes Tests -

Firstly, for the Test HDD

Secondly, for the Test SSD. You can see here that the OCZ
Octane is able to sustain a Bandwidth of approximately 200 MB/s (note that the
SSD was secure erased at the beginning of the test).

Thirdly, for the MQ01ABD100H 1,000GB SSHD. I feel there is possible
evidence of a positive write caching effect here. For the first 40 or so
seconds the drive writes more slowly (at around 85 MB/s) and then jumps up to a
faster speed (of around 115 MB/s) – this could be happening when it realises
the potential for caching the sequential writes to NAND storage. I wonder also
if the regular downward spikes are associated with the data already written to
the NAND storage being subsequently transferred to the magnetic disk (thereby
allowing more data to be cached to NAND storage). Let’s zoom in on the graph
line –

It sounded like a good theory, but unfortunately, the
downward spikes are too far apart (around 100 seconds) and the amount of data
being written in this period exceeds the amount of available NAND.
[100 x approx. 114 MB/s = approx. 11,400 MB written between the
downward peaks, which equals approximately 11 GB]. I asked Toshiba if they had
an explanation; but in their testing, using H2BenchW they could not see
evidence of the downward spikes, as follows –

I suspect the in-house Toshiba test bench is not as accurate
as the OakGate Test Unit – so, the downward spikes remain a mystery.

Fourthly, for the Toshiba MQ01ABF050H 500GB SSHD.
Here we can see some erratic behaviour, followed by a dip, then
by more consistent behaviour with regular downward spikes (similar to the
MQ01ABD100H) - perhaps this is evidence of the MQ01ABF050H having a modified
algorithm.
It is interesting to note that both SSHDs write,
sequentially, significantly faster than the test HDD.
For interest we present the distribution of Latency results
for the Sequential Writes Tests -

For the Test HDD.

For the Test SSD.

For the Toshiba MQ01ABD100H 1,000GB SSHD.

For the Toshiba MQ01ABF050H 500GB SSHD.
Now let's head to the next page, to look at the results
of our Write Tests when the IO Range is restricted to 1GB of the SSHDs’ capacity.....
The previous random and sequential write tests were then
rerun (for a duration of 10 minutes) but restricted to an IO range of 1GB, to
see if this would allow the drive to stay within it’s capability to cache
writes. Here are the results –
Random Writes

Firstly, for the Toshiba MQ01ABD100H, 1,000GB SSHD. This is
interesting as we can see that the Bandwidth has increased during the test to
over 4MB/s, which is significantly faster than for the unrestricted IO Range
test. It looks as if there is some clear evidence of write caching here.

Secondly, for the Toshiba MQ01ABF050H 500GB SSHD. This is
less exciting, but the result is still faster than that for the unrestricted IO
Range. It is curious to see such a difference between the SSHDs in this test.
Sequential Writes

Firstly, for the Toshiba MQ01ABD100H 1,000GB SSHD.
Curiously, the result is slightly less than that for the unrestricted IO Range,
but we have lost the regular downward spikes.

Fourthly, for the Toshiba MQ01ABF050H 500GB SSHD. Again,
the result is slightly less than that for the unrestricted IO Range, but as
with the Toshiba MQ01ABD100H 1,000GB SSHD we have lost the regular downward
spikes.
Now let's head to the next page, to look at the
Conclusions.....
I was impressed by the effectiveness of Toshiba’s
Self-Learning Algorithm and the test results were convincing.
Our Write Testing, which looked for evidence of write
caching to NAND Storage, was less conclusive; but this could be as I do not
know how the write caching works. Certainly, write caching takes place, but
exactly how and when was not uncovered by my testing.
There is no doubt that a good SSD will outperform an SSHD
Hybrid Drive. The debate will no doubt focus on the reduction in price per
gigabyte and the need for a user to have a greater capacity than can be
afforded by an SSD. Toshiba informs me that their MSRP for the MQ01ABD100H
1000 GB drive is 135 USD. If the ‘On the Streets Price’ meets the MSRP as
stock hits the channels, then I feel this is a strong value proposition.
It seems to me that the biggest target market for SSHDs will
be laptops and notebooks, which have just one drive bay meaning that there is
no opportunity to have both an SSD as a system drive, and a large spinning
magnetic disk as a storage drive.
I am pleased to award our rating of 'Excellent' and name the
Toshiba MQ01ABD100H as the current 'Editor’s Choice' from amongst consumer SSHD
solutions.
Myce has also produced a video to demonstrate how an SSHD
can transform an old sluggish PC and if you'd like to see this please click here.


Thanks to:
Alex
Schepeljanski for AS SSD Benchmark.
FutureMark for providing
a professional license for PC Mark Vantage.


")


