|
|
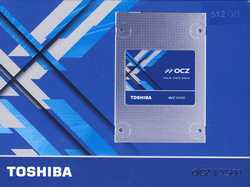
Review: Toshiba OCZ VX500 512GB SSD Reviewed by: Wendy Robertson Provided by: OCZ Model: VX500-25SAT3-512G Firmware version: 1.1 |
The Toshiba OCZ VX500 is aimed at the mainstream segment of
the consumer SSD market, and is the successor the popular OCZ Vector 180 range
of SSDs. The Toshiba OCZ VX500 is powered by a Toshiba TC358790 SSD
controller, and is coupled to Toshiba 15nm MLC NAND.
As stated above, the VX500 is targeted at the mainstream
segment of the market, and is aimed at mid-ranged PCs, and laptops, where
performance and endurance are key.
The Toshiba OCZ VX500 is available in capacities of 128GB,
256GB, 512GB, and 1TB. The version I am looking at today is the 512GB version.
Toshiba OCZ company information
Those of you that would like to find out more about Toshiba OCZ,
can do so at their website.
The Toshiba OCZ VX500 SSD
Now it’s time to take a look at the drive itself and its
retail package..
Being a mainstream SSD, you get a bare drive, installation
manual, and a serial key for Acronis True Image HD backup and cloning software.
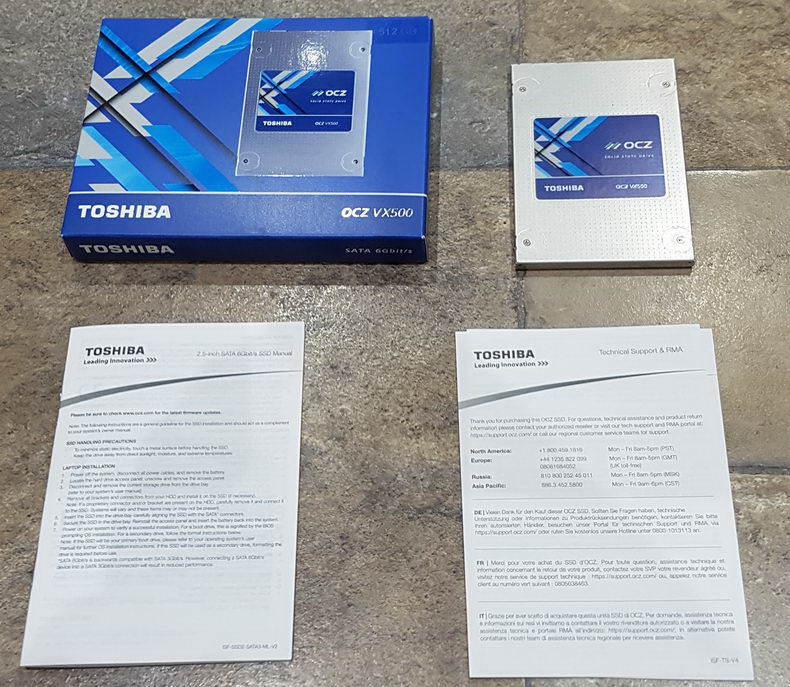
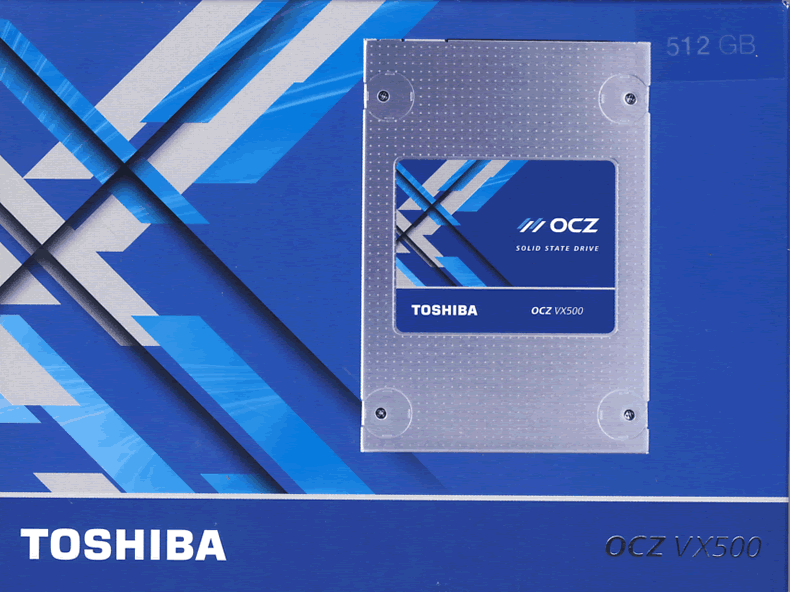
Box top
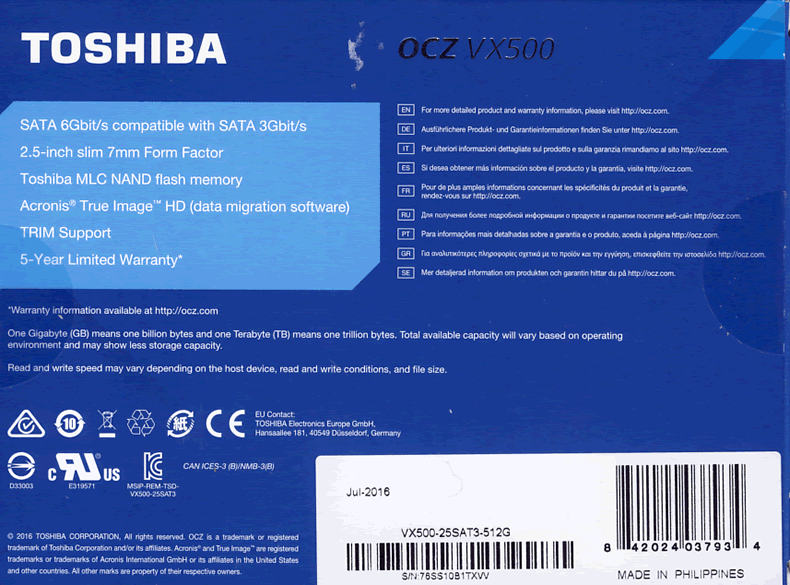
Box bottom
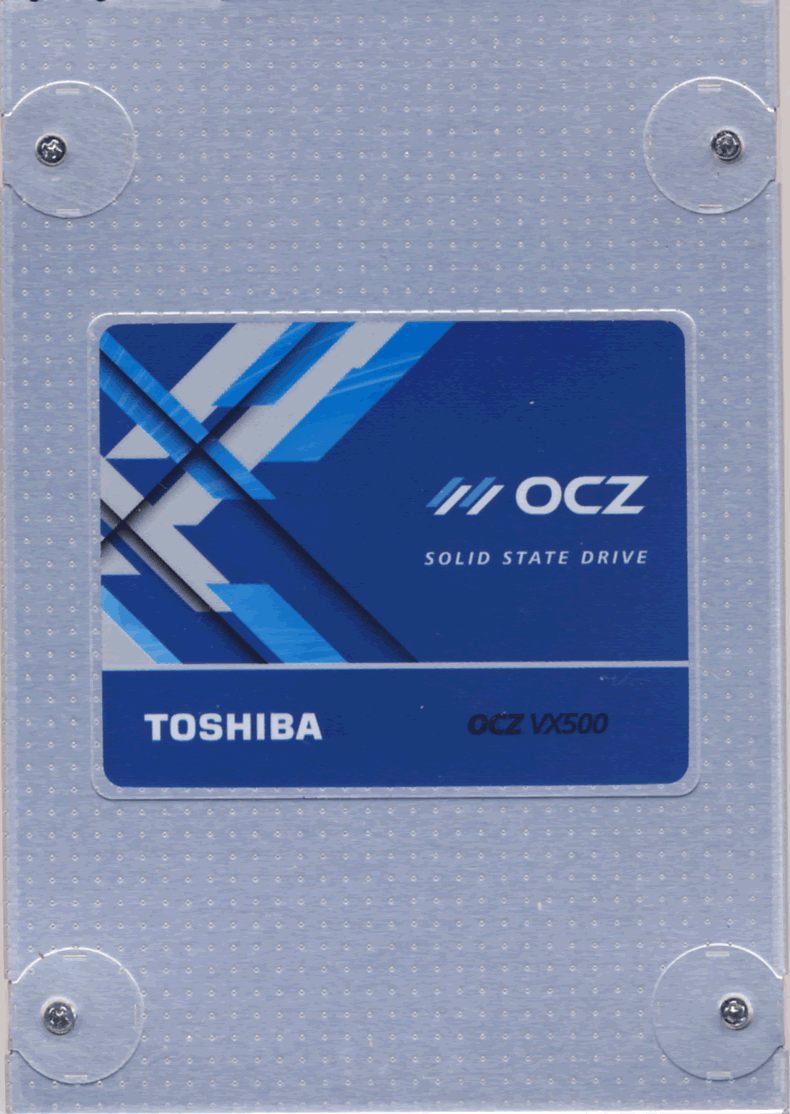
Drive top
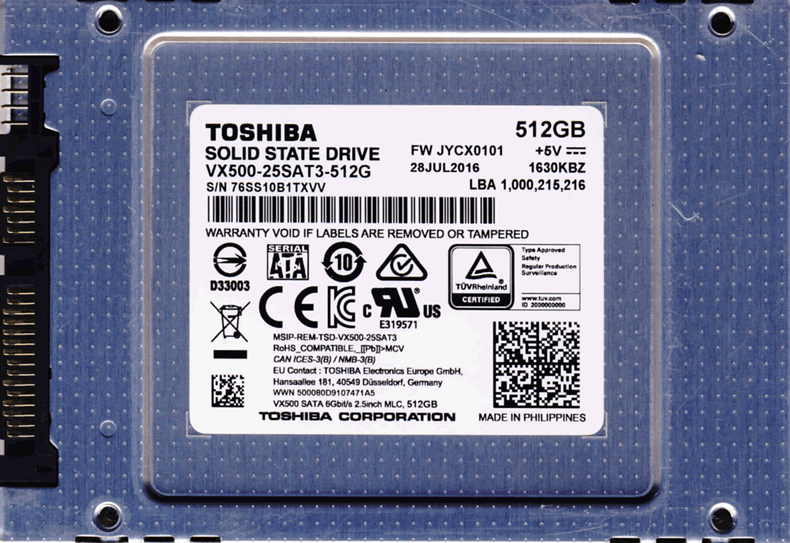
Drive bottom
The casing of the Toshiba OCZ VX500 is an all metal affair.
The drive is fairly lightweight, but solidly built.
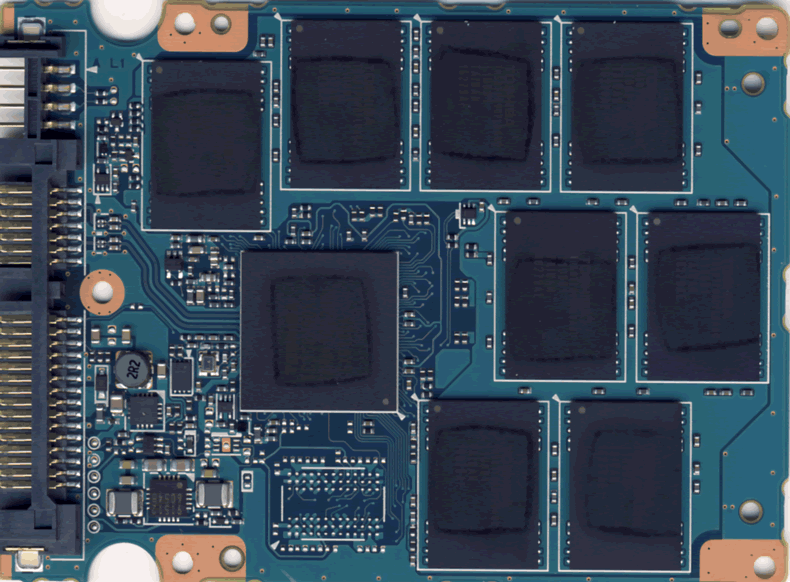
PCB
The PCB houses the Toshiba TC358790 SSD controller, eight
Toshiba 15nm MLC NAND chip packages, LPDDR3 cache on the 1TB model, the lower capacity models have no external DRAM, as this is not required, and we can also see various support
components. There are thermal transfer pads on the SSD controller and NAND to
transfer heat from these components to the outside world.
Drive maintenance features
For Windows 7, Windows 8, and Windows 10 users, and some
distributions of Linux, the Toshiba OCZ VX500 SSD supports TRIM to keep the
NAND clean. The Toshiba OCZ VX500 also has advanced garbage collection to clean
the NAND during drive idle periods.
Toshiba OCZ SSD Utility
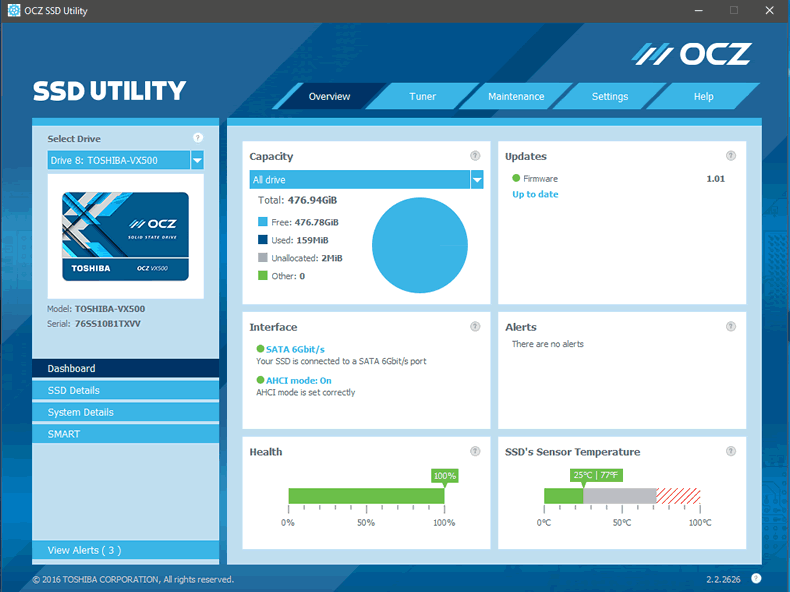
Toshiba OCZ SSD
Utility
The SSD utility software allows the user to maintain the
SSD, and has the following features.
Overview tab
- Dashboard: Brings up useful information about the
SSD, including its health status and how much data has been written to the
SSD. It also displays how the SSD is connected, the firmware and if any
updated firmware is available. There is also a
handy temperature meter. - SSD details: Brings up more details about the SSD,
including its hardware ID string. - System details: Allows the user to see a mass of
information about the PC that the VX500 is connected to. - SMART: Displays the S.M.A.R.T. information for the VX500.
Tuner tab
- Benchmark: Performs a very basic benchmark on the
SSD. - SSD Tuner: Allows you to manually ‘over-provision’
the VX500. In other words, set aside an amount of NAND for the exclusive
use of the SSD controller. Using this feature will reduce the amount of
user storage. - OS Tuner: Allows operating system features that can
affect SSD performance, to be switched on or off.
Maintenance tab
- Updates: Allows the Toshiba OCZ VX500 firmware to
be updated. - Tools: Allows the SSD to be 'secure erased',
clearing all NAND and returning the SSD back to its default factory state. - Alerts: Displays any pending problem with the SSD,
or the system that it’s connected to. - Bootable SSD Utility: Allows the user to make a
bootable USB version of the SSD utility.
Settings tab
The settings tab allows the user to change various settings
in the OCZ SSD Utility. For example, if the monitoring part of the utility
should run in the background on closing the application, or if the OCZ SSD
Utility should be run automatically at Windows start up.
Help tab
The help tab creates a system report which can be saved as a
file, ready to be sent to Toshiba OCZ, should the user require technical
support from Toshiba OCZ.
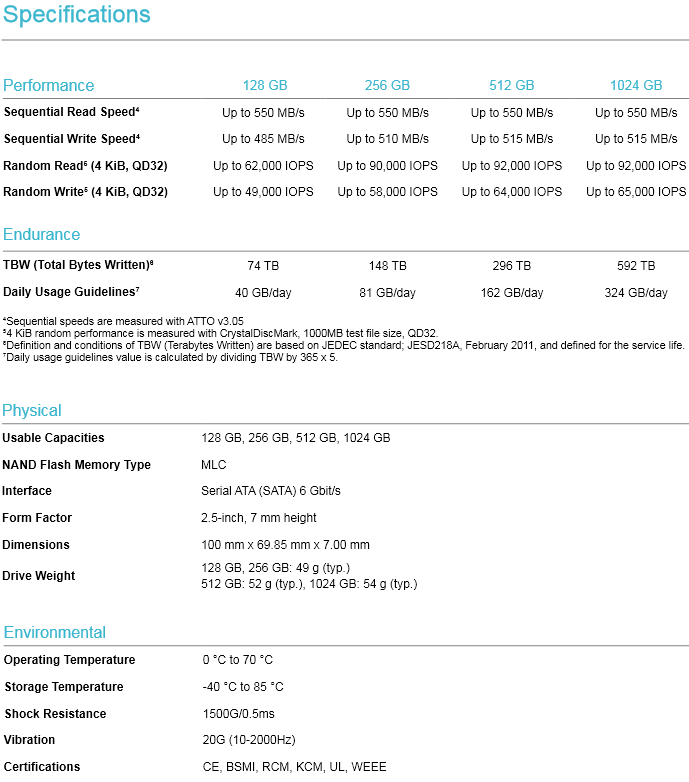
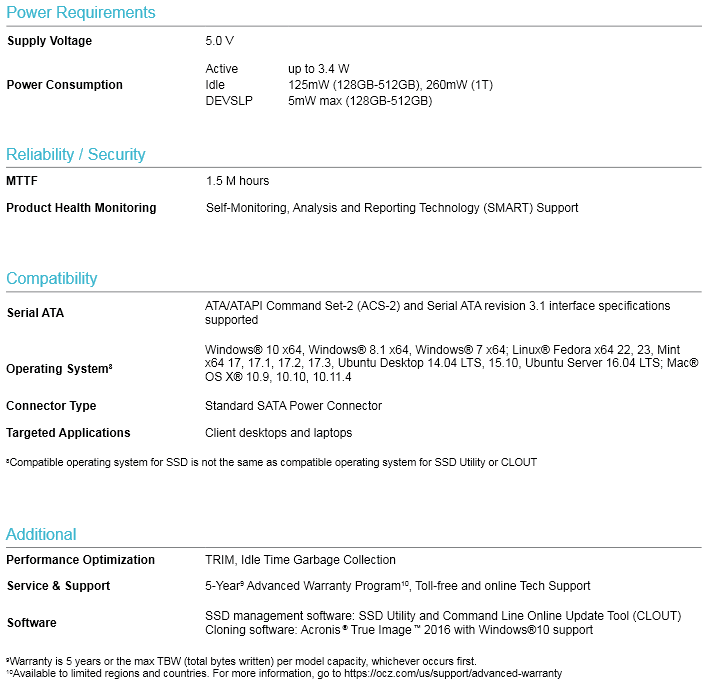
Specifications.
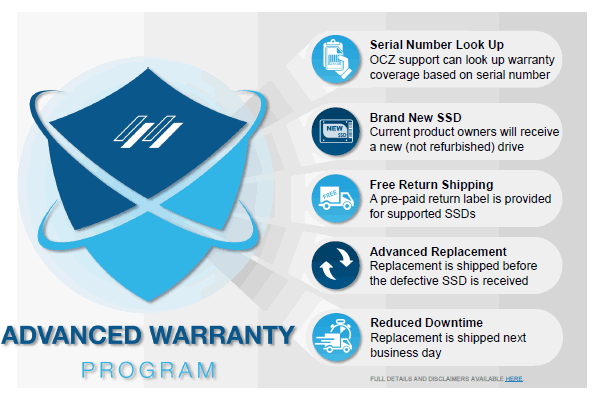
The VX500 also comes with the Toshiba OCZ ‘Advanced Warranty
Program’, which means that if the drive should fail within the five year warranty
period, OCZ will ship you out a brand new SSD as an advanced replacement, thereby
keeping down time to a minimum. OCZ will also supply you with a pre-paid return
label, so that you can return the defective SSD free of charge
Let’s head to the next page where we take a look at our
testing methods and the review PC....
Test machine
For this review I will be using a computer with the
following configuration:
Hardware:
· Motherboard: Asus Z170 Deluxe (Intel
Z170 chipset)
· Processor: Intel 6th generation
Core i7 6700K
· CPU cooler: BeQuiet Dark Rock Pro 2
· RAM: 16GB Corsair Vengeance
LPX 2666MHz DDR4 (dual channel)
· GFX: MSI GTX 950 Gaming 2G
· Sound: Onboard Realtek ALC1050
HD audio controller
· Hard disk OS: OCZ Vector 256GB
SSD.
· Case: Antec Performance One
P280
· PSU: Antec True Power modular
550W
· Display: Dell P2715Q 27” 4K widescreen
IPS LCD (HDCP compliant)
· Operating System: Windows 10 Professional
64bit
· Power consumption testing
equipment: Quarch Technology QTL1824-03 XLC Programmable Power Module
AHCI mode was also selected for all drives in the UEFI of
our test PC, and all tests were carried out in this mode. The SATA 6Gbps drivers
used on our review PC were the Intel Rapid Storage Technology (RST) Version
14.6.0.1029.
CPU power saving states were disabled for consistency, and
all the SSDs in this article were tested with all CPU power saving states
disabled.
Test applications
To test the performance of the Toshiba OCZ VX500 512GB SSD,
I will be using the following test applications in this review.
- HD-Tune Pro
- ATTO
- Iometer
- AS SSD
Benchmark - CrystalDiskMark
- MyCE Reality Suite
- Anvil’s
Storage Utilities - PC
Mark 8 - Quarch Technology Test
Monkey 2
Test procedures
I will start off our testing procedures explanation by
stating that I did not run many synthetic benchmarks on the Toshiba OCZ VX500
512GB SSD. You may ask why I have run so few synthetic benchmarks?
SSD technology has moved so fast in the last couple of years,
that basic synthetic benchmarks alone are now of very limited use, as they don't
really tell us much about performance and how the drive will behave in the real
world. I have therefore decided to show some basic benchmarks of the Toshiba
OCZ VX500 512GB SSD, and will complement this with advanced benchmarks using
IOMeter and AS SSD benchmark. I will also show how the Toshiba OCZ VX500 512GB SSD
performs in the real world with our Myce Reality Suite test.
The reality of SSD performance
Whilst I can easily show you which SSD is technically the
faster, when you use one of these modern SSDs as an operating system drive it
becomes very difficult to tell them apart as far as performance is concerned.
A typical use of a small capacity SSD at the moment is to
have your operating system and applications installed onto the SSD. The
performance difference compared to a traditional HDD is enormous, however when
you start to compare SSD to SSD the difference becomes almost impossible to
detect.
Let’s look at why this is the case.
Drive A can boot to the desktop in 8.11 seconds, and drive B
can boot to the desktop in 8.12 seconds, the difference in time is
milliseconds, and can one really tell the difference?
The fact is, all modern SSDs are only ticking over when they
are only running the OS and launching applications, it’s only when you get to
some of the larger capacity SSDs, with enough free space to be able to hold the
actual data that you’re going to be working with, be that video, audio or
pictures, for example, that you actually get a tangible difference in performance.
This is where the SSDs with the better sequential performance start to pull
well ahead of the SSDs which have lower sequential read/write performance.
Small file random IOPS vs sequential performance
IOPS
This is a fairly complex subject, but I will do my best to
explain things in a manner that is easy to understand.
The term IOPS is the amount of input or output transactions
that can take place in a one second interval, so for example, if an SSD is
quoted as being able to cope with 20,000 4K random write IOPS, then the SSD
should be able to cope with 20,000 input transactions in a period of one
second. If the same SSD is said to be able to produce 20,000 4K random read
IOPS, then the same SSD should be able to produce 20,000 4K random read output transactions
in a one second interval.
Ok, now we have some figures to work with, the next question
is how many IOPS are actually required?
This will depend on your usage pattern. If you are a typical
desktop user who browses the internet, does some word processing or perhaps
some audio or video editing, and perhaps plays a few games, then in actual
fact, you don’t need to have massive 4K random read/write performance. The
actual amount of 4K random performance that is required for a fast and smooth
running system for a desktop user with a usage pattern similar to the above
will be well under 1,000 4K IOPS.
On the other hand, if the SSD is being used for running a
large and complex database server, then 4K random performance is the absolute
measurement of how fast that server will run, as this type of application does
most of its input and output transactions in the 4K domain.
So why would I need an SSD with 80,000 4K IOPS for a
desktop?
In fact you don’t need this type of performance for a
desktop, but an SSD which is capable of coping with 80,000 4K IOPS will be
faster than an SSD which can only cope with 20,000 4K IOPS.
OK, I just said if under 1,000 4K IOPS are actually required
for typical desktop usage, why is an SSD with 80,000 4K IOPS faster than an SSD
with only 20,000 4K IOPS, confused?
You may ask, if I only require 1,000 4K IOPS surely the rest
is wasted?
While you may never need 80,000 4K IOPS, IOPS is all about
latency. The reason that an SSD can cope with as much as 80,000 4K IOPS is
because latency in this domain is very low. With 4K files, even if you require
to process 500 of them at the same time, you are not talking about a huge
amount of data, it has far more to do with how long it takes the SSD to process
a single file, and the amount of time required to process a single 4K is all
about how long it takes for the SSD to access or store that data before it can
move on to the next transaction.
In other words an SSD with 80,000 4K IOPS performance will
handle those 500 files faster than the SSD with 20,000 IOPS.
So how will a desktop user even notice this faster speed if
so little 4K random IOPS and data are actually used?
Multitasking is a good example. The more tasks you run at
the same time, you more you will notice the speed difference.
Sequential performance
I have always maintained that sequential performance was
every bit as important as small random file performance for a desktop SSD. To
me this was always so obvious for a desktop user. For example, let’s say you
want to launch an application or game. Both have some fairly large files to
load, and also a great many small files, but the point is, even the smaller
files are sequential in nature. Now let’s say you’re into audio or video
editing. Video files tend to be huge, and the files are written or read
sequentially. Isn’t this how many users are using their PCs these days?
Summary
So how does this shape up in the real world? Which is
better, massive 4K IOPS or massive sequential performance?
In an ideal world you want both, as an SSD with massive
random 4K IOPS and sequential performance will always be faster than an SSD
that has high sequential performance and moderate 4K random IOPS performance,
and the same applies to an SSD that has massive 4K random performance and
moderate sequential performance. The SSD which has high performance in both
patterns will always be the faster SSD.
However, you can still have an SSD that is very fast for
desktop use that has moderate random 4K performance and massive sequential
performance, the same can be said about a drive having massive random 4K
performance and moderate sequential performance, as it is about getting the
balance right if you have to compromise on one or the other.
Test drives
- Intel 520 series 240GB
- Corsair Neutron GTX 240GB SSD
- OCZ Vector 256GB SSD
- Seagate 600 series 480GB SSD
- OCZ Vector 150 240GB SSD
- Toshiba HG6 256GB SSD
- Samsung 850 Pro 1TB SSD
- OCZ ARC 100 240GB SSD
- Samsung 850 EVO 500GB SSD
- Samsung 850 Pro 512GB SSD
- ZOTAC ZTSSD A5P Premium 240GB
SSD - OCZ Trion 150 480GB SSD
- Samsung 750 EVO 500GB SSD
- Toshiba OCZ VX500 512GB SSD
Drive preparation for running the tests
All the SSDs used in this article were in a clean and fresh
state when the testing period started. From then on, each drive had to rely on
its own NAND cleaning effectiveness for the remainder of the tests.
For the sake of clarity, I now only include SATA 6Gbps SSDs
in these tests, and all were connected to the native Intel SATA 6Gbps (port 0)
of my motherboard for these tests.
- All SSDs used in this article had their partitions aligned
to the Windows 10 x64 defaults.
Where I use graphs in this article to display results, I
will use the following colours to make it easier, for our readers to see which drive
we are reviewing.
![]() Toshiba OCZ VX500 512GB SSD
Toshiba OCZ VX500 512GB SSD
![]() Comparison SSD
Comparison SSD
Now let's head to the next page, where I look at some
basic benchmarks...
Synthetic Benchmarks
HD Tune Pro
In this benchmark I am checking sequential reading speed
with a 4MB block size.
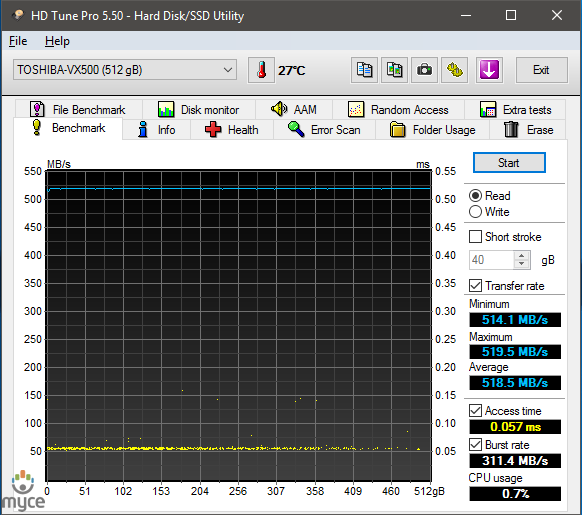
With an average sequential reading speed of 518.5 MB/s the Toshiba
OCZ VX500 512GB SSD shows an excellent turn of speed. Also worth noting are the
fast access times.
Let's see how this compares to other recently tested SSDs in
the table below.
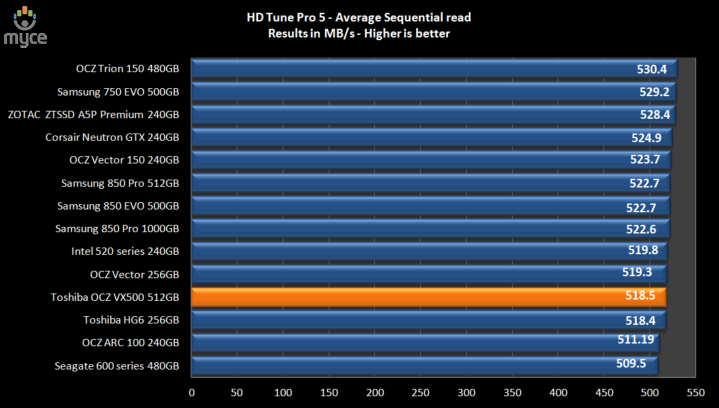
The Toshiba OCZ VX500 512GB SSD has done well in the HD Tune
Pro 5 sequential reading test, and whilst there isn't a large margin between
the top SSDs, the Toshiba OCZ VX500 512GB is the eleventh fastest SSD in this
test.
ATTO disk benchmark
ATTO has become a standard tool for measuring the data
throughput of HDDs and SSDs. It measures the reading and writing performance,
using different file sizes and block sizes.
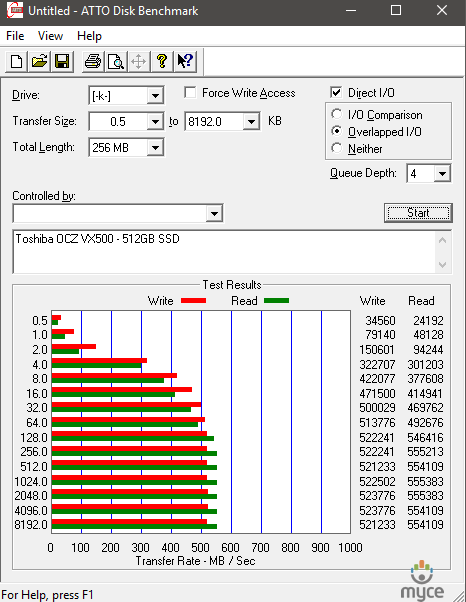
The reading speed results for the Toshiba OCZ VX500 512GB SSD
are extremely impressive, topping out at over 555 MB/s, and writing speed is
equally impressive topping out at over 523 MB/s.
Let's find out how this compares with other recently tested
SSDs.
ATTO Reading performance
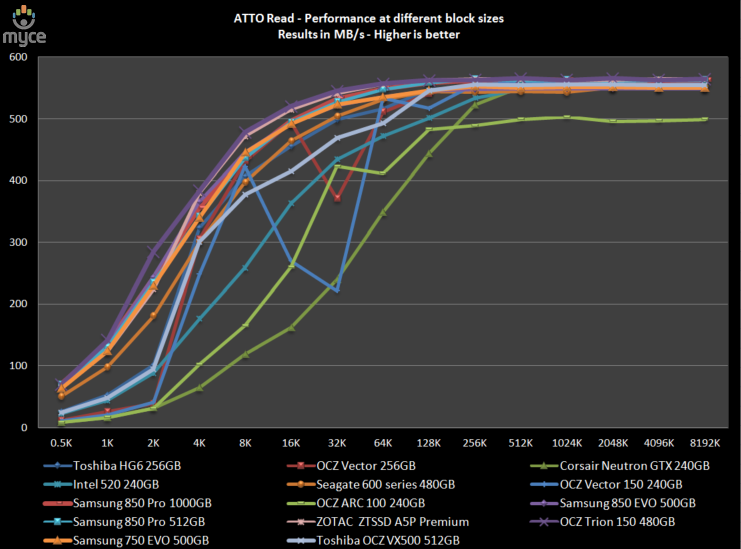
ATTO - Reading
performance at various block sizes
The OCZ VX500 512GB SSD is one of the fastest SSDs, when
reading data.
ATTO Writing performance
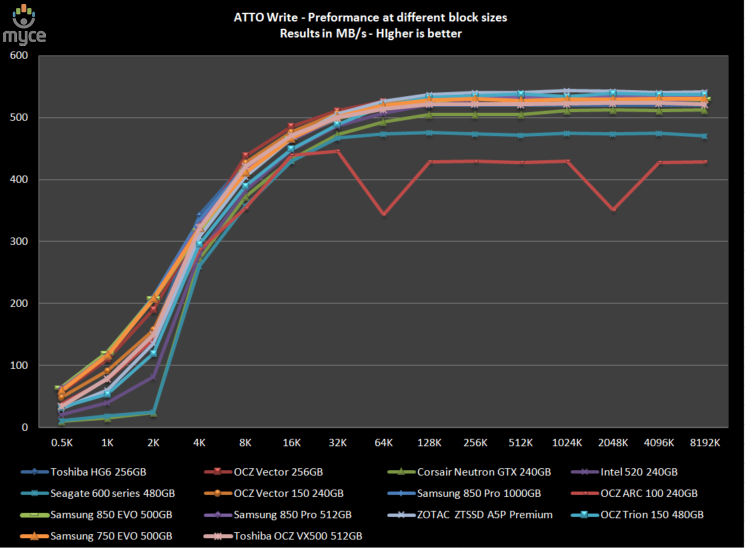
ATTO - Writing
performance at various block sizes
The Toshiba OCZ VX500 512GB SSD shows excellent writing
performance.
CrystalDiskMark 3.0
Crystal Disk Mark is quite a handy benchmarking application,
as it focuses on the file sizes that can cause a problem on a system drive.
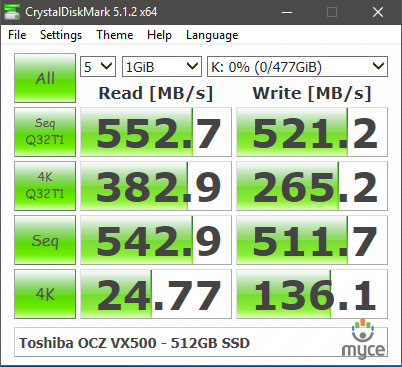
As we can see from the above screenshot, sequential reading and
writing speeds are both very impressive, also random writing performance at low
and high queue depths is very good.
AS SSD Benchmark
AS SSD benchmark is a benchmarking tool specifically
designed to test SSDs. The application tests sequential reading and writing
performance, 4K random reading and writing performance.
AS SSD benchmark also tests 4K threaded performance. This is
very exciting, as this test is the first available test that I am aware of,
that simulates how a PC operating system actually works. A modern PC and OS,
such as Windows 10 does not just run a single thread at a time, it runs many
threads. The AS SSD benchmark "4K 64Thrd" tests run 64 threads
simultaneously throughout the test. If this result is good, then you can be
pretty sure the drive will perform extremely well as a system drive.
After the tests complete, AS SSD benchmark derives a total
score for the drive being tested. This is based on all aspects of the test
results, and gives an indication of how the drive is performing overall.
Now let’s look at the result from the Toshiba OCZ VX500 512GB
SSD in the form of a screenshot. All our other comparison drives’ results are
presented in the form of a graph.
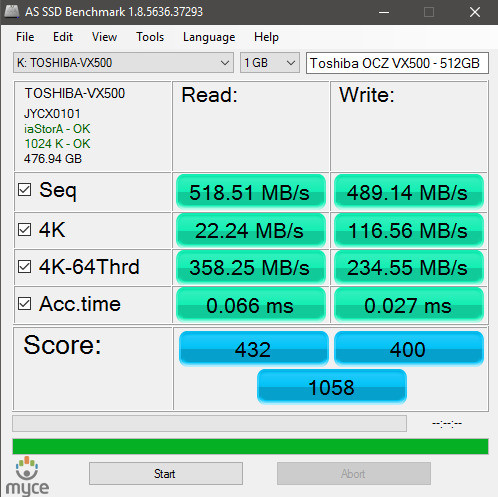
Toshiba OCZ VX500 512GB
SSD
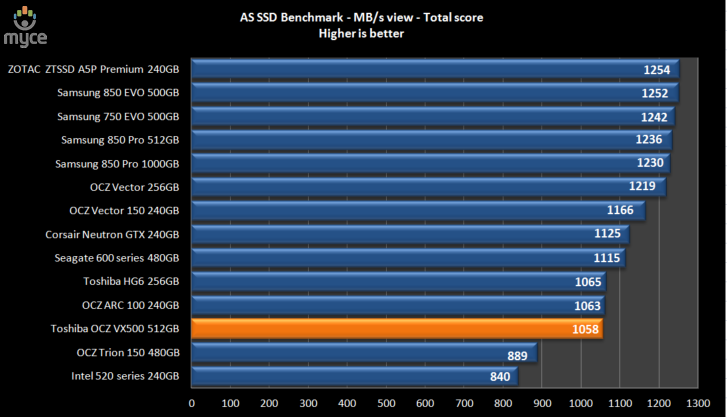
As we can see from the AS SSD test run, the Toshiba OCZ
VX500 512GB SSD can’t quite keep pace with the fastest SSDs in this test, but
is nonetheless performing well.
Summary:
The Toshiba OCZ VX500 512GB SSD has performed well in the
basic synthetic benchmarks. Random reading performance is excellent and random writing
performance is good. Sequential reading and writing performance is excellent.
Let's head to the next page for our IOMeter test
results.....
I/O Performance
There is little point of having an SSD drive that has
blazing sustained reading and writing speeds, if the drive can't handle reading
and writing of small random files. If you intend to use your new SSD drive to
store and run your operating system, then the drive must be able to cope with
the many small random files that Windows will write to the drive continually.
So I feel it is very important to test how many of these random files that a
drive can handle in one second. I believe that anything over 1,000 I/O’s per
second would be enough for most users running a consumer grade mainstream PC,
and should provide a smooth running system. But obviously, the more I/O's that a
drive can handle, the faster the drive will feel and leave more headroom for
those huge multitasking sessions that users sometimes engage in.
IOMeter is probably the most versatile of all the synthetic
benchmarks. Its ability to be configured to generate a multitude of different
I/O traffic is unmatched. Another great feature of IOMeter, is the capability
to test any storage metric that you can think of, providing you know how to
configure the assignments. The reviewer also has complete control over things
like queue depth, block size, whether the traffic is random, sequential, or
even a mixture of both.
Partition alignment and sector boundaries
Windows 10, Windows 8.1, Windows 7, and Windows Vista will
automatically align a partition to 4k boundaries during partition creation,
Windows XP won’t. It is imperative that an SSD’s partition is aligned. Windows
XP is also restricted to sector boundaries, while Windows 7 and 8 will use 4k boundaries
if they can. The Toshiba OCZ VX500 512GB SSD is 4k boundary aware, and will use
these boundaries if possible. Of course it will also remap LBAs for compatibility
with the sector boundaries so that the drive can be used with Windows XP.
IOMeter allows us to set the sector boundaries for
conducting the tests, and I have therefore set the sector boundaries at 4K,
which means the IOMeter tests are valid for Windows 7, Windows 8, and Windows
Vista users. XP users will not be able to obtain such results.
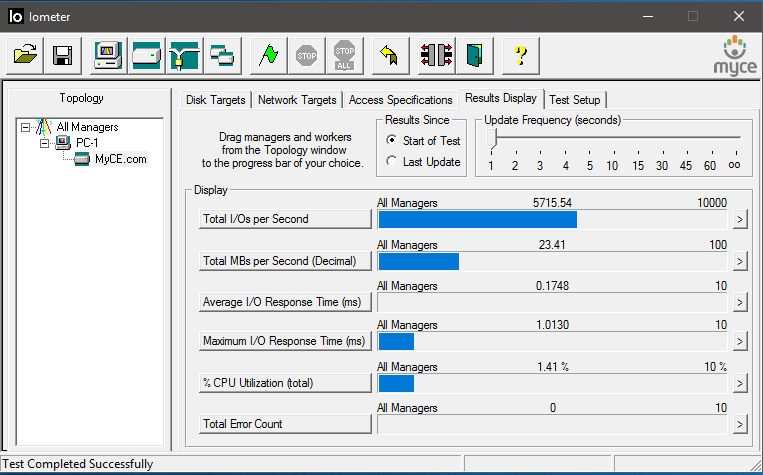
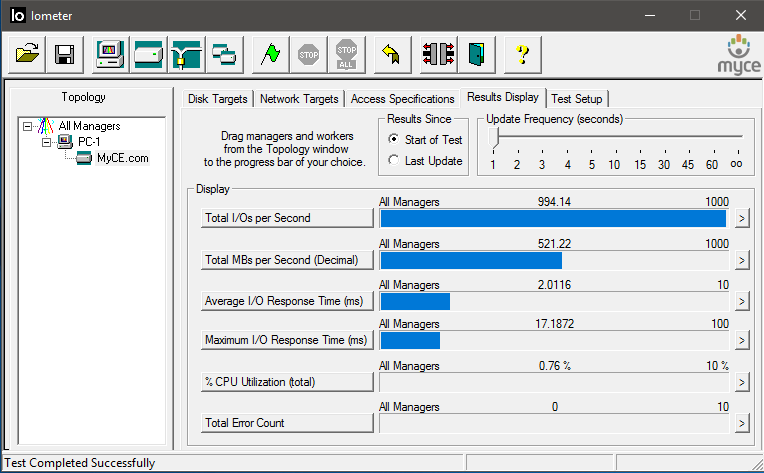
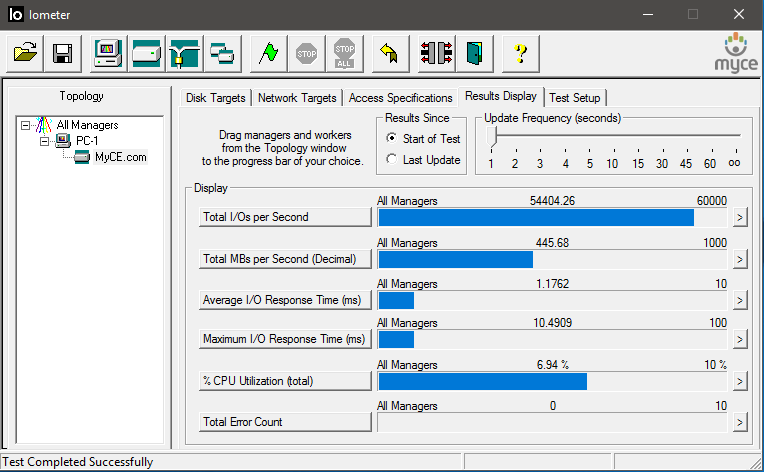
I will provide a screenshot of the tests on the review drive
for those of you who like to see the actual test result. All the comparison
drive results are represented in the form of graphs.
If any of you would like to see a screenshot from any
IOMeter test on a particular drive, please feel free to request one, and I’ll
post the screenshot in the forum thread.
All the IOMeter tests create a 10GB data set on the target
drive, and each test is run for a duration of 3 minutes.
IOMeter 4K random write test with repeating data.
The first test involves creating continual 4KB random files
on the target drive with IOMeter. I use a 4KB file size, as it is believed that
Windows will create and modify many of this size of file constantly in the
background during a typical Windows session. It is said that most 4K random
writes take place at a queue depth of only one, and I have been requested to
include this test in my reviews.
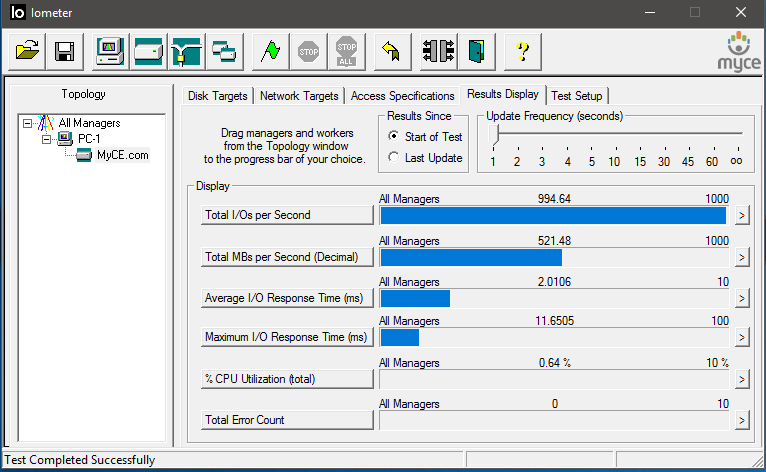
Queue depth 1
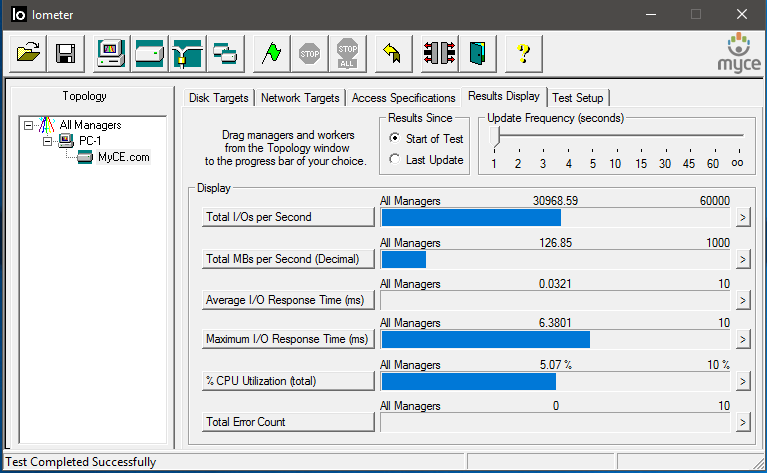
Toshiba OCZ VX500 512GB
SSD – 4K random write (QD 1)
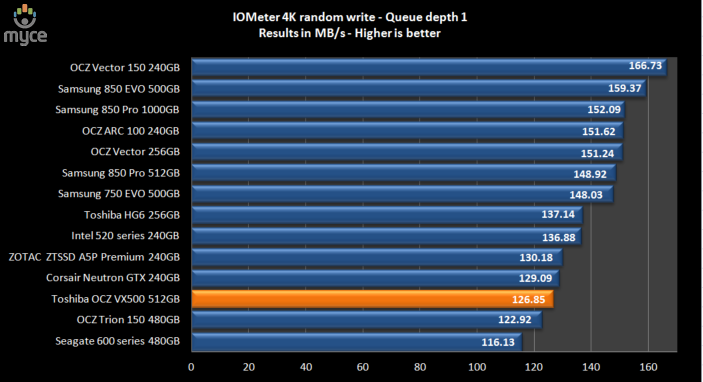
At 126.85 MB/s the Toshiba OCZ VX500 512GB SSD's result is
very good, and it finishes this test in twelfth place.
Our next test involves creating continual 4KB random files
on the target drive with IOMeter. I use a 4KB file size, as it is believed that
Windows will create and modify many of this size of file constantly in the
background during a typical Windows session. I will use queue depths of 4 and
32 for these tests.
Queue depth 4
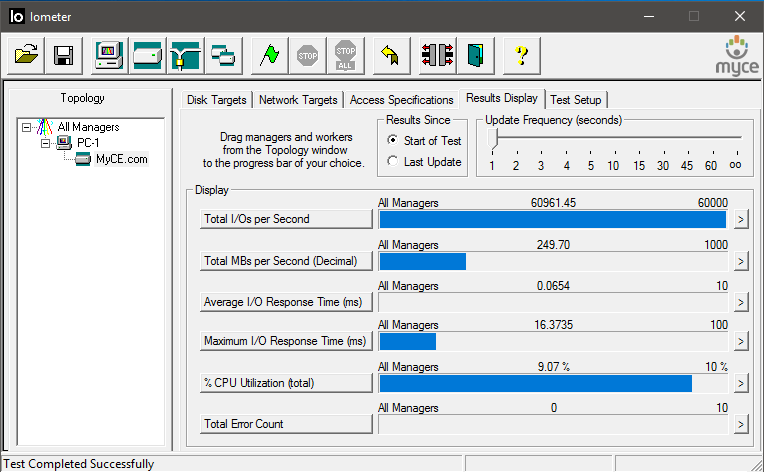
Toshiba
OCZ VX500 512GB SSD (QD 4)
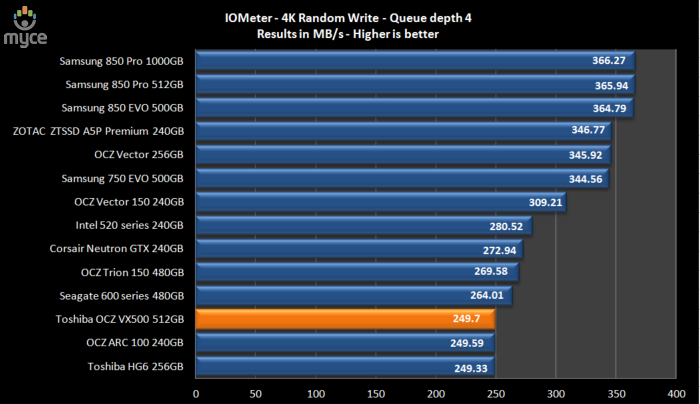
At a queue depth of 4, the Toshiba OCZ VX500 512GB SSD is
good, and finishes this test in twelfth place.
Queue depth 32
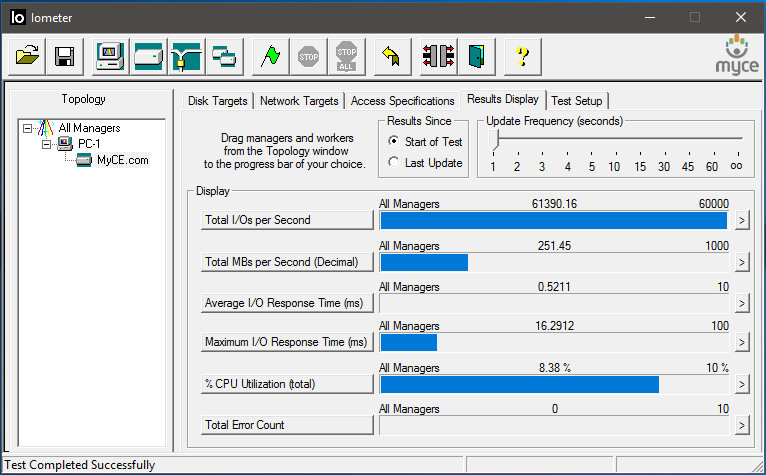
Toshiba
OCZ VX500 512GB SSD (QD 32)
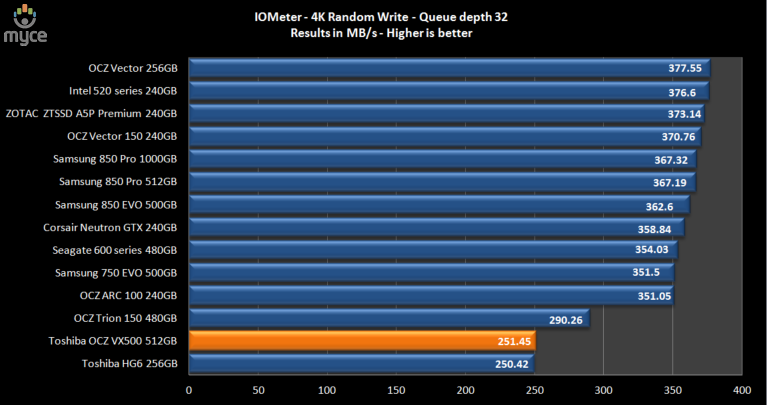
At 251.45 MB/s, the Toshiba OCZ VX500 512GB SSD is
struggling a little, and finishes this test in thirteenth place.
IOMeter 4K random write test with fully random data.
This test is exactly the same as the test above except that
the test data is fully random and is therefore much more difficult to compress.
This test was requested as SandForce based SSDs gain a lot of performance by
being able to compress data on the fly. While the above test shows the
SandForce based SSDs in a best case scenario, the following test will show the
SandForce based SSDs in a much more realistic scenario.
Queue depth 4 with fully random data
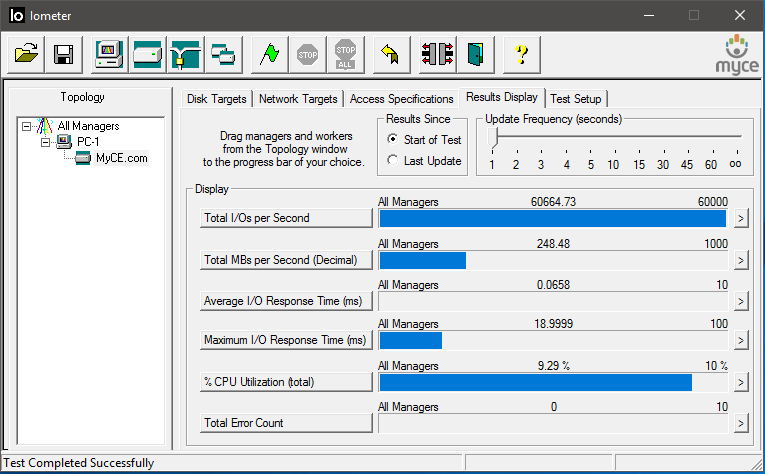
Toshiba OCZ VX500 512GB
SSD – 4K random write (QD 4 with fully random data)
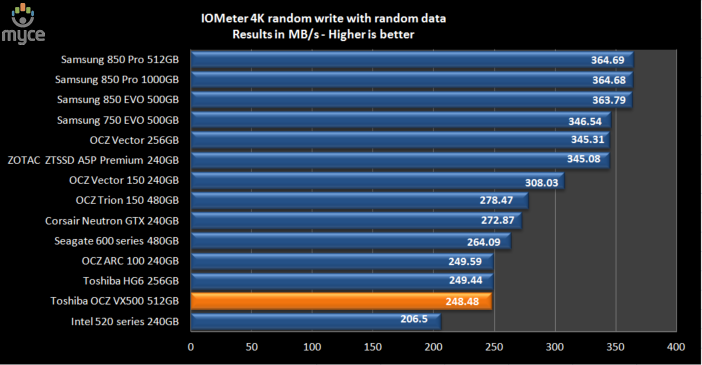
The Toshiba OCZ VX500 512GB SSD pays no penalty when writing
data which is incompressible, and at 248.48 MB/s it finishes the test in thirteenth
place.
4K random write queue depth profile
For this test I used various queue depths from 1 – 32 to
give you an idea how this SSD performs at different queue depths. For a normal
desktop user, with lightweight multitasking, the queue depth will rarely rise
above 2. For heavy multitasking, the queue depth is unlikely to rise above a
value of 8.
The results are shown below.
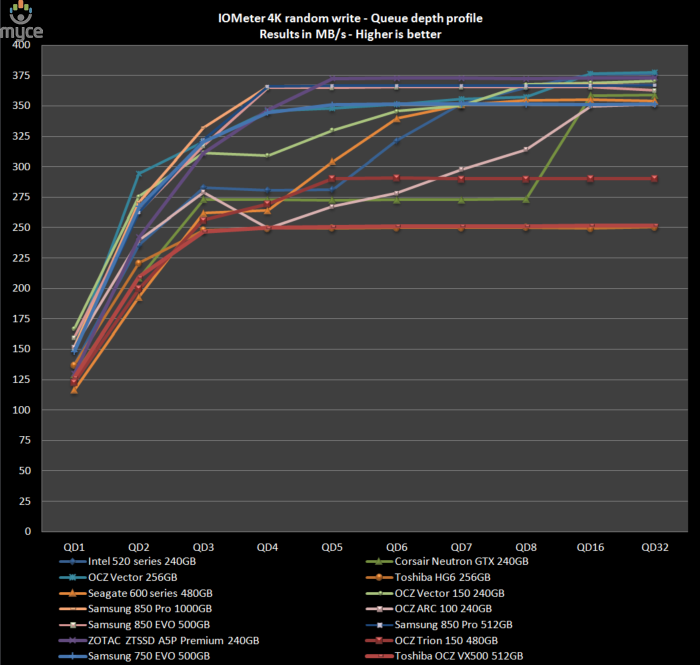
As we can see, the Toshiba OCZ VX500 512GB SSD has excellent
performance at low queue depths but, after it reaches a queue depth of 4,
performance doesn't really increase with higher queue depths.
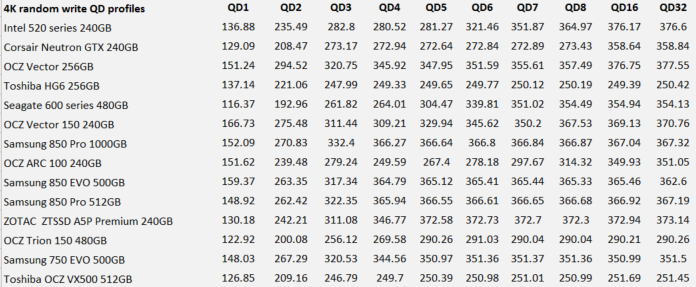
Below I present a table of the results in more detail.
IOMeter 4K random read test.
If there are many 4k files created, then that must also mean
that many 4k files need to be read. This test measures 4k reading performance.
It is said that most 4K random reads take place at a queue
depth of only one, and readers have requested that I include this test in my
reviews.
Queue depth 1
Toshiba OCZ VX500 512GB
SSD - 4K random read (QD 1)
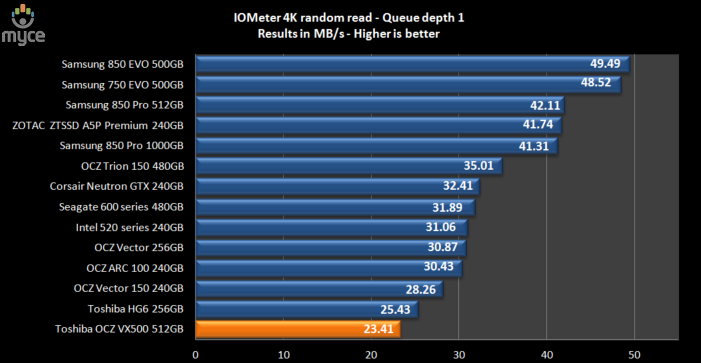
In this test the Toshiba OCZ VX500 512GB SSD struggles, and
finishes at the bottom of the table.
Queue depth 4
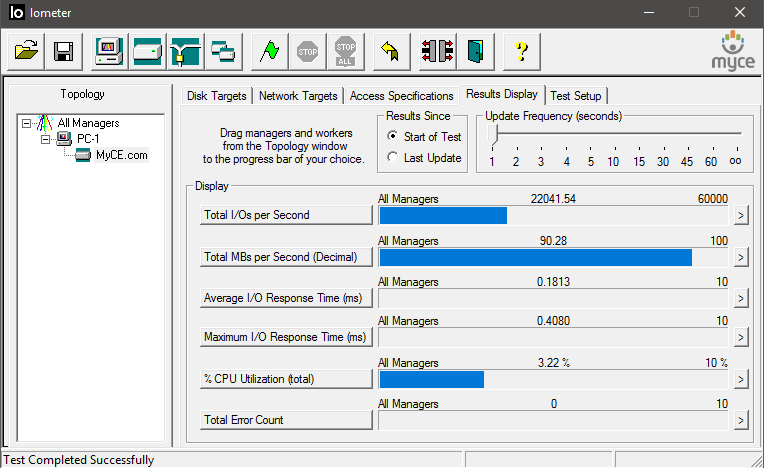
Toshiba OCZ VX500 512GB
SSD - 4K random read (QD 4)
At a queue depth of four, the Toshiba OCZ VX500 512GB performs
much better, and is the tenth fastest SSD in this test.
Queue depth 32
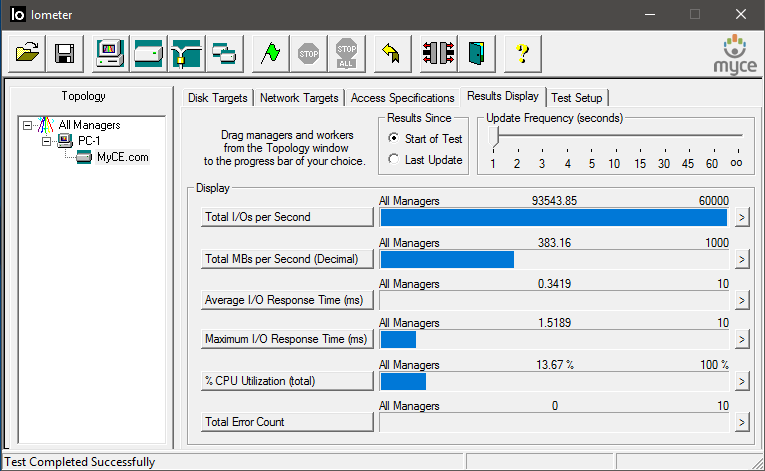
Toshiba OCZ VX500 512GB
SSD - 4K random read (QD 32)
At a queue depth of 32, the Toshiba OCZ VX500 512GB SSD gives
excellent performance, and is the sixth fastest SSD in this test.
4K random read queue depth profile.
This test shows how the review drive scales with increasing
queue depths.
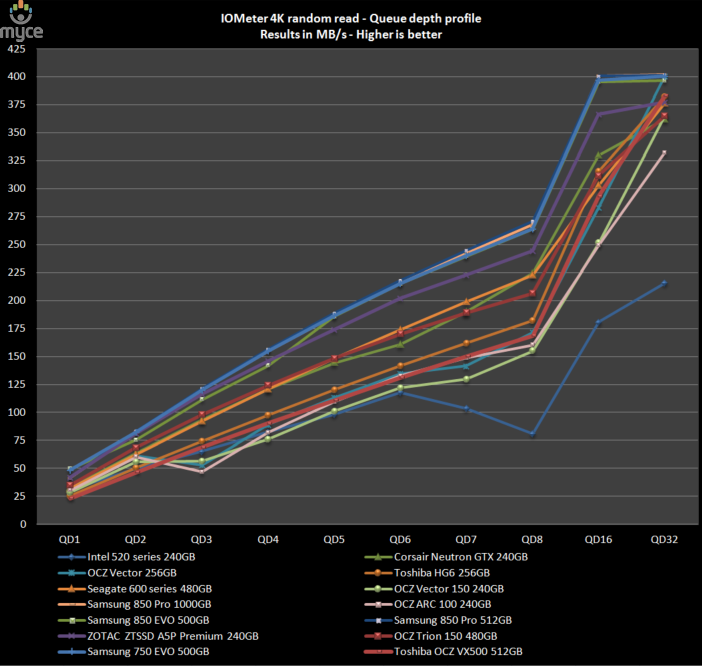
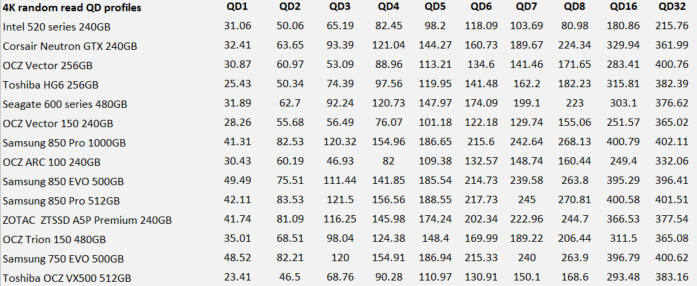
Below I present a table of the results in greater detail.
When we look at the Toshiba OCZ VX500 512GB SSD 4K random
read performance in detail, at low queue depths the performance isn’t the best,
but the Toshiba OCZ VX500 512GB scales exceptionally well, all the way up to a
queue depth of 32.
IOMeter 512KB sequential write test with repeating data.
Sequential writing performance is also very important; in
this test sequential writing performance is measured.
Toshiba OCZ VX500 512GB
SSD - 512K Sequential write with repeating data
The Toshiba OCZ VX500 512GB SSD delivers an excellent turn
of speed, finishing this test in tenth place.
512K sequential write - Queue depth profile
While most sequential writes will rarely rise above a queue
depth of two, it has been noted from SATA analyzer traces that with more
demanding tasks, queue depths can rise very close to a queue depth of four.
This is why I now include queue depth profiles for sequential read and write.
Please note that in the following graph, I do not have the
lowest possible score set at zero. This is purely to allow the graphs to be
easier to read, but starting with a lowest possible score other than zero,
gives the impression that there are large differences between competing SSDs with
regard to performance, so please keep this in mind.
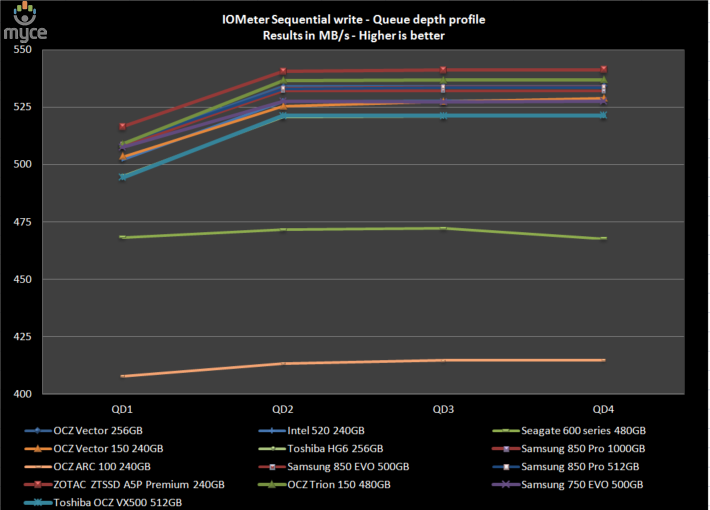
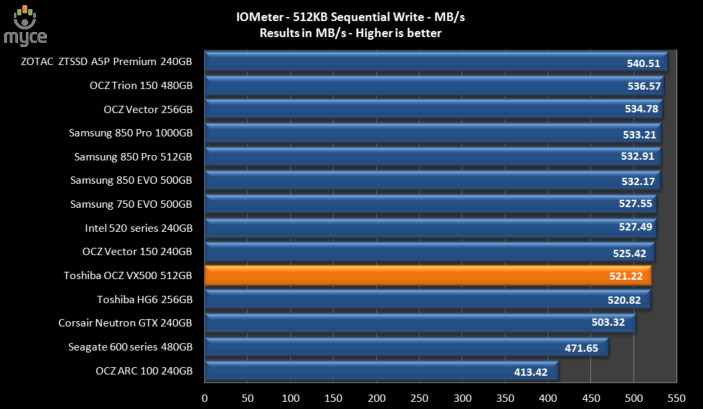
512K sequential write
- Queue depth profile
Below I present a table of the results in more detail.
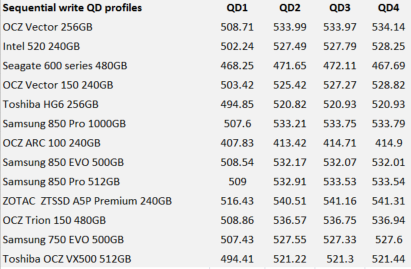
The Toshiba OCZ VX500 512GB SSD series reaches peak performance
at a queue depth of four, where it manages 521.44 MB/s.
IOMeter 512KB sequential write test with fully random data.
This test is almost exactly the same as the test above
except that the test data is fully random in nature. This test was requested as
SandForce based SSDs gain a lot of performance by being able to compress data
on the fly. While the above test shows the SandForce based SSDs in a best case
scenario, the following test will show the SandForce based SSDs in a more
realistic light. In the real world, the data is neither 100% incompressible nor
100% compressible, it is somewhere in between. So please keep this in mind.
Toshiba OCZ VX500 512GB
SSD – 512K sequential write with fully random data
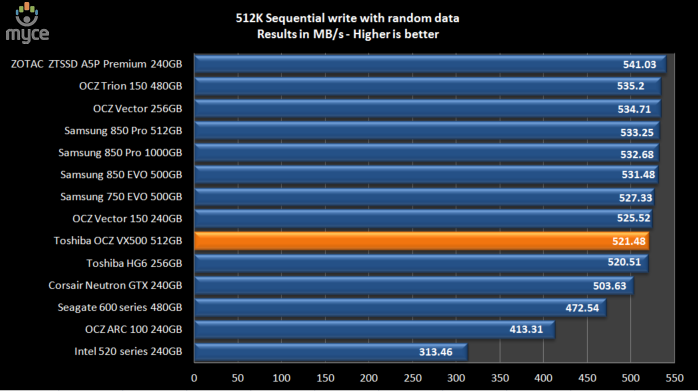
With data that is not so easy to compress, the SandForce SF-2281
based SSDs take a big performance hit, whilst the Toshiba OCZ VX500 512GB SSD returns
an impressive 521.48 MB/s, and finishes this test in ninth place.
IOMeter 512KB sequential read test QD1.
This test measures 512k sequential reading performance at
very low queue depths.
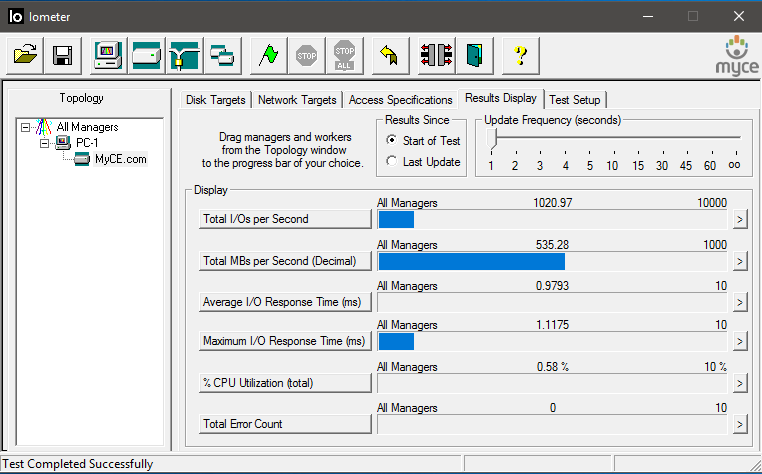
Toshiba OCZ VX500 512GB
SSD – 512K sequential reading test (QD 1)
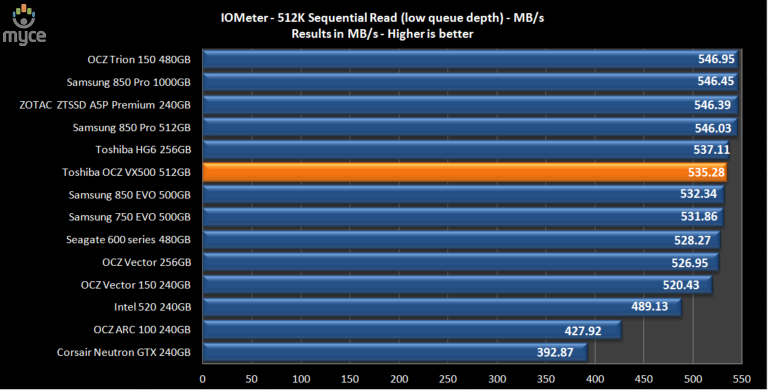
The Toshiba OCZ VX500 512GB SSD has excellent sequential
reading performance at very low queue depths, finishing in sixth place.
IOMeter 512KB sequential read test (dual threaded).
This test measures 512k sequential reading performance QD2.
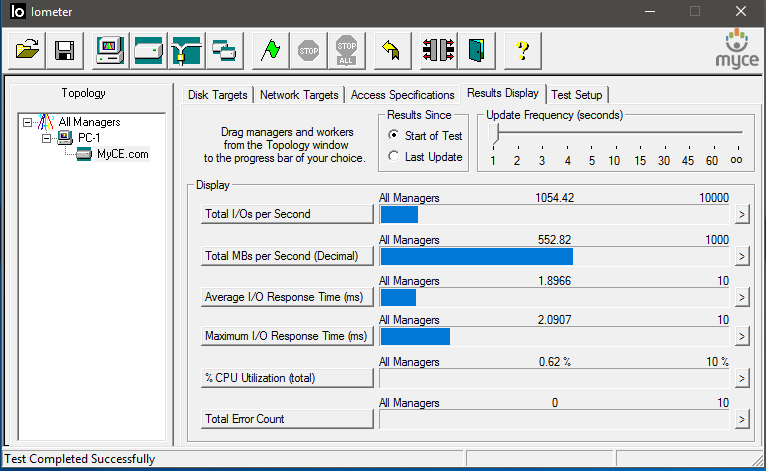
Toshiba OCZ VX500 512GB
SSD – 512K sequential reading test (QD 2)
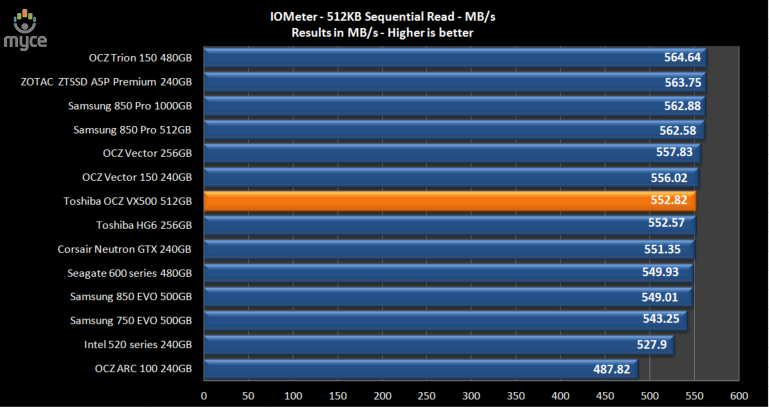
At a more realistic queue depth the Toshiba OCZ VX500 512GB
is still showing excellent sequential reading performance for an SATA SSD, and
finishes this test in seventh place.
512K sequential read - Queue depth profile
While most sequential reads will rarely rise above a queue
depth of two, it has been noted from SATA analyzer traces that with more
demanding tasks, queue depths can rise very close to a queue depth of four.
This is why I now include queue depth profiles for sequential read and write.
Please note that in the following graph, I do not have the
lowest possible score set at zero. This is purely to allow the graphs to be
easier to read, but starting with a lowest possible score other than zero,
gives the impression that there are large differences between competing SSDs with
regard to performance, so please keep this in mind.
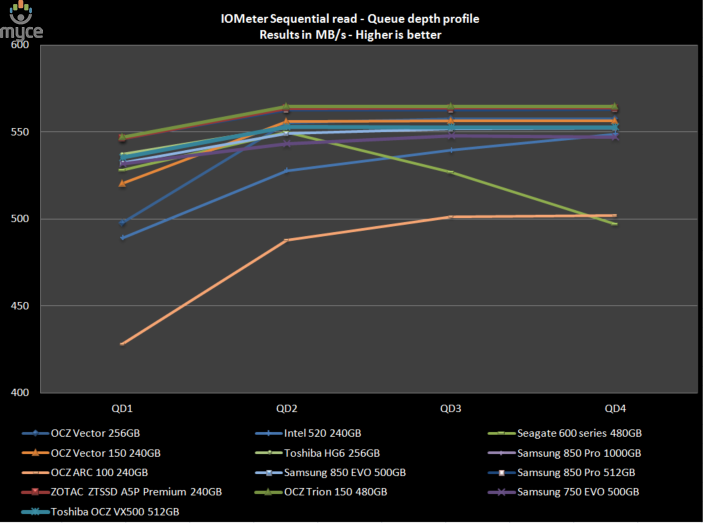
512K sequential read - Queue depth profile
Below I present a table of the results in greater detail.
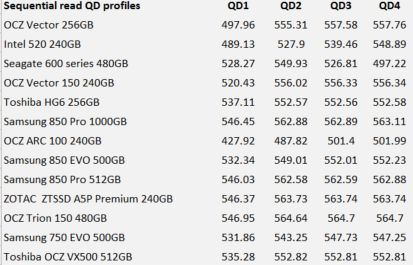
The Toshiba OCZ VX500 512GB SSD reaches maximum sequential
reading performance at a queue depth of two, where it achieves an excellent 552.82
MB/s.
IOMeter Workstation simulation (outstanding I/Os = 64).
When running applications you will find that there is a
mixture of small random files and larger sequential files, being created and
read. Not only that, it isn’t just one file at a time. In this test I measure a
simulated workstation pattern, with a queue depth of 64 (threaded).
Toshiba OCZ VX500 512GB
SSD – Workstation simulation
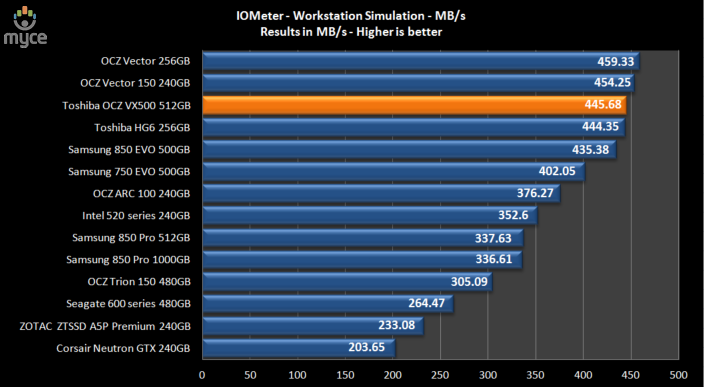
The 'workstation' simulation sorts the men out from the
boys, with its mixed reads and writes. This test shows how an SSD could behave with
a heavy workload, in a graphics, or video workstation environment. The Toshiba
OCZ VX500 512GB SSD has outstanding mixed read/write performance, and finishes
this test in third spot.
Summary
All in all, the Toshiba OCZ VX500 512GB SSD has performed well
in our IOMeter tests. It has excellent reading performance, and writing
performance is also of a very high standard. The Toshiba OCZ VX500 512GB also has
outstanding mixed reading and writing performance, which is a key factor for a
mainstream consumer SSD.
Now let’s head to the next page where we will look at how
the Toshiba OCZ VX500 512GB SSD performs using a new benchmarking
application....
Anvil’s Storage Utilities
As well as performing SSD endurance tests. Anvil’s Storage
Utilities has a very nice SSD benchmarking application. The SSD benchmark tests
many different aspects of SSD performance, including 4K random at different
queue depths, and also sequential performance, but more importantly than this,
all using real test data.
Another very nice feature of Anvil’s SSD benchmark is the
fact that you can change the compression levels of the test data. The
compression levels of the datasets used for the tests can be varied from 0%
compression right up to 100% compressed data, and there are even a few data
profiles already included, such as database (8%) compression, and also an
application profile (46%) compression, which is designed to simulate real
application data being read and written to the SSD.
I will include a screenshot of the review drive, and all
comparison results will be presented in the form of graphs. If you would like
to see screenshots of the test results obtained on the other SSDs in this
article, you can do so by following the link here.
I will also be testing three different compression profiles,
which are as follows.
- 0 fill (100% compressible data)
- Application simulation profile (46% compressed)
- 100% (incompressible data)
So let’s begin the tests.
0 fill
Toshiba OCZ VX500 512GB
SSD (0 fill)
In the 0 fill test, the Toshiba OCZ VX500 512GB SSD has
performed well.
Application profile
Toshiba OCZ VX500 512GB
SSD (application profile)
The application test pattern is much more realistic in terms
of the type of data that real users will employ, and this time the Toshiba OCZ
VX500 512GB SSD is the eleventh fastest SSD.
100% incompressible
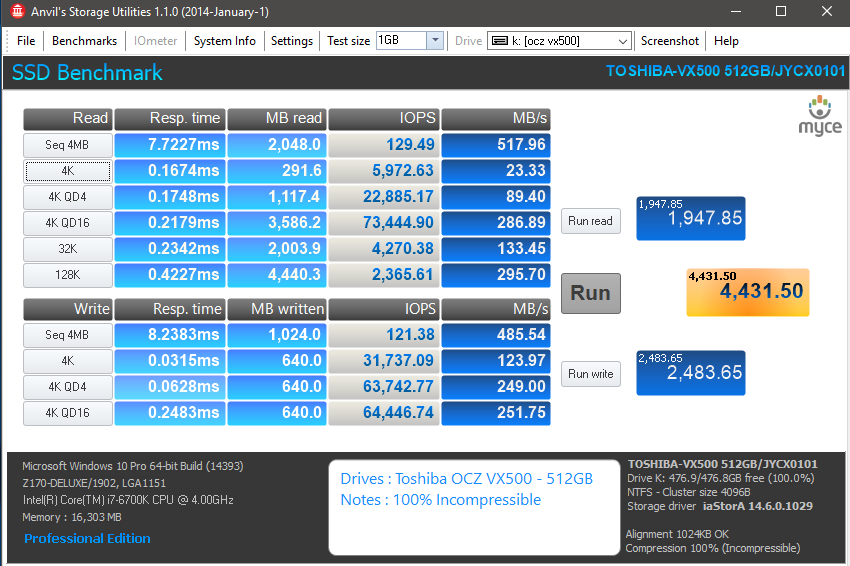
Toshiba OCZ VX500 512GB
SSD (100% incompressible)
With test data that can't be compressed at all, the Toshiba
OCZ VX500 512GB SSD is still excellent, and finishes the test in tenth place.
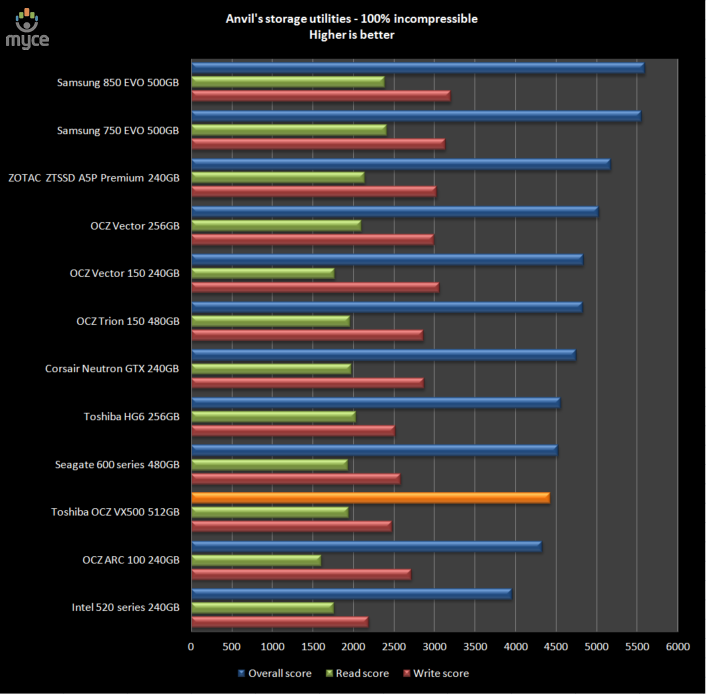
Summary
One should keep in mind that although Anvil’s Storage
Utilities SSD benchmark is a very good benchmark, and tests many aspects of SSD
performance, ultimately it is demonstrating which SSD is technically the
fastest when reading data, and this may not be showing (for example) which
drive will be fastest in the real world with a home user's work pattern.
The Toshiba OCZ VX500 512GB SSD has however performed very
well in Anvil's SSD benchmark tests.
Now let's head to the next page for some real world tests....
It has become clear that simply conducting endless
benchmarks on SSD drives is pointless. Real users may run a few benchmarks when
they first fit their SSD drive, but most users just want a drive that performs
well in the real world. They want their drive to work "out of the
box" and run fast and smoothly.
Most of the latest SSD drives can deliver very fast
sustained reading and writing speeds, but these alone tell you very little
about how the drive will perform in the real world.
If you intend to use your SSD as your primary system drive,
with an operating system and applications installed and running from the drive,
real world performance becomes much more important than just fast sequential
read and write speeds.
Real world copy
tests
I will now conduct a few real world copy tests. These tests
simulate what real people do with their drives. I will be conducting writing
tests, using a large single file, and I will then round off the tests by
copying a folder of MP3 audio files, and also a folder of JPG pictures.
In past reviews I simply used Windows copy and paste to copy
the files from one drive to the target drive, and then I measured the time
taken to complete the test with a stop watch. This method was flawed in a
couple of ways. Windows employs a cache, so even when the files had been
copied, some of the data was still in the Windows cache and hadn't yet been
written to the SSD. The other flaw was that a stop watch is not a very accurate
way of measuring the time taken to complete the test.
I had also noticed that copying the small file set had
become pointless, as most modern SSDs have a rather large cache, in fact large
enough to be able to take the complete file set in this cache without having to
commit that data to NAND before the test had completed. I could have increased
the amount of data in the test, but I felt this was moving away from the real
world. For example, who would copy 2GB of data containing only very small
files?
I concluded it was perhaps better just to drop this test
completely, and just focus on the large 8GB ISO file, the folder of MP3 audio
files, and the folder of JPG picture files. I also have taken the opportunity
to increase the amount of data to be copied in the MP3 and JPG tests, to make
sure the SSD's memory cache doesn't obtain an unfair advantage.
The other change is that I now use an application to copy
the data, which also times how long it takes to complete the test. This
application also supports "cache write-through". What this basically
means is, there is now no caching of the files, and instead the data being
copied must be committed to the target SSD as it's being copied.
Obviously making such changes to the methods of testing is
not taken lightly. To make changes means a lot of extra work, as all the
comparison drives have to be re-tested with the new method. However, here at
Myce.wiki, we believe we should always try to improve our reviews, and if that
means updating the testing methods and some initial extra work, then that benefits
the Myce community as a whole.
For the reading drive, I have made the switch to a RAMDisk.
With SATA Express SSDs just around the corner, the OCZ REVODrive X2 would no
longer be fast enough to supply data to an NVMe PCIe3 SSD. Because RAM has
lower latency and higher transfer speeds when compared to an SSD, this has
meant having to rerun the tests on a selection of other SSDs to make sure the
results are up to date. Please note, that some SSDs which were on loan during
the review period, has meant that these SSDs still use the old results, simply
because I can't retest them.
For the tests themselves, I will show a screenshot of the
copy test for the SSD that I'm reviewing. All other results will be presented
in the form of a graph, so you can easily compare the results.
Single large file writing test (8144.6MB)
For this test I used a single DVD9 ISO file which had been
copied to the RAMDisk. The file was then copied to the Toshiba OCZ VX500 512GB
SSD and our comparison drives.
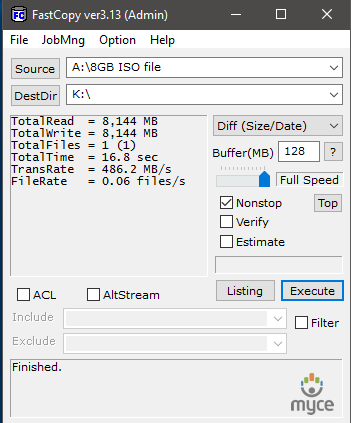
Toshiba OCZ VX500 512GB
SSD
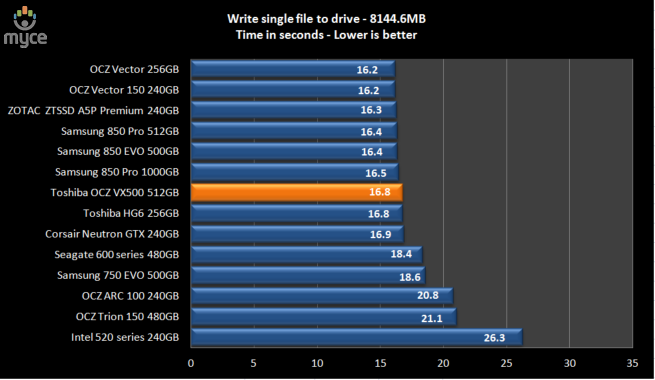
Although the Toshiba OCZ VX500 didn’t excel in our synthetic
benchmarks. In the ‘real world; the VX500 is excellent, finishing this test in
seventh place.
Write a folder of JPG picture files.
For this test I copied a folder of JPG picture files from
the RAMDisk to the Toshiba OCZ VX500 512GB series 512GB SSD, and our other
comparison drives. The folder contained 7861 JPG pictures, with a total
capacity of 8410.3MB.
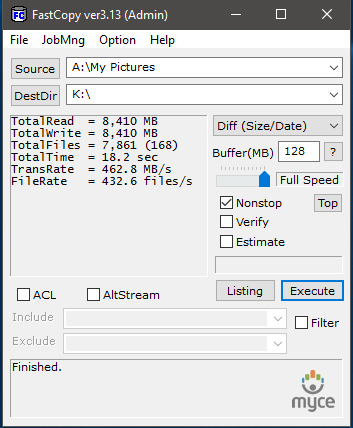
Toshiba OCZ VX500 512GB
SSD
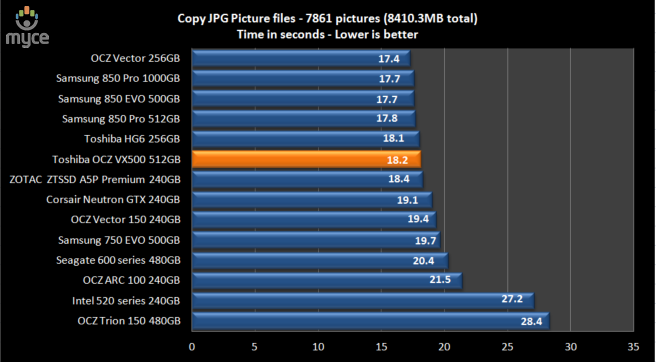
Once again the Toshiba OCZ VX500 512GB is excellent, finishing
this test in sixth spot.
Write a folder of MP3 audio files.
For this test I copied a folder of MP3 audio files from our RAMDisk
to the Toshiba OCZ VX500 512GB SSD series SSD and our other comparison drives.
The folder contained 1691 MP3 audio files, with a total capacity of 9176.5MB.
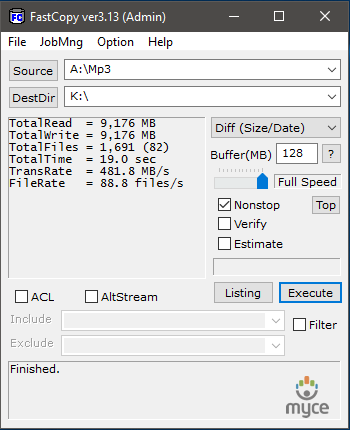
Toshiba OCZ VX500 512GB
SSD
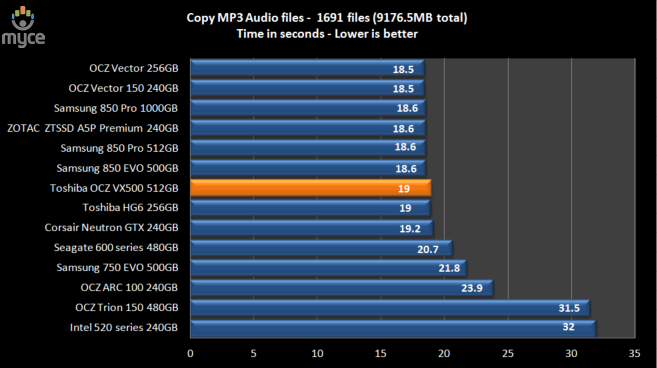
Yet again the Toshiba OCZ VX500 512GB SSD is excellent, finishing
this test in seventh spot.
Single drive copy tests
These tests are to simulate a single drive in a PC or
laptop. In other words, I will copy a series of files from one folder on the
tested drive to another folder on the same drive. This means the drive is simultaneously
reading and writing during the tests. I also want to make this a realistic test,
so I have used a folder of MP3 music files, and then repeated the test with a
folder of JPG picture files.
Single drive copy tests – 1,691 MP3 song files (9176.5MB total)
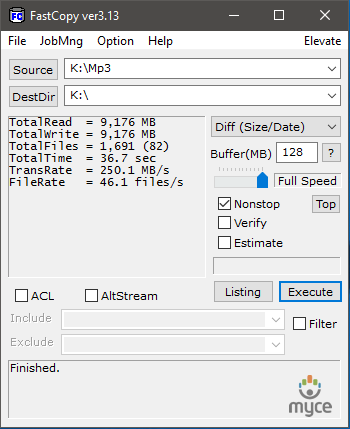
Toshiba OCZ VX500 512GB
SSD
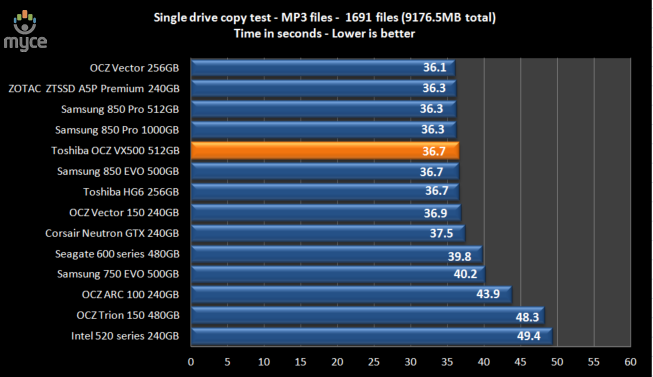
Again the Toshiba OCZ VX500 is excellent, finishing this
test in fifth place.
Single drive copy tests – 7,861 JPEG picture files (8410.3MB total)
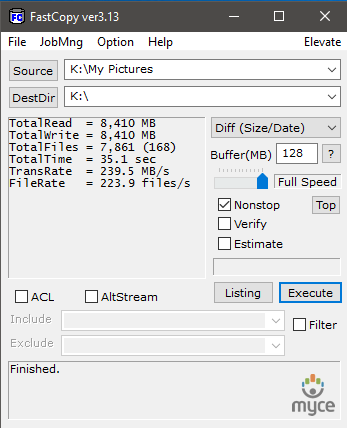
Toshiba OCZ VX500 512GB
SSD
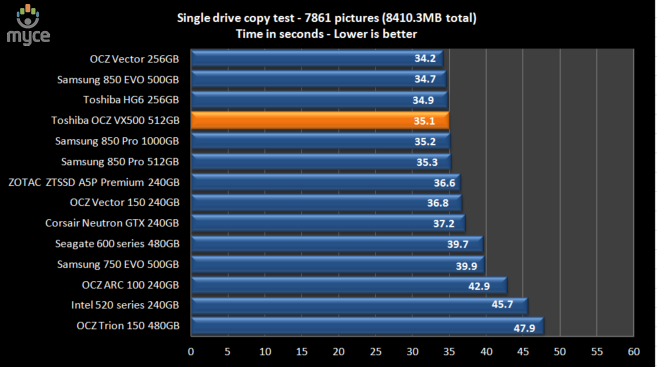
Once again, the Toshiba OCZ VX500 is excellent, and finishes
in fourth spot.
Summary
It is timely reminder why we should not rely on synthetic
benchmarks when we judge the performance of an SSD. The Toshiba OCZ VX500
didn’t perform at the top of the tree when I tested it using synthetic
benchmarks, yet in the ‘real world’ the Toshiba OCZ VX500 performs extremely
well.
The key to good real world performance is having good mixed
reading and writing performance, and the VX500 has this in abundance.
Installing applications
Installing applications is possibly something you don't do
that often. But should you replace your system disk, then you will most likely
have to re-install your applications. Most of the SSD drives I have tested up
until now are quite slow at installing applications, most likely because their
I/O performance was quite limited.
For these tests, we picked some popular applications and
copied the entire contents of the CD or DVD media to a RAMDisk. We did this to
make sure that the reading speed of our CD/DVD reader would not hamper the
performance of the target drive.
We then installed these applications onto our comparison drives,
which were all running mirror image installations of our Windows 8 Professional
64-bit installation, and timed the amount of time taken to install the
application with a stopwatch on each of the drives.
MS Office 2007 Professional (full install)
MS Office is one of those applications that make you cringe
at the thought of re-installing it.
Let's find out how our drives coped with the MS Office 2007
full install.
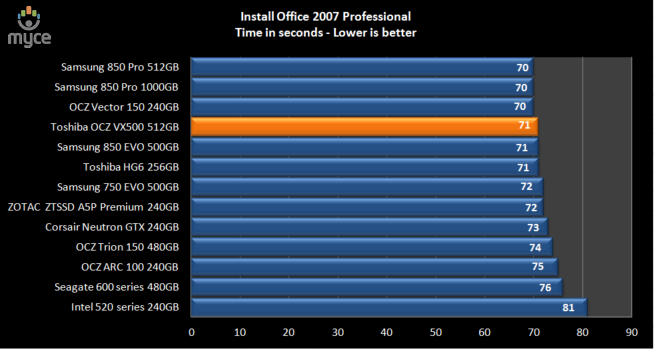
The Toshiba OCZ VX500 512GB SSD gave a excellent turn of
speed when installing this large office suite, and finished the test in fourth place.
Adobe Fireworks CS3
Adobe Fireworks CS3 is another popular package. Let's find
out how our drives coped with installing this application.
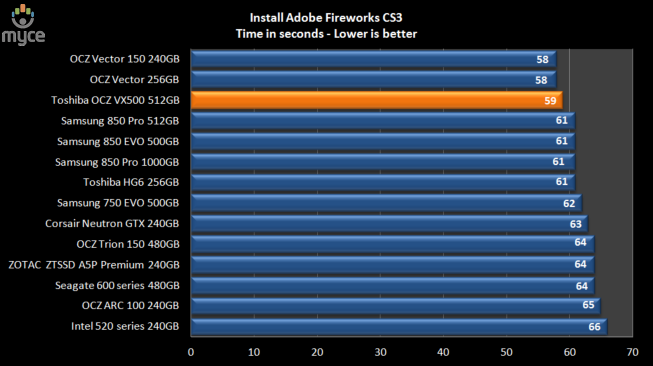
There isn’t a huge margin in the amount of time taken to
install this application on our modern SSDs. However the Toshiba OCZ VX500 512GB
SSD finishes this test in third place.
Summary
Our real world tests, though not scientific in nature, I
feel are more realistic than simply running benchmarks. What is clear from these
tests is that the Toshiba OCZ VX500 512GB SSD has excellent performance in the
real world.
Let’s check out application and game loading performance
on the next page of this article.....
These are quite simple tests, but very important to some
users of SSD drives.
We simply started an application or game, and measured the
time taken for the application or game to fully load and start.
Application loading times
Adobe Fireworks CS3
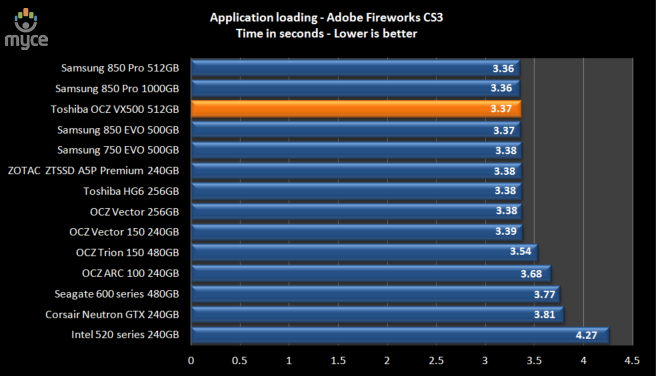
There is very little difference in tangible performance between
the modern SSDs. However, the Toshiba OCZ VX500 512GB SSD loads this large
application in 3.37 seconds, and finishes this test in third place.
Corel PaintShop Pro 12
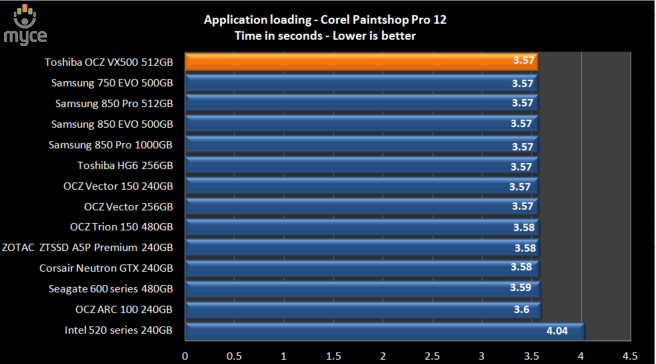
Again, I doubt anyone could tell difference from the fastest
to the slowest modern SATA 6Gbps SSD, as they are all very close.
Games loading times
FAR CRY 2
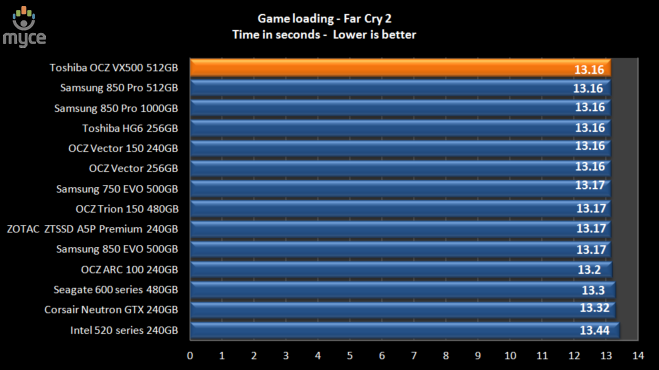
Once again the results are all very close, and I highly
doubt anyone could tell the difference between the fastest and slowest SSDs in
this test.
F.E.A.R. 2
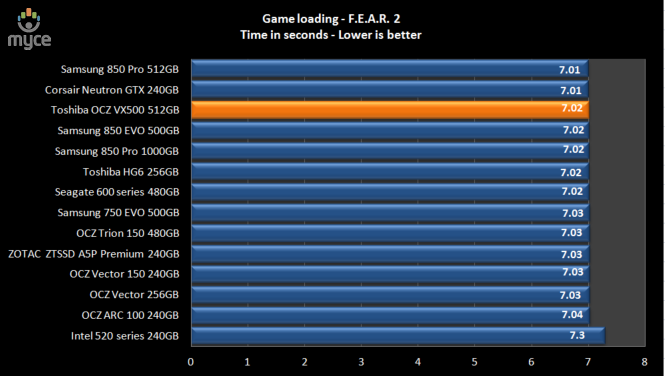
The Toshiba OCZ VX500 512GB SSD has performed very well.
Summary
The Toshiba OCZ VX500 has performed admirably.
Now let's head to the next page where we will see how the
Toshiba OCZ VX500 512GB SSD performs in PC Mark 8.....
PC Mark 8 - Storage Suite
Here at Myce.wiki, we only recently introduced PCMark Vantage
into our SSD testing. PCMark Vantage is a good test, but is now somewhat
outdated in the applications that it tests, even to the extent of including a
test trace on how Windows Vista booted. We could of course have opted for the
newer PCMark 7, but I personally had issues with the way it ran the HDD tests.
We have built quite a close relationship with FutureMark
software, the authors of the PCMark PC benchmarking software that we use in our
tests. I decided I would use PCMark Vantage as stopgap measure until the more
up-to-date PCMark 8 benchmarking suite became available. I'm pleased to say
that PCMark 8 is now available, and it gives me great pleasure to introduce you
all to the results obtained by this new 'real world' benchmarking suite.
I will describe the basic way that each test is carried out,
above the graph for each test.
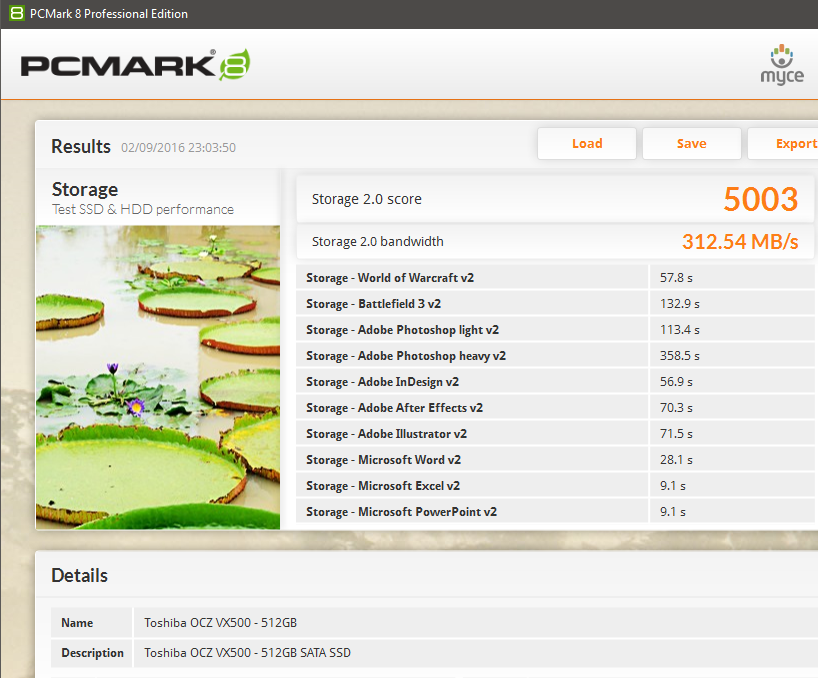
PC Mark 8 storage suite results
Toshiba OCZ VX500 512GB
Now let’s look at the individual PC Mark 8 HDD suite scores,
in the form of tables and graphs.
PC Mark 8 storage suite: World of Warcraft

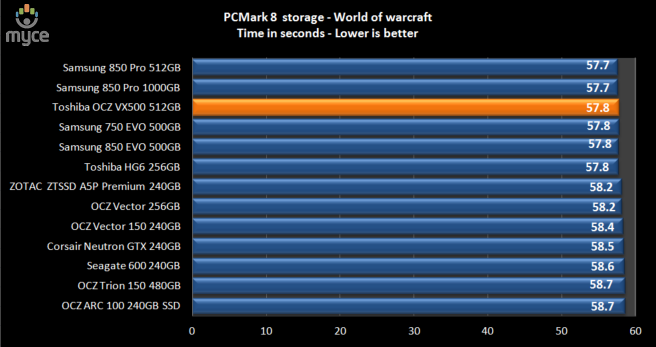
The first thing that is very noticeable is that all the
tested SSDs are remarkably close, performance wise, when loading this game.
PC Mark 8 storage suite: Battlefield 3
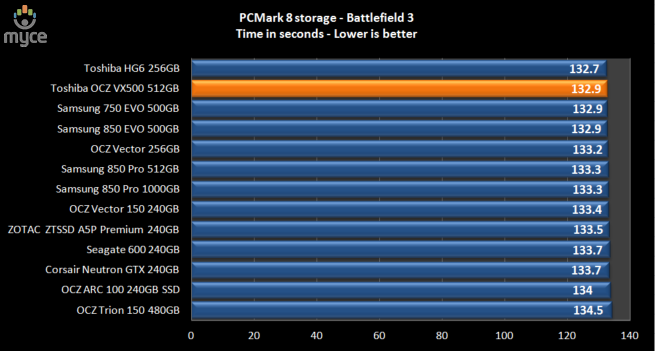
Once again, the results are very close between all the
competing SSDs.
PC Mark 8 storage suite: Adobe Photoshop light
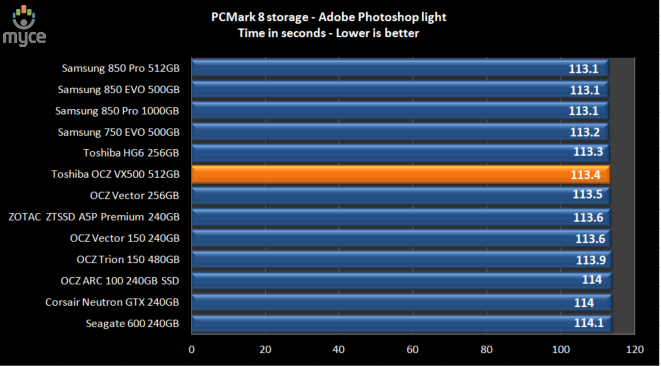
Yet again the results are all very close together.
PC Mark 8 storage suite: Adobe Photoshop heavy
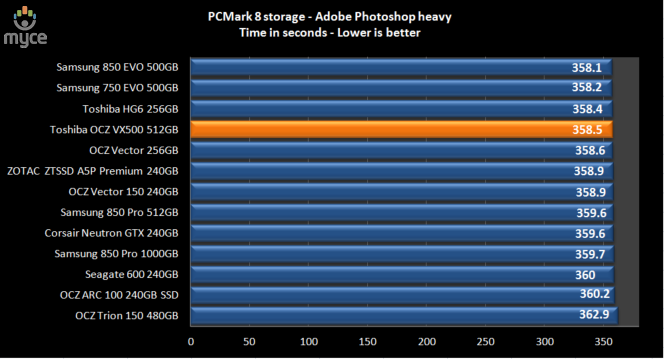
Again, there isn't a large difference between any of the
competing SSDs.
PC Mark 8 storage suite: Adobe InDesign

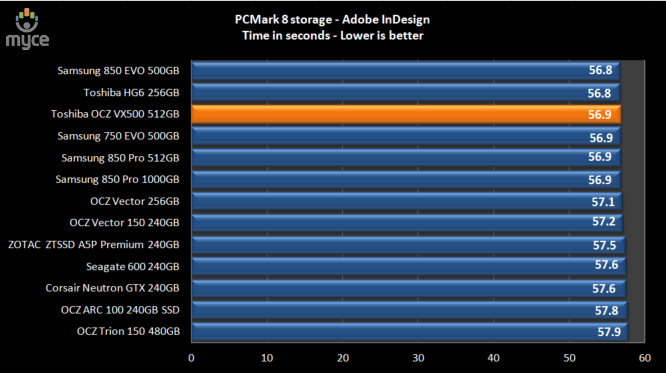
The SSDs with the higher writing performance head the table.
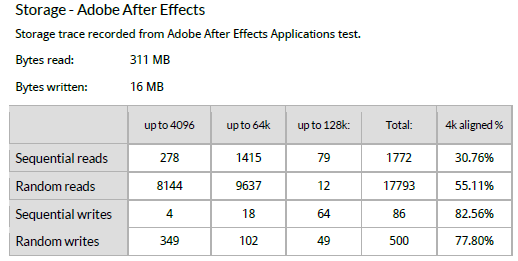
PC Mark 8 storage suite: Adobe After Effects
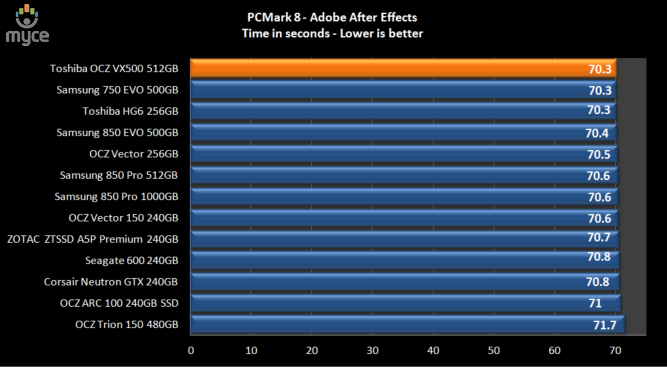
There is virtually no difference between the tested SSDs.
PC Mark 8 storage suite: Adobe Illustrator
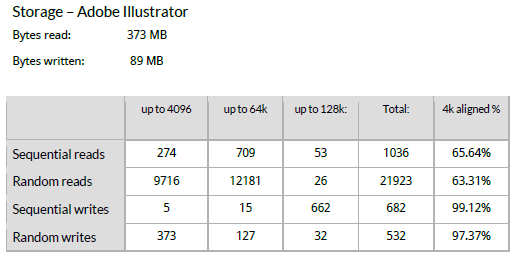
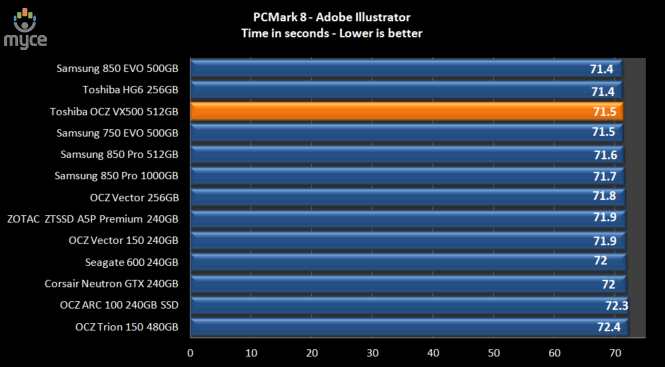
Once again, there is hardly any difference between the
tested SSDs.
PC Mark 8 storage suite: Microsoft Word
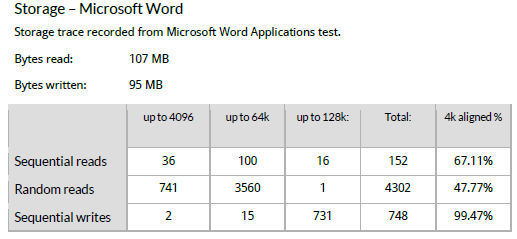
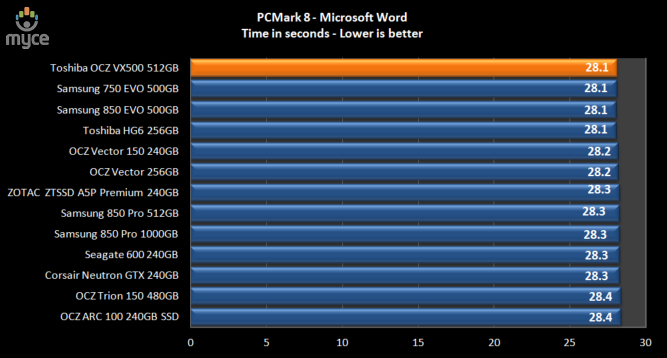
With only 0.3 seconds between the fastest and the slowest
SSD in this test, I would doubt anyone could tell the difference.
PC Mark 8 storage suite: Microsoft Excel
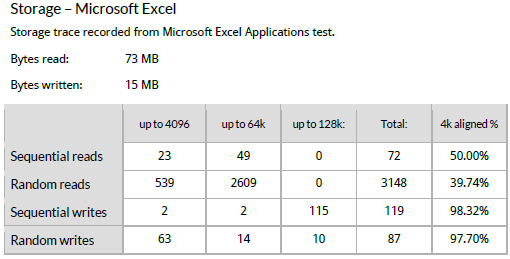
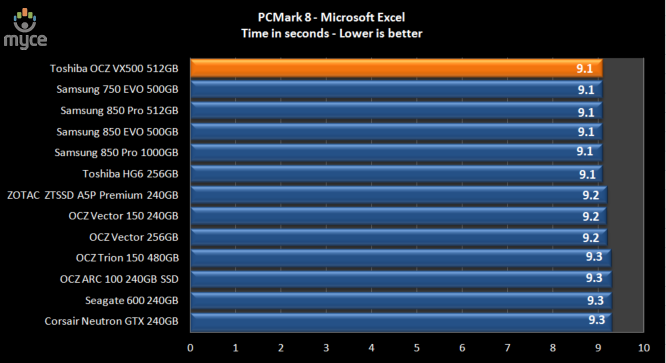
There is only 0.3 seconds between the slowest and the
fastest SSDs in this test.
PC Mark 8 storage suite: Microsoft PowerPoint
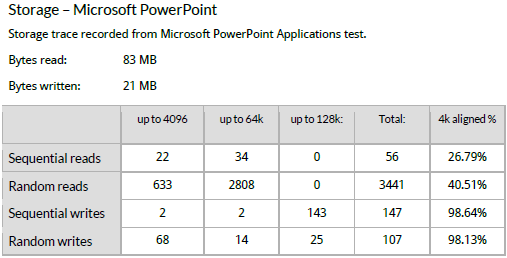
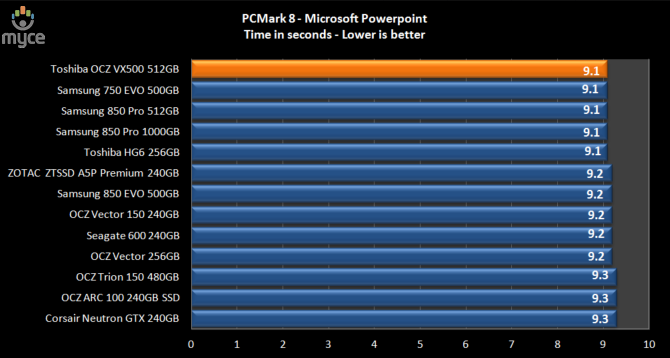
Once again, the results obtained from our test SSDs are
almost identical.
PC Mark 8 storage suite: Storage bandwidth
Storage bandwidth displays the amount of bandwidth available
from the storage device, when it is faced with requests for simultaneous reads
and writes.
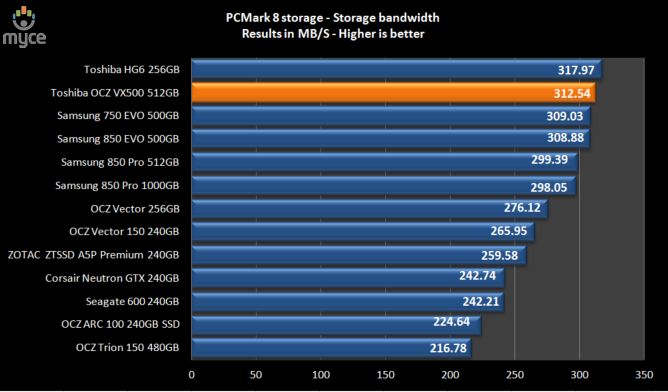
According to PC Mark 8, the Toshiba OCZ VX500 512GB has
312.54 MB/s of bandwidth.
PC Mark 8 storage suite: Overall Score
PC Mark 8 sums all the individual times taken to run each
storage benchmark, and then comes up with an overall score for each of the
tested SSDs.
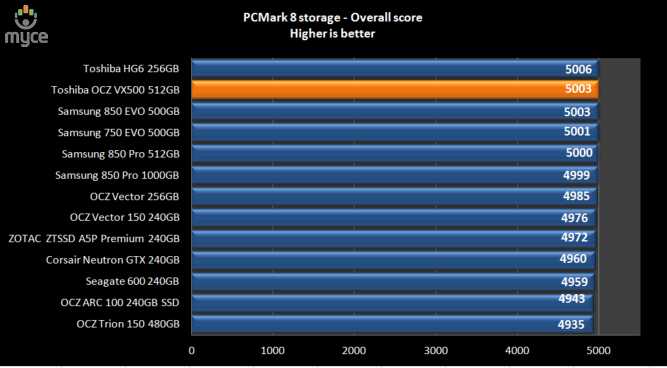
As we can see from the above graph, there isn't a large
difference between any of the tested SSDs, but the Toshiba OCZ VX500 512GB SSD
takes second spot in these tests.
Summary
You may well ask, if the scores are so close between the
tested SSDs, then what is the point of running PC Mark 8 storage benchmark?
Basically, most of these individual tests are very low
demand as far as storage is concerned. More or less all the traces are lightweight.
But hang on a minute, this is how real applications work, and I and many other
reviewers have been saying for years that when we have lightweight storage
traces, it becomes almost impossible to tell SSDs apart from a performance
perspective. We now have a tool that can demonstrate this to very good effect.
It's not until we start to push SSDs very hard that the
performance differences between SSDs start to become clearer, and for that we
need much heavier workloads, such as the tests run in the Myce Reality Suite.
PC Mark 8 is still very useful, as I'm quite sure that most of you will use at
least a couple of the applications used in these tests, and now you will be
able to compare one SSD to another.
Now let’s round off the performance tests with the Myce
Reality Suite on the next page.....
Myce Reality Suite revision 4.
NOTE: New in revision 4.
- Support for NVMe
- Support for SATA Express
- Support for PCIe
- Support for M.2.
So what is the Myce Reality storage test?
The Myce Reality Suite of tests is made from real everyday
applications and real data, there are no simulated tests, and everything is in
the real world. The only thing that's synthetic is that everything is automated
to make the tests fair, no matter which drive the tests are run on.
Recorded user sessions, by means of a script, are used to
launch the applications, load data, edit data, and then finally write that data
back to the target drive. The scripts do load the system much more than a human
could with these tests, as the scripts do not make mistakes, or pause to think
about what has to be done next.
Measurement system
The measuring system is part hardware and part software. The
hardware is a two part system comprising of a host PC and an external hardware
analyser which is proprietary, and runs a proprietary version of Linux with
special software.
The host PC is built around an Intel Core i7 2600 (Sandy
Bridge) CPU, and an Asrock Z68 Extreme 4 motherboard, with 8GB of 1600MHz DDR3
RAM. The interface between the host PC and the external measuring system uses a
proprietary PCIe2 x8 card, which is housed in the primary PCIe2 x16 slot on the
host PC. The analyser is calibrated before the start of the tests, and is
guaranteed to be accurate to within 0.03%.
Testing method.
Previously the test platform was Windows 7 Home Premium
64bit. The transition to Windows 8.1 Professional 64bit has now been made, and
at the same time a couple of new tests have been validated and introduced. This
has of course meant that I have had to retest a selected number of SSDs on the
new platform, and the results from SSDs that were old, or no longer available
in the test labs, have been discarded.
Building the tests and test image.
Once all the test data files and the scripts that run the
tests were complete, they were then copied to a single folder. I then fitted an
120GB SSD into the PC and did a clean install of Window 8.1 Professional x64.
The latest hardware drivers were installed and Windows update was run to
install any new updates that were available up to 24/11/2013. At this point the
applications that were to be used in the tests were installed and updated with
the latest patches.
The folder containing the application test data files and
scripts was then copied over to our fresh Windows 8.1 Professional 64bit SSD. A
drive snapshot was then taken of the complete SSD and the drive snapshot image
copied to an HDD for safe keeping.
The image is then simply restored to each of the SSDs on
test. After imaging the drive the partition is then realigned “on the fly” and the
free space is filled and then deleted to force TRIM. A 20 minute settling time
is allowed before the tests are run, then each of the 6 tests is run and the
results gathered. This process is repeated for each of the drives I am testing.
The test scenarios are as follows.
- Graphics content
- Video editing
- Audio import and compression
- Application multitasking
- Windows defender (full system drive scan)
- GRID 2 gaming test.
Let’s begin the tests.
Myce Reality Suite – Graphics content.
Using ACDSee Pro 3, 100 JPG pictures with an average size of
10MB are imported into the ACDSee library, and then 12 of these JPG files are
then selected for a batch process, of resize, compress the quality to 80%, and
finally write the edited pictures back to the drive. The test is approximately
78% read and 22% write, with an average queue depth of 1.98.
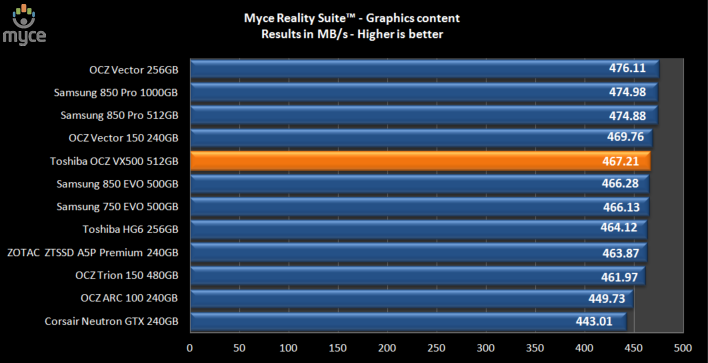
The Toshiba OCZ VX500 512GB performs well in this test, and
finishes in fifth place.
Myce Reality Suite – Video editing.
Using Vegas Pro, a 14GB HD MPEG2 video stream is loaded into
the editor, from which 2 segments are then cut and pasted into new segments. There
is a lot of disc caching going on in this test, which is approximately 55% read
and 45% write, with an average queue depth of 1.89.
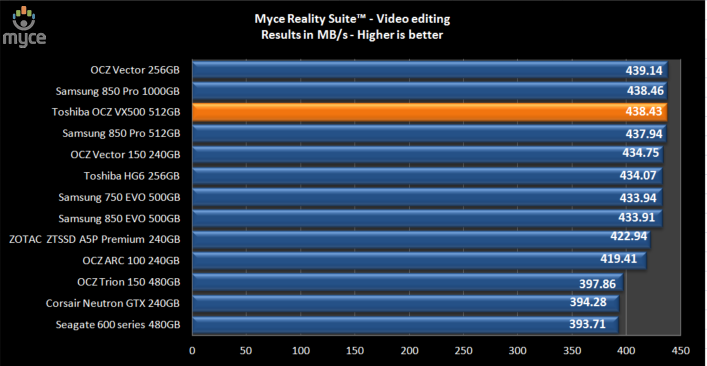
This time the Toshiba OCZ VX500 512GB SSD finishes in third
spot
Myce Reality Suite – Audio import and compression.
Using Sony Sound Forge 10, a batch process is run consisting
of importing 30 24bit (192000 Hz sample rate) .wav files, and 100 16bit (44100
Hz sample rate) .wav files which are converted to MP3 audio files with a bit rate
of 128kbps, and the MP3s are then written back to the drive. The test is
approximately 72% read and 28% write, with an average queue depth of 2.62.
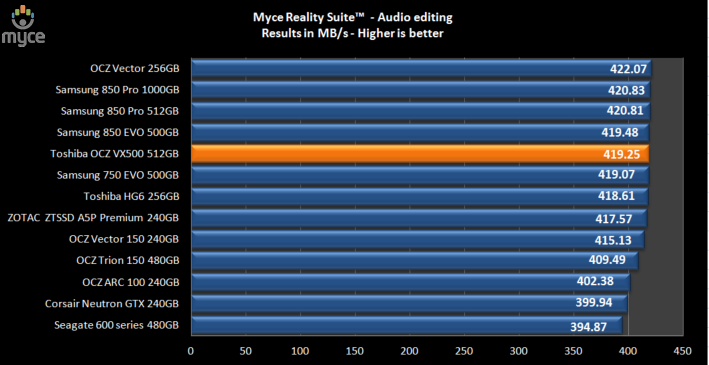
This time the Toshiba OCZ VX500 512GB takes fifth place.
Myce Reality Suite – Application multitasking.
For this test I used several popular applications, Microsoft
Word 2007, Microsoft Access 2007, Microsoft Excel 2007, Microsoft Outlook 2007,
Adobe reader, Adobe Photoshop CS3, uTorrent, Windows media player, and Internet
Explorer 9.
This session runs for approximately 12 minutes. The test is
started by downloading a Linux distribution via uTorrent, Windows media player
is then opened, and a 1080p video file is opened and played for the duration of
the test. Microsoft Outlook is opened and any new emails are received, read,
then replied too, a document in Adobe reader is opened and scrolled from start
to finish, 3 Microsoft Word documents with graphics content are opened, browsed
and some sections of the documents are copied and pasted into a forth document
and then saved back to the drive. The same applies to Microsoft Access and
Excel. 100 MP3 files are imported into Windows media library. Six JPG images
are loaded into Adobe Photoshop and some minor editing is done and the files
saved back to the drive.
Finally, Internet Explorer 11 is opened with 10 tabs, and
the contents of the 10 tabs refreshed, and browsed while the other applications
are busy in the background.
I would describe the multitasking pattern as moderate to
heavy.
During this test there is approximately 85% reading and 15%
writing, with an average queue depth of 6.73.
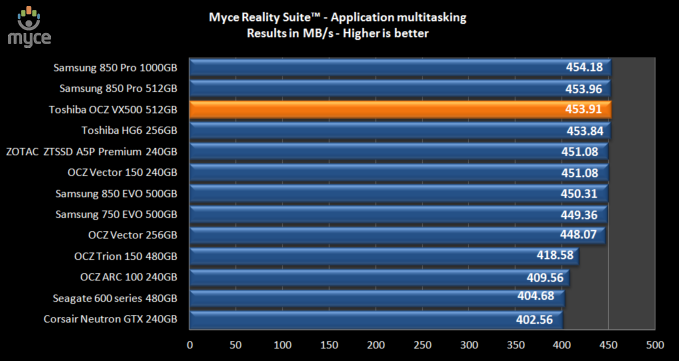
With the higher queue depths in this test the Toshiba OCZ
VX500 512GB SSD is able to show what it can really do, when pushed hard, and performs
well, finishing in third spot.
Windows Defender (full system drive scan)
A full system drive scan is selected on drive C: and then
run. The test is approximately 99% reading and 1% writing, with an average
queue depth of 1.2.
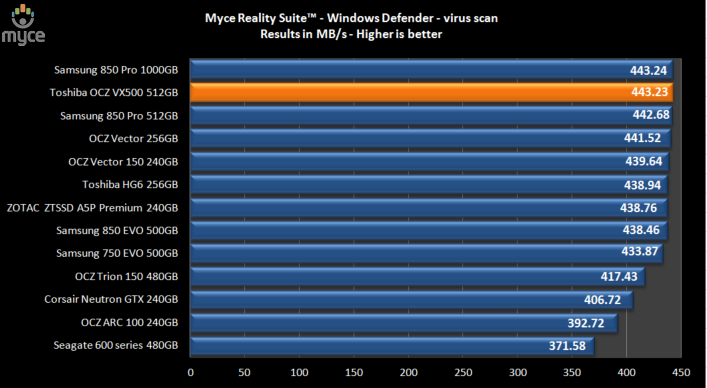
The Toshiba OCZ VX500 512GB SSD has performed extremely well
in this test, finishing in second place.
GRID 2 gaming test
The game is launched and then a pre-saved level is loaded.
The test runs until the loaded level starts. The test is approximately 98% reading
and 2% writing, with an average queue depth of 1.
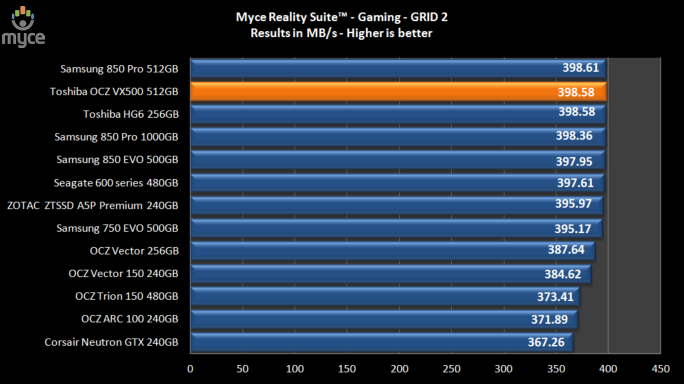
The Toshiba OCZ VX500 512GB SSD has performed very well, and
takes second spot.
Summary
I firmly believe that the Myce Reality Suite gives a very
good overall picture of how a drive can perform in the real world and, in this
case, the Toshiba OCZ VX500 512GB SSD is clearly a very capable performer.
Now let’s head to the next page, and see how well the
drive performs after heavy use....
Filling up the SSD with data
For obvious reasons, when an SSD is tested, the drive is
always tested as a spare drive, and is generally always empty (no data on the
drive) during the synthetic benchmarks. There is no other way of having a level
playing field for all the SSDs under test. This of course changes during the
real world tests we conduct here at Myce.wiki.
Real users of course don't buy an SSD for it to remain
empty, and how full the SSD will eventually become varies from one user to the
next. What I thought would be useful is to run tests on the SSDs with real data
on the drives, and at different levels regarding how full the drive is.
Myce Sustainable Performance Test
Over the last few months I have been studying countless
analyzer traces of real computing workloads, and also developing a test that
would accurately emulate and measure how performance is sustained over a period
of time. For obvious reasons, it is not possible to test an SSD review sample
over several months before publishing a review. The solution was to condense
this down to a manageable test, that doesn't take too long to run.
I will make it clear right from the outset that this is not
a torture test. Bringing any SSD to its knees is not helpful in the least, as I
for one would not use any SSD that had slowed down to crawl, just to prove a
point. The Myce Sustainable Performance test, I believe is a tough, but
sensible test pattern to use for measuring how an SSD will be behave once it's pushed
hard over a period of time.
The test pattern is "workstation" based, and
closely emulates a typical video or graphics workstation environment. The
results are measured using the same hardware I use for the Myce Reality Suite
tests, however, the test data and measuring system use a different method.
With the drive filled to 80% of its capacity, I already have
an SSD with a lot of data on it. Adding to the data that is already there, the
"Sustainable Performance" test data is added. This test data is
approximately 20GB is size, so once this is added the SSD is pretty full.
The test is then run for a period of 20 minutes. 60
performance measurements are taken for every minute of the test, and an average
performance figure is generated after each minute. At the end of the test I
have 20 performance measurements which are then used to generate the graph
below.
The faster SSDs will obviously sustain more writes then the
slower SSDs. For the fastest SSD in this test, the test pattern generated 146GB
of writes, and 193GB of data was read from the SSD during the test.
When reading the graph, you should not pay too much
attention to which drive is the fastest, but instead look at the sustainable
performance curve of each SSD, as this is what this test is all about.
For the SSD that I am reviewing, I will also add a second
graph which looks at the result in more detail.
So let's look at the results.
Sustainable
Performance test
Detailed results for the
review drive
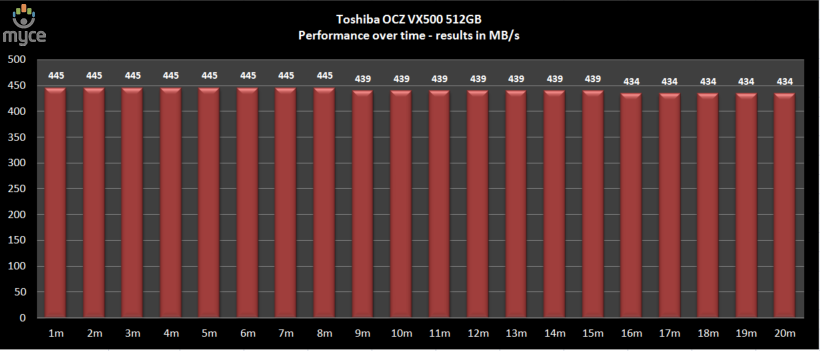
There is evidence of a slight slowdown in the performance of
the Toshiba OCZ VX500 SSD. It doesn’t slow down by a huge amount; in fact it is
the region of only 11 MB/s.
Let’s head to the next page for an in depth analysis of
power consumption and efficiency...........
Power requirements and efficiency
Storage device manufacturers by law must provide power
consumption specifications with their storage device products. Quite often
these specifications are quite vague, and rarely, if ever, publish the power
efficiency of their storage devices with regard to how much work a storage
device can do for a given amount of energy consumed. In this article we will
disclose with unprecedented precision, the energy efficiency of some popular
storage devices.
Myce has now secured a piece of 'state of the art' test
equipment, which takes a sample every four micro-seconds, that I will be using
to measure the power consumption of consumer grade SSDs and HDDs. I'm so very proud
to be able to announce that Myce.wiki, in partnership with Quarch Technology, now aims to bring our
readers the most comprehensive, and accurate, power consumption tests ever
carried out on consumer grade storage devices, to be found anywhere on the
Internet.
Myce’s Power Testing will be carried out using
Quarch Technology products. More specifically we are privileged that Quarch has
allowed us to use their latest XLC Programmable Power Module (‘XLC PPM’) and we
would also like to take this opportunity to give a huge 'thank you' to Quarch
for providing this equipment. The XLC PPM is specifically designed for testing
low power sleep states on modern SSDs and as such has a remarkably accurate low
level current measurement, down to 100μA (micro amps, or millionths of an
amp). Please click here for details.
Quarch Technology is a world leader in the
supply of testing solutions for the data storage industry and if you would like
any further information please visit their website by clicking here.
Let's take a closer look at the Quarch XLC PPM box in a bit
more detail.
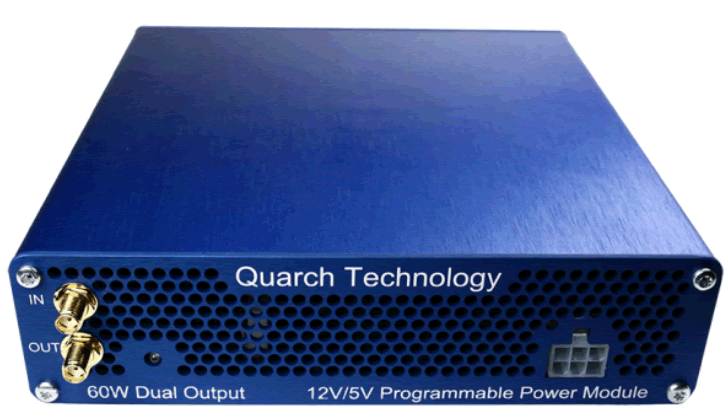
Quarch Technology XLC
PPM
The Quarch Technology XLC PPM is able to provide two power
supply rails to the target SSD. A 12V (volt) rail is required for PCIe based
SSDs, and also for SATA HDDs, SATA HDDs also require the 5V rail to function.
All the power requirements of a SATA SSD are handled by the 5V rail.
As already mentioned, PCIe SSDs also require a 12V rail, but
the second rail is 3.3V rather than the 5V rail used by SATA SSDs. Generally,
most of the PCIe based SSDs that I have tested, which admittedly isn't a huge
number at the moment, draw their power from the 12V rail, the exception being
the Intel 750 NVMe SSD which uses both the 12V and 3.3V rails.
The Quarch Technology XLC PPM can switch between 5V and 3.3V
on the secondary power output channel as required. So for SATA based SSDs it is
set to 5V, and for PCIe based SSDs, it is set to 3.3V.
On the left hand side of the Quarch XLC PPM, you can see
trigger in and out sockets. These are used for external triggering of the XLC
PPM. For now, I will not be using this feature.
On the right of the Quarch XLC PPM, you can see the socket
where the main power injection lead connects.
On the rear of the box (not shown) you will find a USB 2
socket, a power socket (to supply power to the unit) and a Torridon connection
interface, for connecting to external equipment.
My setup.
Although the Quarch Technology XLC PPM can be used on a
single PC, which can act both as host and measurement system, I will be using
two PCs to run the tests. One PC will handle the measurements, and the second
PC will act both as a host for the target SSD, and will also be used to load
the target SSD with data. This will allow me to do some pretty fancy power
consumption tests.
I will first show the type of workload being used to load
the SSD during the power consumption test. I will then present the power
consumption graph, and power consumption statistics of the SSD.
I will display the results in the form of bar graphs, at the
end of each test carried out in this article, so one can compare the results
obtained on all the SSDs featured in this article.
I will use the following IOMeter test patterns to load the
SSD or HDD.
- 4K random read and write at a queue depth of 1 (to emulate
a lightweight consumer workload). - 4K random read and write at a queue depth of 4 (to emulate
a medium workload). - 4K random read and write at a queue depth of 32 (to
emulate a heavy workload). - 512K sequential read (to emulate reading a sequential file
from the storage device). - 512K sequential write (to emulate writing a sequential
file to the storage device).
I will also show graphs that will display how much work an
SSD can do for a given amount of energy usage. To do this I will use the
IOMeter results obtained in the tests, and then use a simple calculation to
work out how many IOPS a drive can generate per Watt of power consumed.
The calculation used for the results is IOPS divided by
the amount of power consumed in Watts.
Example: The Intel 750 NVMe 1.2TB SSD obtained an IOPS
result of 219,716.47 IOPS for 4K random read at a queue depth of 32, and
consumed 5097mW (5.097 Watts). Divide the IOPS by 5.097 and this shows that the
Intel 750 NVMe SSD can generate 43,107.01 IOPS per Watt of energy consumed for
this particular workload.
For all these tests IOMeter was used to generate the test
patterns and workload for the target SSD. The tests were run for a duration of
approximately 90 seconds.
I will also run a couple of additional tests.
- Power consumption when the drive is idle.
- The maximum power required to initialise a drive (this is
for information only).
All results in this article are derived from the 'average
power consumption' and are displayed in milliwatts (mW), unless otherwise
stated.
Power requirements for a lightweight consumer workload. - 4K random read
and write QD1
A typical lightweight consumer workload will generally be at
very low queue depths. Typically at a queue depth of one or less. I'm testing
random data at a block size of 4 Kilobytes, as this block size of small random
files is generally accepted as the most frequently occurring in the consumer
environment.
I will show the chart generated by the Quarch XLC PPM for
the drive that I have tested. I will then show the results in the form of bar
graphs, so one can easily compare with other recently tested SSDs.
There will actually be two bar graphs for each test. The
first graph will show the average power consumption during the test run. The
second graph, which is much more important, will indicate the power efficiency
of the storage device, showing how much work the storage device can do for each
Watt of energy it consumes.
4K Random Read - queue depth 1
Toshiba OCZ VX500 512GB
– 4K random read QD1
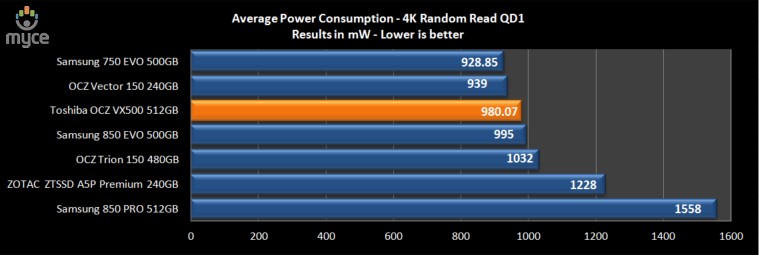
The Samsung 750 EVO consumes the least amount of power, with
the Toshiba OCZ VX500 512GB consuming 980.07 mW, but let’s see how this
translates to power efficiency in the graph below.
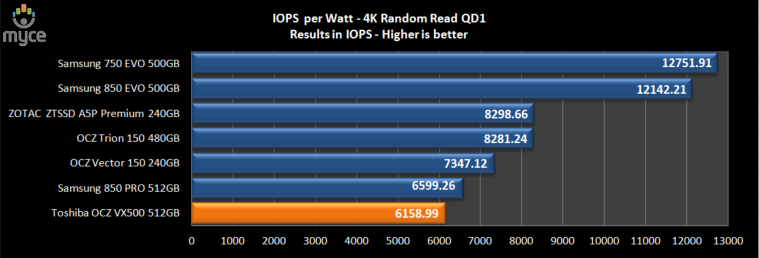
The Toshiba OCZ VX500 512GB is the least power efficient SSD
in this test, managing 6158.99 IOPS per Watt.
4K Random Write - queue depth 1
Toshiba OCZ VX500 512GB
– 4K random write QD1
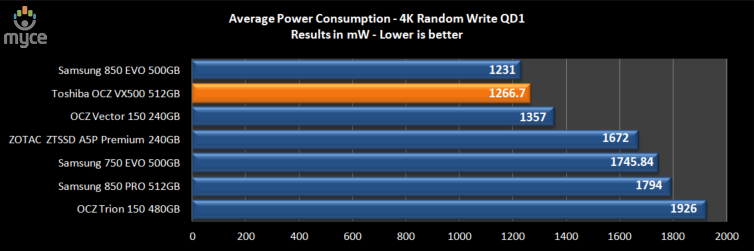
The Toshiba OCZ VX500 512GB has an average power consumption
of 1266.7 mW, but let’s see how this translates to power efficiency.
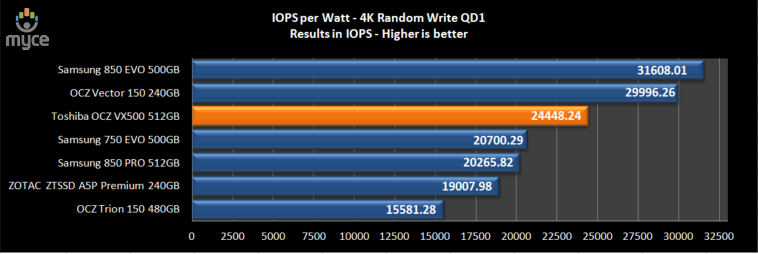
The Toshiba OCZ VX500 is very power efficient in this test,
managing 24448.24 IOPS per Watt.
Power requirements for a medium weight consumer workload. - 4K random read
and write QD4
A typical medium weight consumer workload will generally be
at a queue depth of four or lower. This workload would typically involve some
multitasking, with perhaps two or three applications running, and processing
data simultaneously. I'm testing random data at a block size of 4 Kilobytes,
as this block size of small random files is generally accepted as the most
frequently occurring in the consumer environment.
I will show the charts generated by the Quarch XLC PPM, for
the drive that I have tested. I will then show the results in the form of bar
graphs, so one can easily compare with other recently tested SSDs.
There will actually be two bar graphs for each test. The
first graph will show the average power consumption during the test run. The
second graph, which is much more important, will indicate the power efficiency
of the storage device, showing how much work the storage device can do for each
Watt of energy it consumes.
4K Random Read - queue depth 4
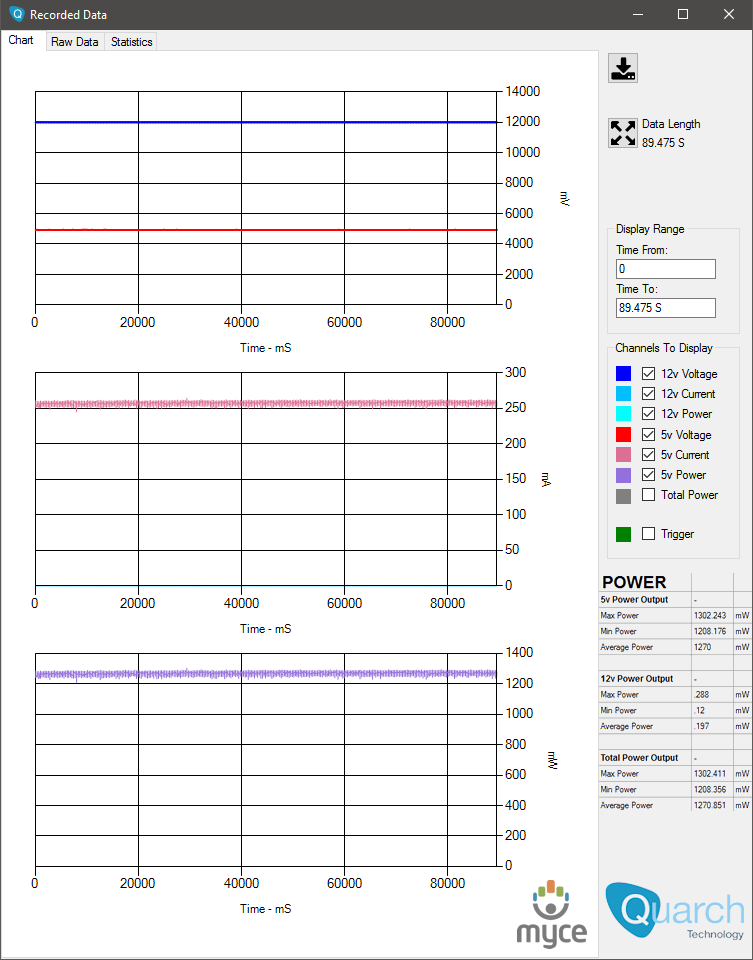
Toshiba OCZ VX500 512GB
– 4K random read QD4
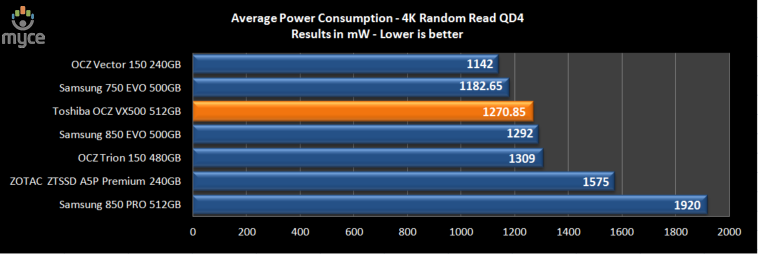
In this test the Toshiba OCZ VX500 is consuming an average
of 1270.85 mW, but again let’s see how this translates to the drive's power
efficiency in the graph below.
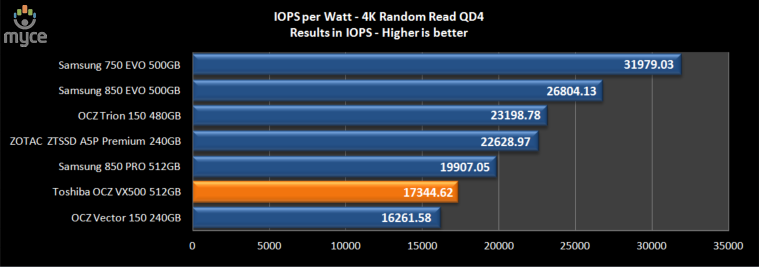
The Toshiba OCZ VX500 512GB SSD isn’t very power efficient in
this test, finishing in sixth place.
4K Random Write - queue depth 4
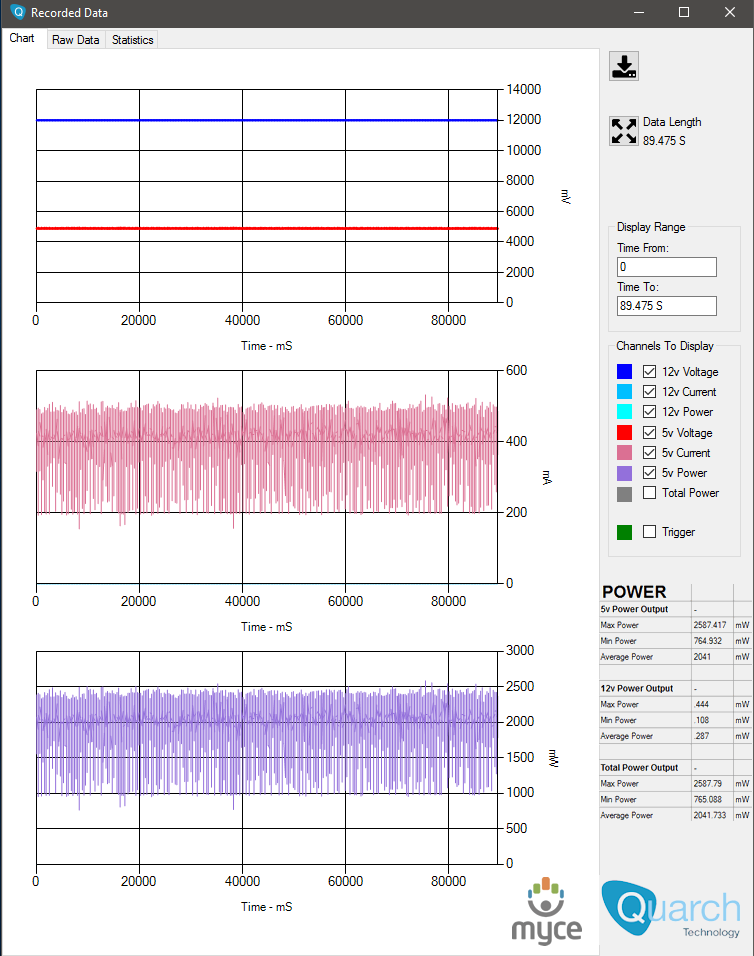
Toshiba OCZ VX500 512GB
– 4K random write QD4
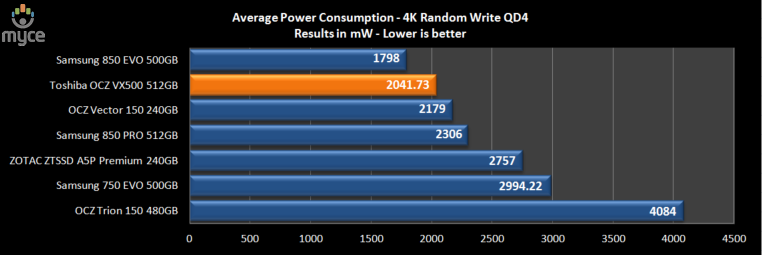
This time the Toshiba OCZ VX500 512GB has an average power
consumption of 2041.73 mW of energy.
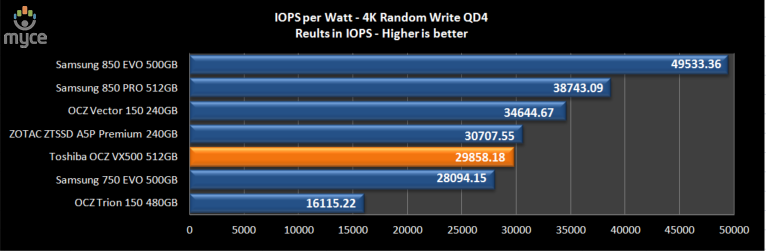
Here the Toshiba OCZ VX500 512GB SSD does well, managing
29858.18 IOPS for each Watt of energy consumed.
Power requirements for a heavyweight consumer workload. - 4K random read
and write QD32
Whilst this workload is unlikely arise for the casual
consumer PC user, it could well appear in a semi-professional consumer
environment, such as in a graphics workstation. This workload would usually
involve heavy multitasking, and having several processes running concurrently
that require constant access to small files located on the storage device for
input or output.
I'm testing random data at a block size of 4 Kilobytes, as
this block size of small random files is generally accepted as the most
frequently occurring in the consumer environment.
I will show the chart generated by the Quarch XLC PPM, for
the drive that I have tested. I will then show the results in the form of bar graphs,
so one can easily compare with other recently tested SSDs.
There will actually be two bar graphs for each test. The
first graph will show the average power consumption during the test run. The
second graph, which is much more important, will indicate the power efficiency
of the storage device, showing how much work the storage device can do for each
Watt of energy it consumes.
4K Random Read - queue depth 32
Toshiba OCZ VX500 512GB
– 4K random read QD32
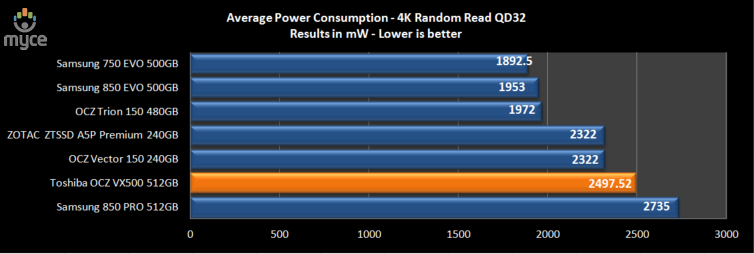
The Toshiba OCZ VX500 512GB SSD has an average power
consumption of 2497.52 mW.
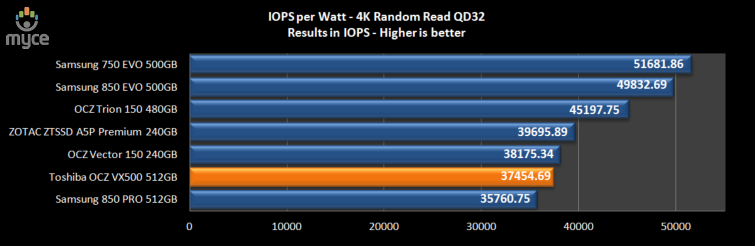
The Toshiba OCZ VX500 512GB is very power efficient,
managing a very good 37454.69 IOPS per Watt of energy consumed.
4K Random Write - queue depth 32
Toshiba OCZ VX500 512GB
– 4K random write QD32
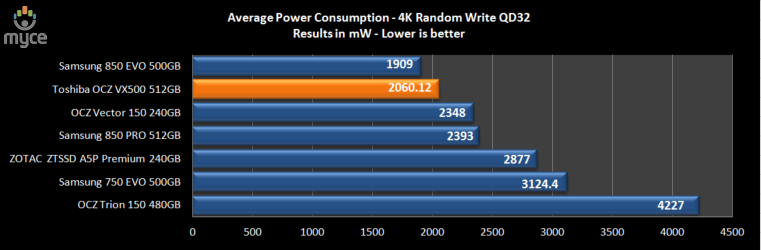
The Toshiba OCZ VX500 512GB SSD has an average power
consumption of 2060.12 mW in this test.
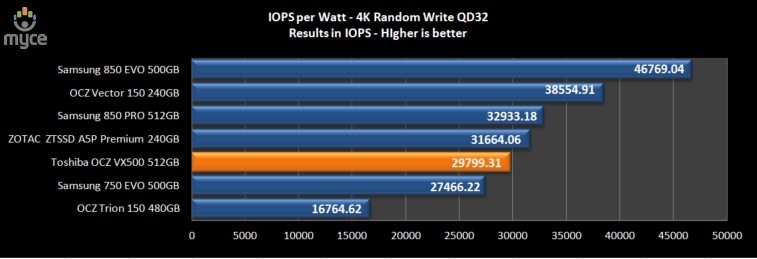
This translates to the Toshiba OCZ VX500 512GB managing a
credible 29799.31 IOPS per Watt of energy consumed.
Power requirements of a storage device when reading and writing sequential
data
Not all of a consumer workload is based around the reading
and writing of small random files. Many files are sequential in nature, and can
vary in size from a few Kilobytes to several Gigabytes, so your storage device
will spend a lot of time reading and writing sequential data.
I'm testing sequential data at a block size of 512
Kilobytes.
There will actually be two bar graphs for each test. The
first graph will show the average power consumption during the test run. The
second graph, which is much more important, will indicate the power efficiency
of the storage device, showing how much work the storage device can do for each
Watt of energy it consumes.
512KB Sequential read
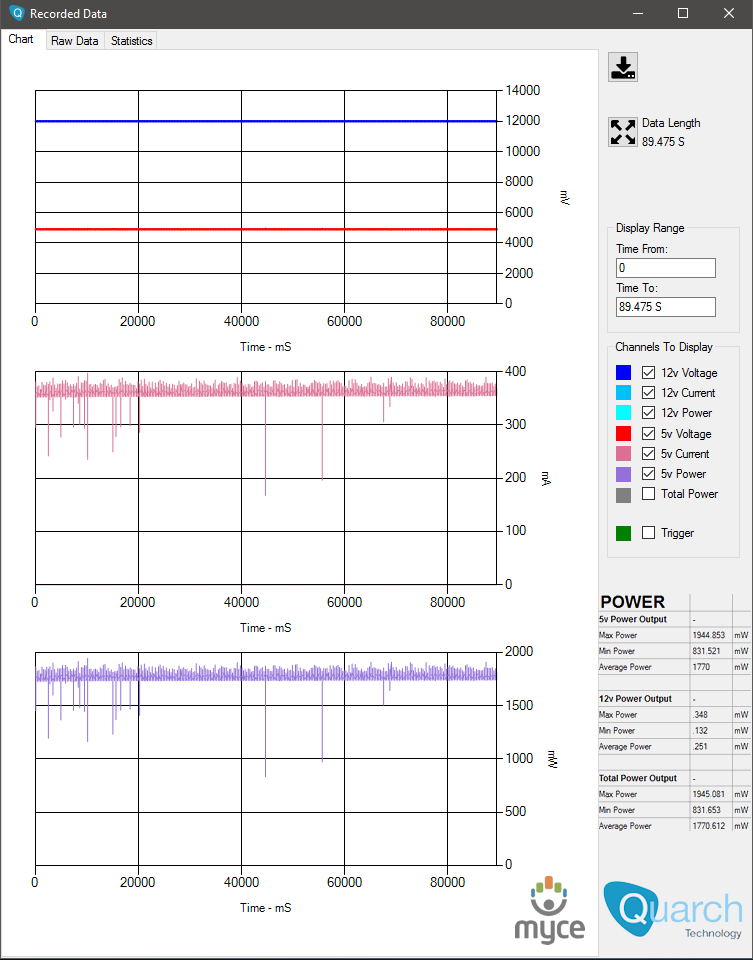
Toshiba OCZ VX500 512GB
– Sequential read
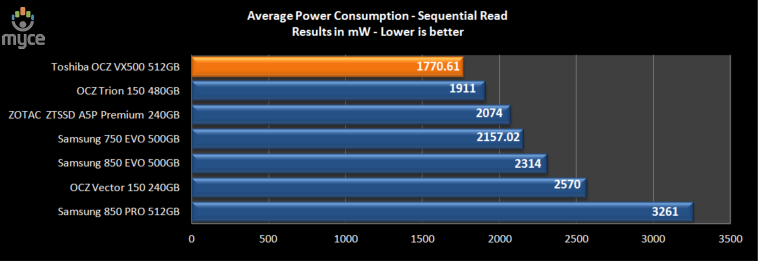
The Toshiba OCZ VX500 512GB SSD has an average power
consumption of 1770.61 mW during this test, but let’s see how this translates
into its energy efficiency.
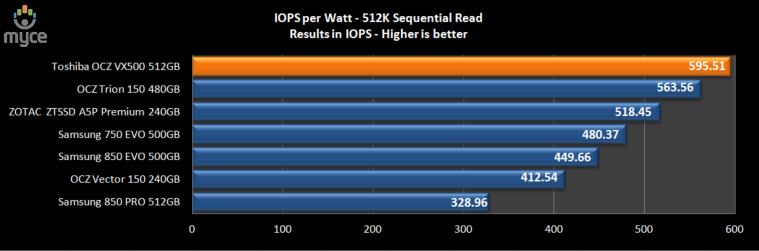
The Toshiba OCZ VX500 512GB SSD is the most energy efficient
SSD in this test, managing an impressive 595.51 IOPS for each Watt of energy it
consumes.
512KB Sequential write
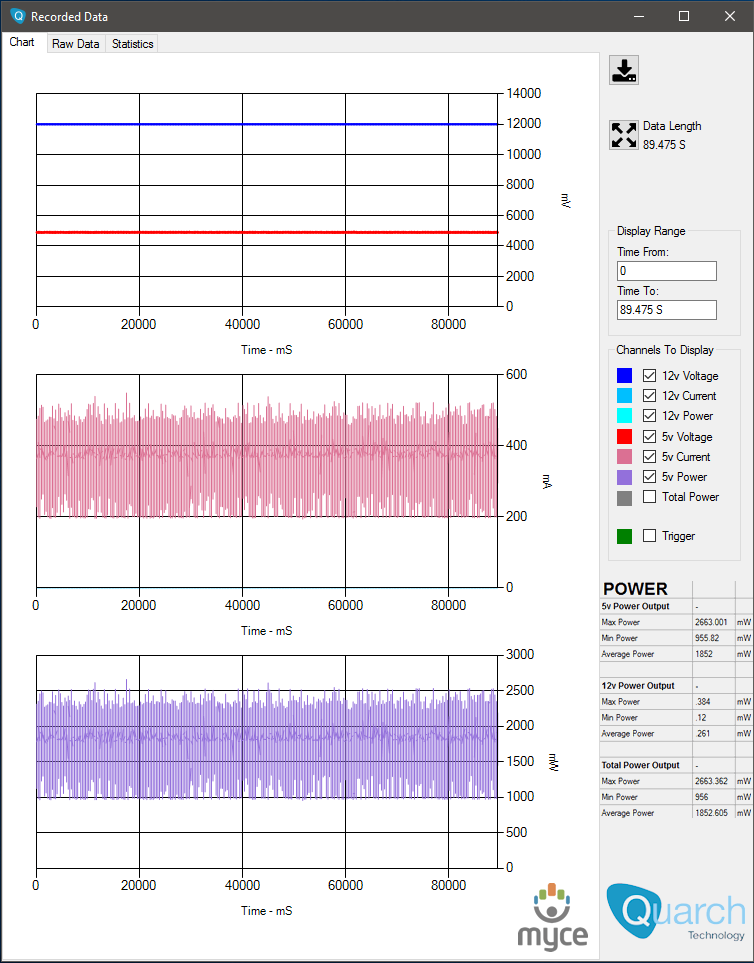
Toshiba OCZ VX500 512GB
– Sequential write
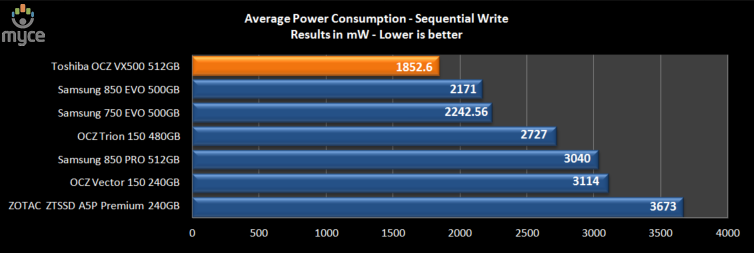
The Toshiba OCZ VX500 512GB SSD has an average power
consumption of 1852.6 mW during this test.
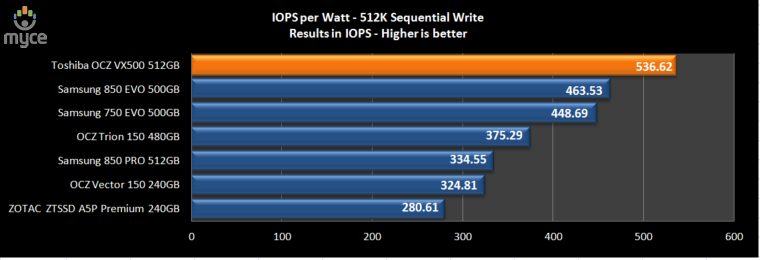
Once again, the Toshiba OCZ VX500 512GB SSD is the most
power efficient, managing a extremely impressive 536.62 IOPS per Watt.
Power requirements of storage devices when they are idle and doing no work
at all
The practical reality relating to power consumption is that
it can be quite erratic and sometimes unpredictable. Some of us will invest in
the most powerful PC we can afford, only to find that the PC can spend quite a
lot of time running and doing absolutely nothing. Storage devices are no
different.
Often we can be sitting idly pondering what to do next, or
perhaps browsing the Internet. When we arrive at a page that interests us, we
will read it, and that can take a fair amount of time to complete. During this
period the storage device will most likely be idle, but still consuming energy.
In this test, I'm measuring how much energy the storage
device consumes when doing no work at all.
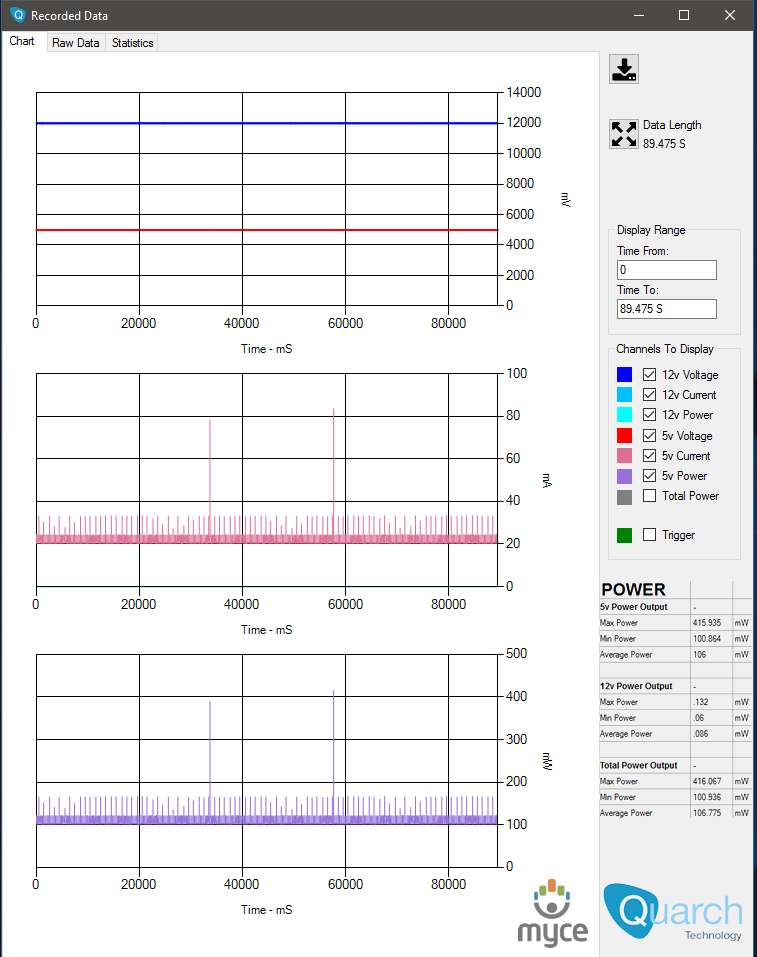
Toshiba OCZ VX500 512GB
– Drive idle
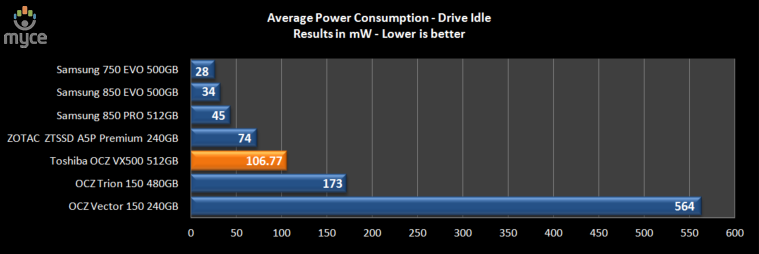
The Toshiba OCZ VX500 512GB SSD consumes very little energy
when doing no work at all. It isn’t quite as efficient as the two Samsung SSDs
or the ZOTAC, but nonetheless, 106.77 mW when idle is still an excellent
result.
I will now show a couple of additional tests which are for
information only.
Power requirements to initialise a storage device.
This test is for information and interest only, and in these
results we're looking at the maximum power consumption figure during
initialisation of each drive, rather than the average power consumption for
each device.
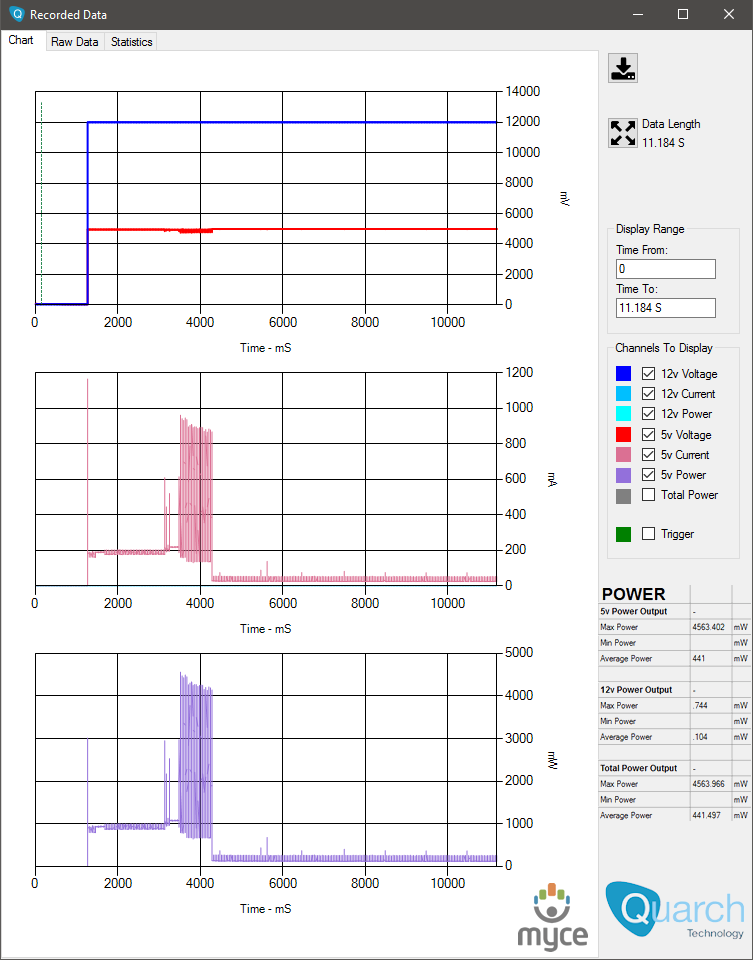
Toshiba OCZ VX500 512GB
SSD – Power up maximum power requirements.
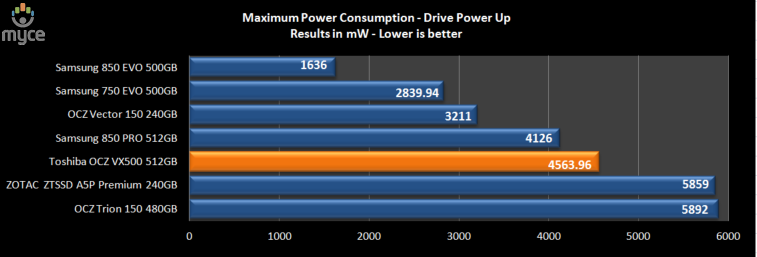
The Toshiba OCZ VX500 512GB requires 4563.96 mW of power to
kick it into life. This test is for information only.
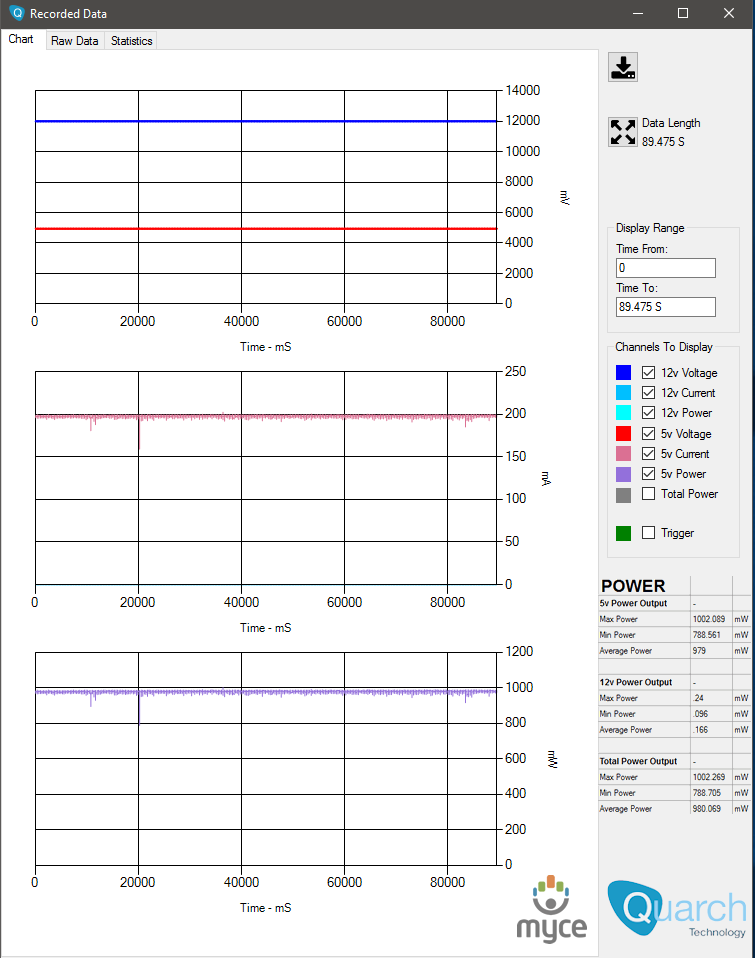
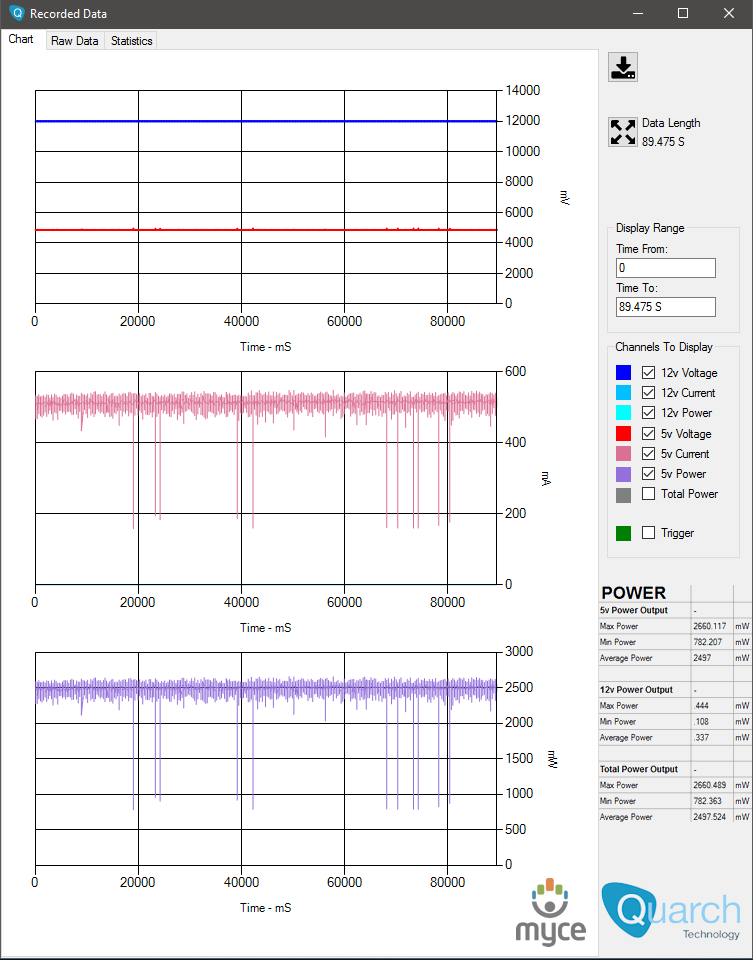
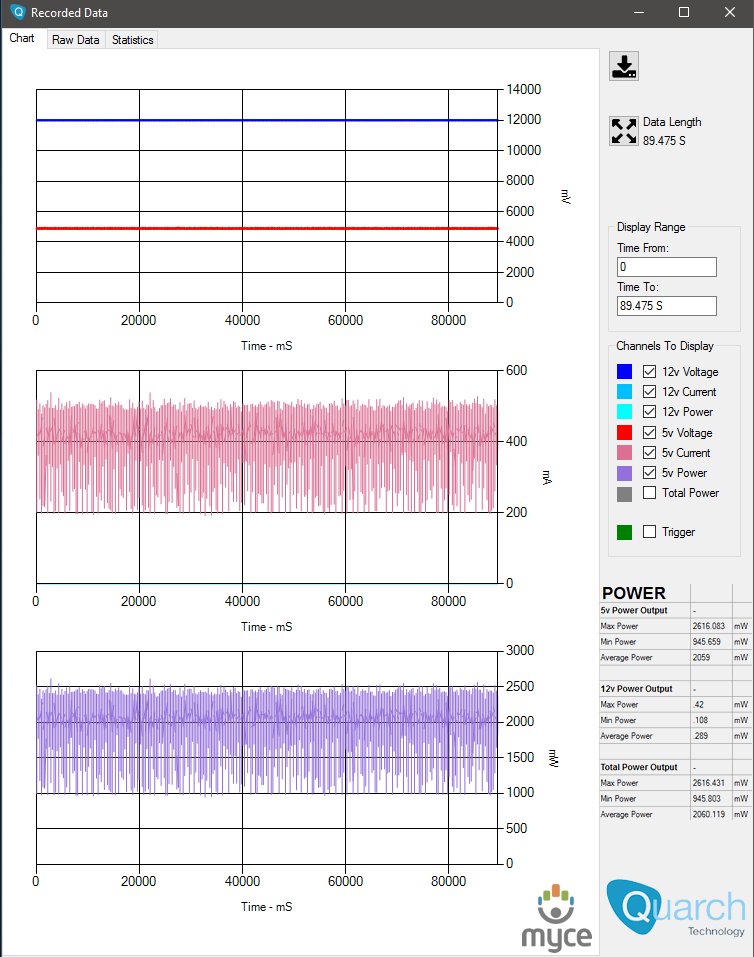
Power requirement trace of an SSD booting Windows 10, in real time.
This test is for interest only, and shows the power
requirements of the review SSD booting Windows 10 to the desktop.
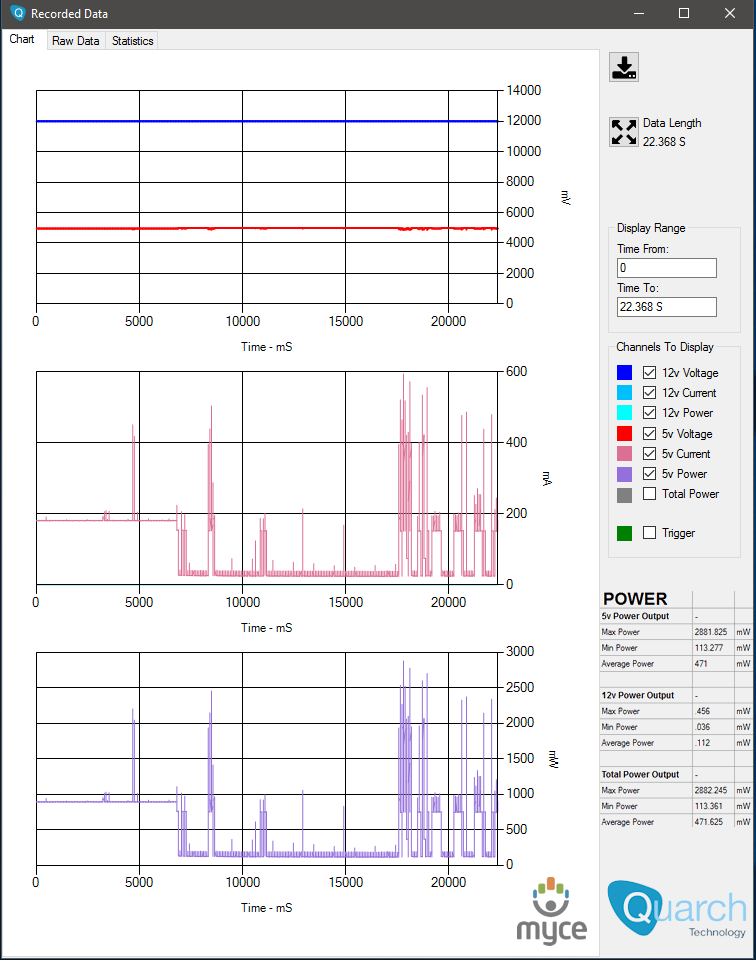
Toshiba OCZ VX500 512GB
SSD – Real time trace of the drive booting Windows 10 to the desktop.
Summary
The power efficiency of the Toshiba OCZ VX500 512GB SSD is a
mixed bag. It’s very energy efficient when reading and writing sequential data, but
when reading and writing random data, its energy efficiency is not the best in
class.
When the Toshiba OCZ VX500 512GB SSD is doing no work at
all, it is a very energy efficient SSD, consuming only 106.77 mW of energy when
idle.
This concludes our review. To read the final thoughts and
conclusion, click the link below....
Final thoughts and the conclusion
User experience
A modern operating system such as Windows 10 rarely does one
thing at time; it processes hundreds of threads at once. Just take a look at
the processes and services that are running in task manager for an idea of how
much is going on, even with the PC idling at the desktop. When you start
running applications on top of this, the workload increases in line with the number
and type of applications you are running. It’s also fair to say that many of
these processes are already loaded into system RAM, but many are also loaded into
and unloaded from RAM to the system drive as and when they are required.
If we look at the 4 basic requirements for a really fast
SSD, they are as follows.
- Small file threaded performance needs to be high.
- Small random file performance needs to be high.
- Sequential read and write speeds need to be high.
- Fast access times.
The Toshiba OCZ VX500 512GB SSD series SSD has all of these attributes,
and feels very snappy in use as a system drive.
Stability
I have only had the Toshiba OCZ VX500 512GB SSD for a few
weeks, so it’s not possible to comment on the drive's long term reliability.
What I can say though is that the Toshiba OCZ VX500 512GB SSD hasn't caused any
stability problems during the test period.
The Toshiba OCZ VX500 512GB SSD is as “plug n play” as it
gets. There are no special tweaks needed other than simply making sure that
AHCI SATA mode is enabled in the system UEFI (BIOS), and installing the latest
Intel RST SATA drivers, if you want to get the best performance and
compatibility out of this SSD.
Conclusion:
Let us summarise the most important positive and negative
points below:
Positive:
- Silky smooth operation as a system drive.
- Excellent sequential reading and writing performance, even
at very low queue depths. - Outstanding 4k random reading performance at high queue
depths. - Outstanding mixed read/write performance.
- TRIM support under Windows 7, Windows 8, and Windows 10.
- Completely silent operation.
- Fast operating system start-up and shutdown times.
- Very good power efficiency.
- Excellent price.
- 5 years ‘Advanced Warranty Program’.
- Free Acronis True Image HD for backing up and restoring
the VX500.
Negative:
- Nothing to mention.
To sum up, this is what I
would say:
As an operating system drive, the Toshiba OCZ VX500 512GB
SSD is pretty hard to fault. Performance is outstanding as a system drive, and
as fast as any of the other high performance SATA SSDs I have tested. The Toshiba
OCZ VX500 SSD also proved to be very stable during the testing period.
If one was to base their opinion on the Toshiba OCZ VX500
solely on the performance indicated by synthetic benchmarks, then one could
possibly be underwhelmed with the VX500. We at Myce learned a long time ago,
that basing our opinion on a SSDs performance solely on the results obtained
with synthetic benchmarks could be misleading.
Whilst one should not ignore synthetic benchmarks, over the
years we have learnt that ‘real world’ tests prove to give a far more accurate
picture of how an SSD really performs. In the real world, the Toshiba OCZ VX500
proved to be an outstanding performer. Finishing at the top, or nearly at the
top of every real world test I ran.
The Toshiba OCZ VX500 also proved to be energy efficient,
especially when reading or writing sequential data. It also proved to be very
energy efficient when idling and doing no work at all; this is important,
because consumer PC’s tend to spend quite a lot of time doing no work at all.
The Toshiba OCZ warranty is one of the best, if not the best
warranty around. If the SSD should develop a fault within the five year
warranty period, simply contact Toshiba OCZ, and they will ship you out a brand
new SSD as an advanced replacement, and include pre-paid return packaging to
return the faulty SSD.
Price and availability
The Toshiba OCZ VX500 512GB SSD should be available soon,
with suggested pricing as follows. VX500 128GB $63.99, VX500 256GB $92.79,
VX500 512GB $152.52, VX500 1TB $337.06.
The parting sentence is:
“The Toshiba OCZ VX500 512GB SSD’s performance in the
‘real world’ is outstanding".
Rating system
The editor rating is based on the following key factors.
- Performance
- Stability (is the device stable?)
- Price
- Warranty
- Supplied accessories (what is included in the package)


Thanks to:
|
|
EFD Software for |
|
|
Alex |
|
|
|
|
|
FutureMark for |
|
|
Quarch Technology for |


You may comment on this review here.


")


