 |
Review: Kingston |
|
|
Kingston is the leading name when it comes
to RAM and USB Flash drives, over the last few years Kingston has also entered the
SSD market and has shown that they want to play a leading role here too. Their
enthusiast line, the HyperX
has shown some very impressive results. What happens when you want to have the
benefits of an SSD and you don’t want to pay the premium price for an enthusiast
drive?
You simply look for the value/business
line, and the V+ 200 is that drive. The V+ 200 is built around the SandForce
controller, but this time Kingston is using asynchronous NAND, instead of the toggled
NAND that we saw in my previous review. The main benefit in using asynchronous
NAND is that it's cheaper, but it remains to be seen if the asynchronous NAND
has any impact on the performance of the SSD.
Kingston was kind enough to send me the V+
200 SSD for review. The V+ 200 is Kingston’s business line SSD and can be found
in 60GB/90GB/120GB/240GB and 480GB capacities so that you can get the drive
that fit best your needs. It offers sequential read and write speeds up to
+500MB/Sec. In this review I will be taking a closer look at the Kingston V+
200 240GB SSD.
Kingston's SSD product line can be found here.
Kingston company information
In 1987, Kingston® entered the market with a single product.
Founders John Tu and David Sun addressed a severe shortage of surface-mount
memory chips with a memory module that would serve to redefine industry
standards for years to come. You can read the full
history of Kingston by clicking here.
The Kingston V+ 200 240GB SSD
Time to take a closer look at the package
and what comes shipped with.
Packaging
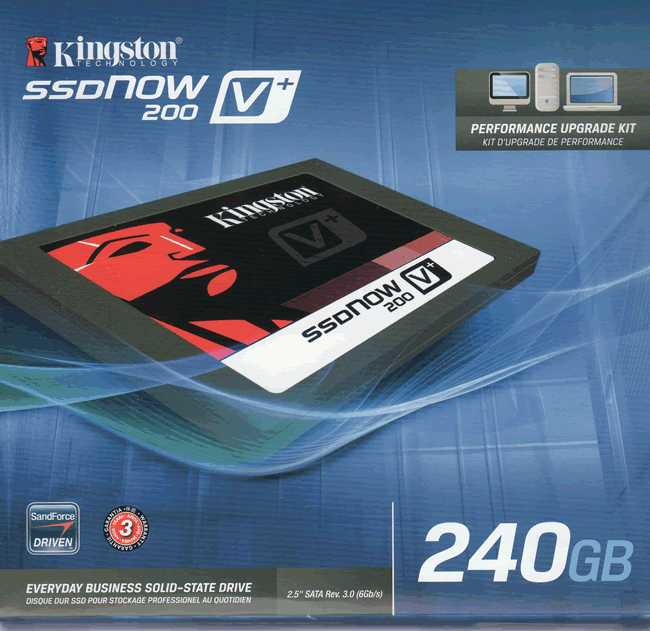
Box front
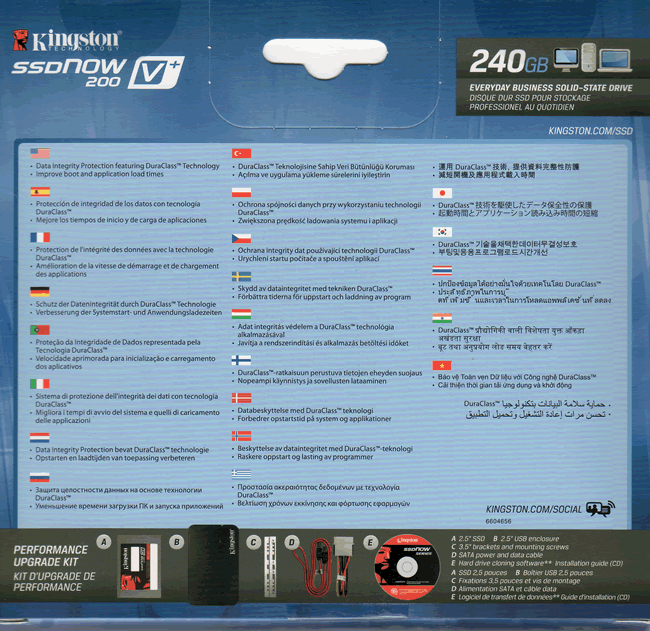
Box rear

Bottom
of the box
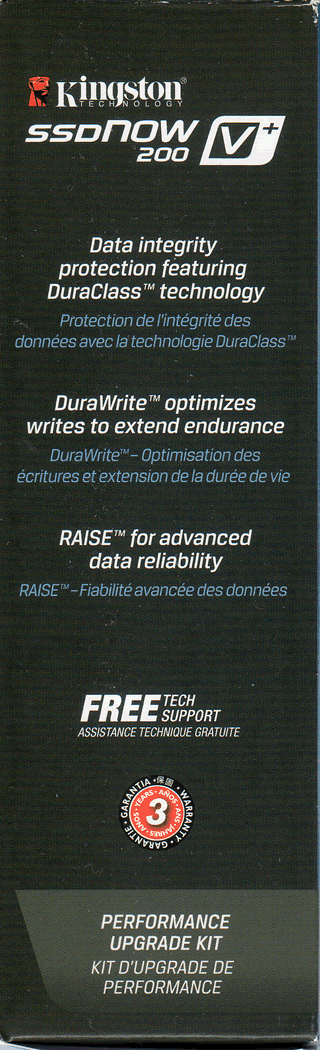

Box
left and right
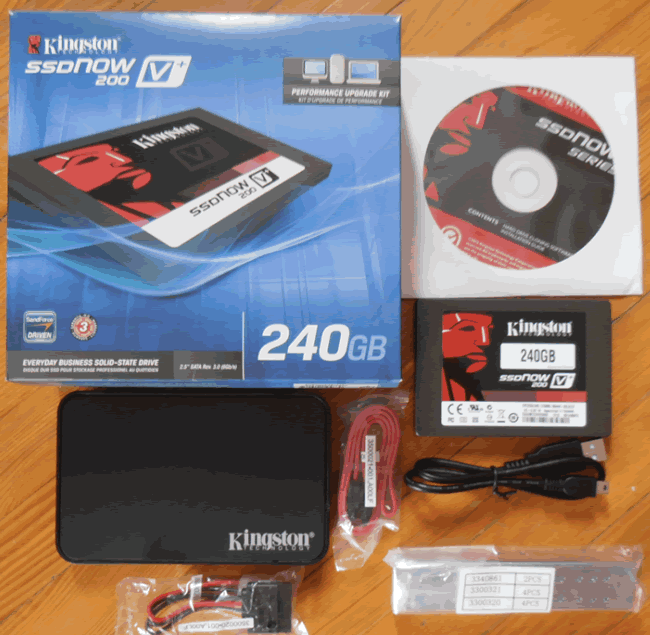
Inside the box
A closer look on the drive
The package contained the V+ 200 SSD, mounting
screws, a 3.5 mounting bracket, a bootable CD-ROM containing the Acronis True
Image software and an instruction manual, an SATA cable and a USB cable for the
included external enclosure, and a screw driver.
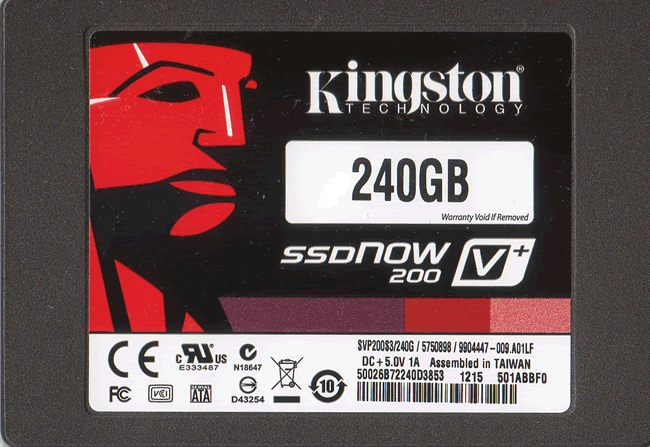
The Kingston V+ 200 SSD
The upper side of the Kingston V+200 is
very simple, with a sticker showing all the info that you need. As we can see
the drive is made in Taiwan.
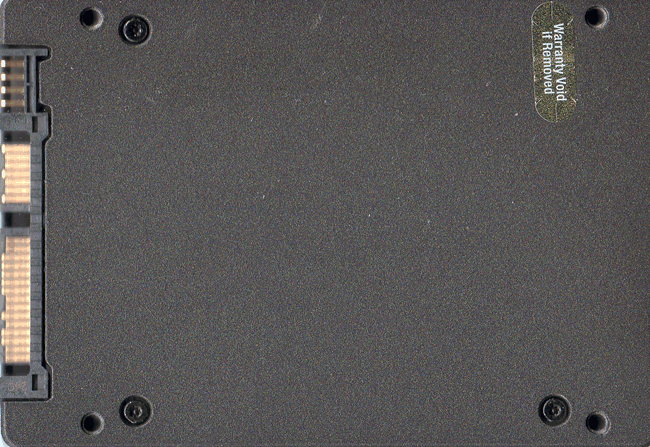
Drive underside
The underside of the drive has the SATA
power and data connectors.
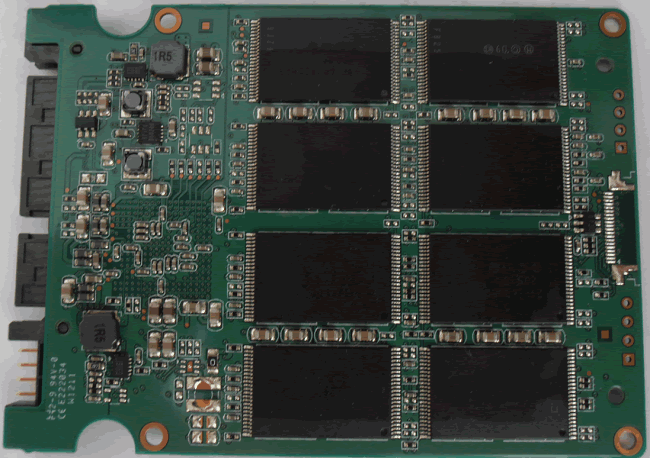
On
the top side of the circuit board we can see eight NAND chips.
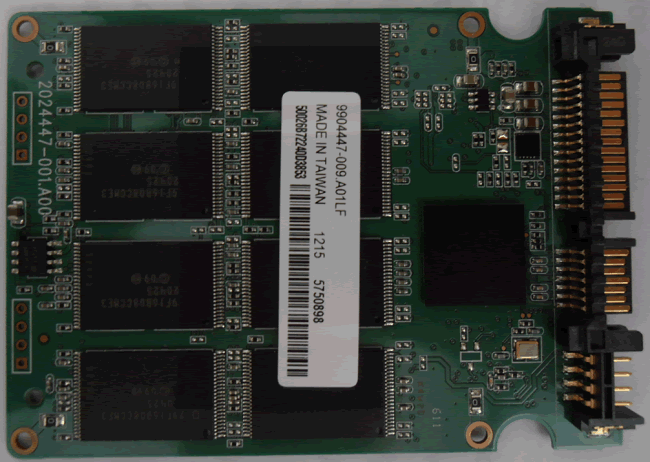
On
the bottom we can see another eight NAND chips and the SandForce controller.

A
closer look at the NAND,
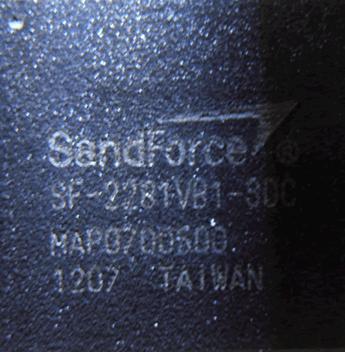
and
the SandForce controller.
Specifications
The following specifications can be found on
Kingston's website.
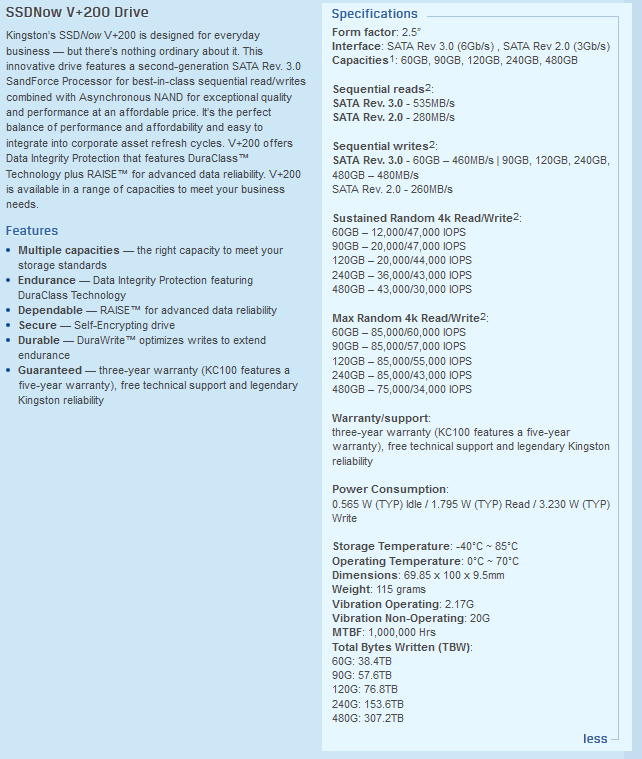
From the above picture we can get a more
detailed view of the Kingston V+ 200 SSD. The V+ 200 240GB SSD has a read speed
of up to 535mb/sec and a write speed of up to 480mb/sec. The drive has also a
three year warranty.
CrystalDiskInfo

Above
we can see some more info about the Kingston V+ 200 SSD.
Let’s head to the next page where we
take a look at our testing methods and the review PC.
Test machine
For this review I will be using a computer
with the following configuration:
Hardware:
- Motherboard: AsRock Z68 Extreme 4 (Intel Z68
chipset) - Processor: Intel 2nd generation
Core i5 2500K - RAM: 8GB Kingston Hyper X DDR3 1600MHz (dual channel)
- GFX: Onboard Intel HD 3000
- Sound: Onboard Realtek ALC889 HD audio
controller - Hard disk OS: Western Digital Blue 500GB
- PSU: Corsair CX430 430W
- Display: Futsiju Siemens 22”
- Operating System: Windows 7 Ultimate 64bit with
Service Pack 1
The Kingston V+ 200 SSD was connected to the
Intel native SATA 6Gbps (port 0) on the Z68 motherboard of our review PC and
all tests on the drive were carried out with the drive connected to this port.
AHCI mode was also selected for all drives
in the UEFI of our test PC, and all tests were carried out in this mode.

The SATA 6Gbps drivers used on our review
PC were the Intel Rapid Storage Technology (RST) Version 10.6.0.1002.
Test applications
To test the performance of the Kingston V+
200 240GB SSD, I will be using the following test applications in this review.
- HD Tune
Pro - ATTO
- Iometer
- AS SSD
Benchmark - CrystalDiskMark
- Anvil’s
Storage Utilities
Test procedures
I will start off our testing procedures
explanation by stating that I did not run many synthetic benchmarks on the
Kingston V+ 200 SSD. You may ask why I have run so few synthetic benchmarks?
SSD technology has moved so fast in the
last couple of years, that basic synthetic benchmarks alone are now of very
limited use, as they don't really tell us much about performance and how the
drive will behave in the real world. I have therefore decided to show some
basic benchmarks for the Kingston V+ 200 SSD, and will complement this with
advanced benchmarks using IOMeter and AS SSD benchmark. I will also show how
the Kingston V+ 200 SSD performs in the real world.
The reality of SSD performance
While I can easily show you which SSD is
technically the faster, when you use one of these modern SSDs as an operating
system drive it becomes very difficult to tell them apart as far as performance
is concerned.
A typical use of a small capacity SSD at
the moment is to have your operating system and applications installed onto the
SSD. The performance difference compared to a traditional HDD is enormous,
however when you start to compare SSD to SSD the difference becomes almost
impossible to detect.
Let’s look at why this is the case.
Drive A can boot to the desktop in 8.11
seconds, and drive B can boot to the desktop in 8.12 seconds, the difference in
time is milliseconds, and can one really tell the difference?
The fact is, all modern SSDs are only
ticking over when they are only running the OS and launching applications, it’s
only when you get to some of the larger capacity SSDs, with enough free space
to be able to hold the actual data that you’re going to be working with, be
that video, audio or pictures, for example, that you actually get a tangible
difference in performance. This is where the SSDs with the better sequential performance
start to pull well ahead of the SSDs which have lower sequential read/write
performance.
Small file random IOPS vs sequential performance
IOPS
This is a fairly complex subject, but I
will do my best to explain things in a manner that is easy to understand.
The term IOPS is the amount of input or
output transactions that can take place in a one second interval, so for
example, if an SSD is quoted as being able to cope with 20,000 4K random write
IOPS, then the SSD should be able to cope with 20,000 input transactions in a
period of one second. If the same SSD is said to be able to produce 20,000 4K
random read IOPS, then the same SSD should be able to produce 20,000 4K random
read output transactions in a one second interval.
Ok, now we have some figures to work with,
the next question is how many IOPS are actually required?
This will depend on your usage pattern. If
you are a typical desktop user who browses the internet, does some word
processing or perhaps some audio or video editing, and perhaps plays a few
games, then in actual fact, you don’t need to have massive 4K random read/write
performance. The actual amount of 4K random performance that is required for a
fast and smooth running system for a desktop user with a usage pattern similar
to the above will be well under 1,000 4K IOPS.
On the other hand, if the SSD is being used
for running a large and complex database server, then 4K random performance is
the absolute measurement of how fast that server will run, as this type of
application does most of its input and output transactions in the 4K domain.
So why would I need an SSD with 80,000 4K
IOPS for a desktop?
In fact you don’t need this type of
performance for a desktop, but an SSD which is capable of coping with 80,000 4K
IOPS will be faster than an SSD which can only cope with 20,000 4K IOPS.
OK, I just said if under 1,000 4K IOPS are
actually required for typical desktop usage, why is an SSD with 80,000 4K IOPS
faster than an SSD with only 20,000 4K IOPS, confused?
You may ask, if I only require 1,000 4K
IOPS surely the rest is wasted?
While you may never need 80,000 4K IOPS,
IOPS is all about latency. The reason that an SSD can cope with as much as 80,000
4K IOPS is because latency in this domain is very low. With 4K files, even if
you require to process 500 of them at the same time, you are not talking about
a huge amount of data, it has far more to do with how long it takes the SSD to
process a single file, and the amount of time required to process a single 4K
is all about how long it takes for the SSD to access or store that data before
it can move on to the next transaction.
In other words an SSD with 80,000 4K IOPS
performance will handle those 500 files faster than the SSD with 20,000 IOPS.
So how will a desktop user even notice this
faster speed if so little 4K random IOPS and data are actually used?
Multitasking is a good example. The more
tasks you run at the same time, you more you will notice the speed difference.
Sequential performance
I have always maintained that sequential performance
was every bit as important as small random file performance for a desktop SSD.
Some highly regarded people on other sites found this statement quite funny a
couple of years ago when I made it, but my, how times have changed in the world
of SSD reviewing.
To me this was always so obvious for a
desktop user. For example, let’s say you want to launch an application or game.
Both have some fairly large files to load, and also a great many small files,
but the point is, even the smaller files are sequential in nature. Now let’s
say you’re into audio or video editing. Video files tend to be huge, and the
files are written or read sequentially. Isn’t this how many users are using
their PCs these days?
Summary
So how does this shape up in the real
world? Which is better, massive 4K IOPS or massive sequential performance?
In an ideal world you want both, as an SSD
with massive random 4K IOPS and sequential performance will always be faster
than an SSD that has high sequential performance and moderate 4K random IOPS
performance, and the same applies to an SSD that has massive 4K random
performance and moderate sequential performance. The SSD which has high
performance in both patterns will always be the faster SSD.
However, you can still have an SSD that is very
fast for desktop use that has moderate random 4K performance and massive
sequential performance, the same can be said about a drive having massive
random 4K performance and moderate sequential performance, as it is about
getting the balance right if you have to compromise on one or the other.
Drive preparation for running the tests
All the SSDs used in this article were in a
clean and fresh state when the testing period started. From then on, each drive
had to rely on its own NAND cleaning effectiveness for the remainder of the
tests.
- Both our spinning HDD drives were
defragged before the start of each test.
- All SSD and HDD used in this article had
their partitions aligned to the Windows 7 x64 defaults.
Where I use graphs in this article to
display results, I will use the following colours to make it easier, for our
readers to see which drive we are reviewing.
![]() Kingston V+ 200 240GB
Kingston V+ 200 240GB
SSD
![]() Comparison SSD
Comparison SSD
![]() Comparison HDD
Comparison HDD
Now let's head to the next page, where I
look at some basic benchmarks...
Reading Benchmarks
HD Tune

HD Tune – Sequential reading test
I present the graph below for comparison
with other recently tested drives.

The performance of the Kingston V+ 200 is good
for a drive that uses asynchronous NAND.
ATTO disk benchmark
ATTO has become a standard tool for
measuring the data throughput of HDD and SSD. It measures the performance of
reading and writing, using different file sizes and block sizes.

As we can see ATTO not only verifies the
numbers that Kingston reports, but in this case it’s able to show an impressive
result for both read and write speeds. The write speed is up to 531MB/Sec write
and the read speed is 550MB/Sec.
CrystalDiskMark 3.0
Crystal Disk Mark is quite a handy
benchmarking application, as it focuses on the file sizes that can cause a
problem on a system drive.

By default the CrystalDiskMark uses random
data, and we can get a more realistic view of how the drive performs. In this
case the Kingston V+ 200 shows its limits, mainly because of the asynchronous
NAND that it uses.
AS SSD Benchmark
AS SSD benchmark is a benchmarking tool
specifically designed to test SSDs. The application tests sequential reading
and writing performance, 4K random reading and writing performance.
AS SSD benchmark also tests 4K threaded
performance. This is very exciting, as this test is the first available test
that I am aware of, that simulates how a PC operating system actually works. A
modern PC and OS, such as Windows Vista/7 does not just run a single thread at
a time, it runs many threads. The AS SSD benchmark "4K 64Thrd" tests
run 64 threads simultaneously throughout the test. If this result is good, then
you can be pretty sure the drive will perform extremely well as a system drive.
After the tests complete, AS SSD benchmark
derives a total score for the drive being tested. This is based on all aspects
of the test results, and gives an indication of how the drive is performing
overall.
Now let’s look at the result for the Kingston
V+ 200 SSD in the form of a screenshot. All our other comparison drives’
results are presented in the form of a graph.


Again we can see that the performance is
acceptable.
Summary:
The Kingston V+ 200 SSD has good
performance if you want a drive to use in an office environment, if you are an
enthusiast you should look at the HyperX
series.
Let's head to the next page for our
IOMeter test results.....
I/O Performance
There is little point of having an SSD
drive that has blazing sustained reading and writing speeds, if the drive can't
handle reading and writing of small random files. If you intend to use your new
SSD drive to store and run your operating system, then the drive must be able
to cope with the many small random files that Windows will write to the drive
continually. So I feel it is very important to test how many of these random
files that a drive can handle in one second. I believe that anything over 1,000
I/O’s per second would be enough for most users running a consumer grade
mainstream PC, and should provide a smooth running system. But obviously, the
more I/O's that a drive can handle, the faster the drive will feel and leave more
headroom for those huge multitasking sessions that users sometimes engage in.
The things that I will look at are the
total I/O per second and total MB/s.
Partition alignment and sector boundaries
Windows 7 and Vista will automatically
align a partition to 4k boundaries during partition creation, Windows XP won’t.
It is imperative that an SSD’s partition is aligned. Windows XP is also
restricted to sector boundaries, while Windows 7 will use 4k boundaries if it
can. The Intel 510 is 4k boundary aware, and will use these boundaries if
possible. Of course it will also remap LBAs for compatibility with the sector
boundaries so that the drive can be used with Windows XP.
IOMeter allows us to set the sector
boundaries for conducting the tests, and I have therefore set the sector
boundaries at 4K, which means the IOMeter tests are valid for Windows 7 and
Windows Vista users. XP users will not be able to obtain such results.
I will provide a screenshot of the tests on
the review drive for those of you who like to see the actual test result. All
the comparison drive results are represented in the form of graphs.
If any of you would like to see a
screenshot from any IOMeter test on a particular drive, please feel free to
request one, and I’ll post the screenshot in the forum thread.
All the IOMeter tests create a 10GB data
set on the target drive, and each test is run for a duration of 3 minutes.
IOMeter 4K random write test with repeating data.
The first test involves creating continual
4KB random files on the target drive with IOMeter. I use a 4KB file size, as it
is believed that Windows will create and modify many of this size of file
constantly in the background during a typical Windows session. It is said that
most 4K random writes take place at a queue depth of only one, and I have been requested
to include this test in my reviews.
Queue depth 1

Kingston V+ 200 240GB SSD – 4K random write (QD1)

The Kingston V+ 200 SSD shows impressive
performance, topping out at 68.47 MB/Sec.
Queue depth 4

Kingston V+ 200 240GB SSD (Queue depth 4)

The Kingston V+ 200 SSD continues to show great
performance.
Queue depth 32

Kingston V+ 200 240GB SSD (Queue depth 32)

The Kingston V+ 200 SSD shows limited
performance on this test.
IOMeter 4K random read test.
If there are many 4k files created, then
that must also mean that many 4k files need to be read. This test measures 4k
reading performance.
It is said that most 4K random reads take
place at a queue depth of only one, and readers have requested that I include
this test in my reviews.
Queue depth 1

Kingston V+ 200 240GB SSD (Queue depth 1)

Again the Kingston V+ 200 shows great performance
with a maximum speed of 30.38 MB/Sec.
Queue depth 4

Kingston V+ 200 240GB SSD (Queue depth 4)

The Kingston V+ 200 in this test gives an
average performance.
Queue depth 32

Kingston V+ 200 240GB SSD (Queue depth 32)

The Kingston V+ 200 SSD gives us an average
result of 134.83 MB/s.
IOMeter 512KB write test with repeating data.
Sequential writing performance is also very
important; in this test sequential writing performance is measured.

Kingston V+ 200 240GB SSD 512K Sequential write with repeating data

The Kingston V+ 200 SSD achieves a speed of
486.57MB/Sec. A very good result.
IOMeter 512KB read test.
This test measures 512k sequential reading
performance.

Kingston V+ 240GB SSD – 512K sequential reading test

When it comes to reading, the Kingston V+
200 gives a very good result, max read speed is 497.20 MB/Sec.
IOMeter Workstation simulation (outstanding I/Os = 64).
When running applications you will find
that there is a mixture of small random files and larger sequential files,
being created and read. Not only that, it isn’t just one file at a time. In
this test I measure a simulated workstation pattern, with a queue depth of 64
(threaded).

Kingston V+ 200 240GB SSD – Workstation simulation

Once again the Kingston V+ 200 SSD gives an
acceptable performance.
Summary
Overall, the performance of the Kingston V+
200 SSD gave us some good results, but on some tests it falls short of the
competition mainly because of the asynchronous NAND that it uses.
Now let’s head to the next page where we
will look at how the Kingston V+ 200 SSD performs using a brand new
benchmarking application....
Anvil’s Storage Utilities
As well as performing SSD endurance tests.
Anvil’s Storage Utilities has a very nice SSD benchmarking application. The SSD
benchmark tests many different aspects of SSD performance, including 4K random
at different queue depths, and also sequential performance, but more importantly
than this, all using real test data.
Another very nice feature of Anvil’s SSD
benchmark is the fact that you can change the compression levels of the test
data. The compression levels of the data sets used for the tests can be varied
from 0% compression right up to 100% compressed data, and there are even a few
data profiles already included, such as database (8%) compression, and also an
application profile (46%) compression, which is designed to simulate real
application data being read and written to the SSD.
Anvil’s Storage Utilities is still in beta
at the moment, but the application is currently solid enough to use in this
article, and I have already verified the results obtained using an SATA
analyser.
I will include a screenshot of the review
drive, and all comparison results will be presented in the form of graphs. If
you would like to see screenshots of the test results obtained on the other
SSDs in this article, you can do so by following the link here.
I will also be testing three different
compression profiles, which are as follows.
- 0 fill (100% compressible data)
- Application simulation profile (46%
compressed) - 100% (non compressible data)
So let’s begin the tests.
0 fill

Kingston V+ 200 240GB SSD (0 fill)

Total score

Writing score

Reading score
The performance of the Kingston V+ 200 SSD
is very good when it comes to compressible data.
Application profile

Kingston V+ 200 240GB SSD (application profile)

Total score

Writing score

Reading score
We see that the performance of the Kingston
V+ 200 SSD is simply good.
100% incompressible

Kingston V+ 200 240GB SSD (100% incompressible)

Total score

Writing score

Read score
The Kingston V+ 200 SSD shows poor
performance when it comes to incompressible data.
Summary
The performance of the Kingston V+ 200 SSD
varies, it's very good with compressible data but beyond that the asynchronous
NAND is starting to show the limits of the drive.
Now let's head to the next page for some
real world tests....
It has become clear that simply conducting
endless benchmarks on SSD drives is pointless. Real users may run a few
benchmarks when they first fit their SSD drive, but most users just want a
drive that performs well in the real world. They want their drive to work
"out of the box" and work fast and smoothly.
Most of the latest SSD drives can deliver
very fast sustained reading and writing speeds, but these alone tell you very
little about how the drive will perform in the real world.
If you intend to use your SSD as your
primary system drive, with an operating system and applications installed and
running from the drive, real world performance is much more important than just
fast sequential read and writ speeds.
Real
world copy tests
I will now conduct a few real world copy
tests. In these tests I try to simulate what real users do with their drives. I
will be copying some mp3 files, various picture files, and installing MS
office.
I should point out that this is not a
scientific way of measuring performance. These timings were taken with a stop watch;
I have however ensured that the reading drive is well able to supply a data
stream to our writing drive, which is high enough not to be slowing down the
performance of the writing drive. The source drive will be the Crucial M4.
I will once again be comparing the obtained
results with our comparison drives, and will present the results in the form of
graphs.
Copy tests – 259 MP3 song files (1.36GB total)

The Kingston V+ 200 showed some very
impressive performance.
Copy tests – 3,377 JPEG picture files (2.56GB total)

Again the V+ 200 SSD gives a very
impressive result.
Windows start-up and closedown
For these tests, I simply used a stop watch
and tested the amount of time taken for a full installation of Windows 7 to
boot to the desktop, and then timed how long it took for Windows 7 to close
down by the normal start menu method. From now I will also be adding the time logged
by the Windows Event Viewer for start-up and shutdown.
The timing was started once the BIOS had
initialised and reached the “loading OS message”.

Windows 7 boot time

Windows 7 closedown
As it was expected the differences in start-up
and shutdown times are very small compared to with the rest of the drive that I
have tested. I would say that in real use you won't notice any difference in performance.
Event Viewer Logs
First boot and shutdown
Again I have decided that I will also
provide the start-up and shutdown times that the Windows Event viewer logs.

The
first boot

First
shutdown
Below is a comparison with the Kingston V+
200 SSD

First
Boot

First
Shutdown
First Shutdown
The next two screen shots were taken after I'd
installed all the drivers and all the software that I use every day. Below are
the results.

Used
state boot time

Used
state shutdown time

Used
state boot time.

Used
state shutdown
It was expected that the start-up and
shutdown times would be increased as we installed more software, however the
times are very good compared to the Kingston V+ 200 SSD that I have previously
tested.
Installing applications
Installing applications is possibly
something you don't do that often. But should you replace your system disk,
then you will most likely have to re-install your applications. Most of the SSD
drives I have tested up until now are quite slow at installing applications,
most likely because their I/O performance was quite limited.
For these tests, we picked some popular
applications and copied the entire contents of the CD or DVD media to a Crucial
M4 256GB SSD. We did this to make sure that the reading speed of our CD/DVD
reader would not hamper the performance of the target drive.
We then installed these applications onto
our comparison HDD drives, which were all running mirror image installations of
our Windows 7 Home Premium 64-bit installation, and timed the amount of time
taken to install the application with a stopwatch on each of the drives.
MS Office 2007 Professional (full install)
Now let’s see
how the Kingston V+ 200 SSD performs with the installation of MS Office 2007
Enterprise Edition.
The procedure
followed was very simple, I copied all the files from the CD to the Crucial M4
SSD and the Crucial M4 was used as a source drive for the installation of MS
Office 2007.

An very
good result.
Speed degradation after heavy testing
On this page I will test how the SSD
performs after heavy testing and usage.
I will run an AS SSD benchmark test when
the OS if freshly installed so that we can get a good view of how the drive
performs with the OS. After that I will fill the drive up to 50% of its
capacity and use the drive for a few days, before re-running the AS SSD
benchmark. The same procedure will be followed once again, but this time the
drive will be filled close to 90% of its capacity, and to finish this test, I
will simply delete all the extra data and leave the PC idle for a few hours so
that the controller has the time to perform any necessary cleaning, then we
will test how the drive performs.

First run with the OS

the
drive filled at 50%

and
now the Kingston V+ 200 is filled at 90%

and
finally the drive with only the OS and some everyday applications.
After a week with everyday abuse. almost
4TB was read and 3TB was written during this week and we can see that the
asynchronous NAND is able to restore some of its original performance. Also
it's worth mentioning that the drive never struggled during this week, it kept the
same blazing fast performance that we are used to getting from an SSD.
This concludes our review. To read the final
thoughts and conclusion, click the link below....
Final thoughts and the conclusion
To sum up, this is
what I would say:
Finishing a review isn't always a simple task, and this is
one of these times. The Kingston V+ 200 comes as as part of an excellent
package, with a good warranty and also a very nice price. Speaking about price;
here in Greece the 240GB drive has a starting price of 226 Euro and on amazon.co.uk is £179. The overall performance of
the Kingston V+ 200 is very good especially for everyday use.
What about numbers?
Numbers will only tell you one part of the story. Yes the
Kingston V+ 200 isn't the fastest drive when it comes to incompressible data.
The other side to the story is how the drive can perform in your system. For me
that is the main thing that people would need to consider, especially if you
are not looking for the fastest benchmarking drive. The Kingston V+200 is able
to provide amazing performance, with very fast load times, as we would expect
from an SSD.
Conclusion:
Let us summarise the most important
positive and negative points below:
Positive:
- Excellent operation as a system drive.
- Excellent sequential read/write speeds on
sequential data - Very good access times.
- SATA 6Gbps support.
- External case and cloning software
included in the package. - TRIM support under Windows 7.
- Fast operating system start-up and
shutdown times. - 3 year warranty.
Negative:
- Asynchronous NAND.
The parting sentence is:
“The Kingston V+ 200 has shown good
performance overall. It also comes with a great packaging and a three year
warranty, but most importantly with a low price. If you are looking for an SSD
that will give life to your laptop or your desktop PC without spending a lot of
money, then this drive is one to look at very closely”.
I therefore give the 'Very Good' rating to
the Kingston V+ 200.

Thanks to:
|
|
EFD |
|
|
Alex Schepeljanski for |
|
|


"You may comment on this review below. Also, feel free to post in
our SSD forum if you have other SSD related questions or content you want to share with the
community."


")


